

It has been a while since Robert Scribbler wrote. I have missed his regular articles, which bring much clarity to a complicated area of science
Winter 2013-2014: Sea Ice Loss Locks Jet Stream into Severe Winter Storm Pattern For Most of US
Winter 2013-2014: Sea Ice Loss Locks Jet Stream into Severe Winter Storm Pattern For Most of US

8 December, 2013
It happened to Europe last year. A persistent erosion of Arctic sea ice set off changes to the polar jet stream that locked in place a severe winter weather pattern that pummeled the central and western European countries for much of the winter. Storm after storm piled snow high in locations that typically saw only modest winter precipitation while other areas were simply buried. The US also took a glancing blow from this extreme storm configuration. But now, with a large trough in the polar Jet remaining locked in place for almost a year, the US from the Rockies eastward appears to be in the line of fire for some very severe winter weather.
In other regions from Alaska to Eastern Europe, record or near record warmth and dryness have settled in with a large swath of eastern Europe showing average temperatures more than 6 degrees Celsius above the seasonal average. Over the extreme northern Pacific, adjacent to Alaska and the Bering Sea, seasonal temperature range from 4-12 degrees Celsius above average. And it is this extreme northward invasion of warm air that is displacing polar and Arctic air masses toward the east and south, putting much of the US in the firing line for strange and severe winter weather.
Just this week, the tale was one of record ice storms throughout the central and eastern US with hundreds of flights cancelled, deadly traffic pile-ups, and holiday shopping disrupted. On the east coast, from Virginia to Maine, workers and shoppers alike were treated to three days straight of snow turning to sleet and freezing rain and then turning back again to snow. With storms like these hitting in early December and with the pattern in the Jet Stream taking on such an extreme configuration, it appears possible that the winter of 2013-2014 could be a very, very stormy one indeed.
A Tale of Jet Streams and Melting Sea Ice
To understand how human caused global warming can make winter storms more severe in some areas while other areas hardly experience winter at all, one should first take a look at two major governors of Northern Hemisphere weather: the circumpolar Jet Stream and Arctic sea ice.
An extreme difference between the temperatures at high northern latitudes and at more temperate latitudes has driven a very rapid flow of upper level air called the Jet Stream for almost all of human meteorological reckoning. This high temperature difference drove powerful upper level winds from west to east. These winds tended to modulate only slightly and when they did, powerful weather events tended to occur.
Locking a greater portion of this cold air in place was the northern hemisphere ice cap, most of which was composed of a large swath of sea ice covering much of the northern oceans. This high volume of cold, reflective ice kept temperatures up north very, very low and provided the massive temperature differences which kept the Jet Stream predominantly flat with only occasional and more moderate severe weather causing ripples and bulges.
But since 1979, massive volumes of sea ice have been lost due to an immense and ongoing human caused warming trend taking hold in the Arctic. As human greenhouse gas emissions sky-rocketed, Arctic temperatures rapidly increased far faster than the global average. By this year, human greenhouse gas emissions had driven CO2 levels to the highest seen in more than 3 million years while Arctic temperatures are now warmer than at any time in the past 150,000 years. Sea ice retreat has been equally unprecedented with average winter values now 15-20% below extent measures seen during 1979 and with end summer sea ice extent values now a stunning 35-50% below that of 1979. Sea ice volume, the measure of total ice including its thickness, has shown even more stunning losses since 1979 with seasonal winter values 30-35% lower than in 1979 and end summer values between 65 and 80% lower during recent years.

(Sea ice extent measure composed by JAXA. The light gray dotted line on the top shows sea ice extent averages during the 1980s. The three record lowest years — 2007, 2011 and 2012 — are shown in green, blue, and orange. The most recent year, 2013, is shown in red. Note the persistent and rapid melt trend.)
The loss of hundreds of thousands of square kilometers of sea ice radically reduces the Arctic Ocean’s ability to keep the Arctic cold. To the contrary, we see larger areas of open water that, in turn, radiate ocean heat into the atmosphere throughout winter. As a result the temperature difference between the Arctic and temperate regions is less and this, in turn, slows down the Jet Stream.
When the Jet Stream slows, it tends to meander. And when it meanders it creates very deep troughs and very large ridges. In the ridges, we get unseasonably hot temperatures along with increased risk of drought. And in the troughs, Arctic air swoops down to collide with warmer, moist air in a series of powerful storms. During the summer time, the hot, dry zones can bring deadly heat waves, record droughts, and major wildfires while the cooler stormier zones can bring epic rainfall events or even link up with tropical cyclones to result in highly severe hybrid storms. During the winter time, the hot zones can almost completely obliterate the winter season, while the stormy cooler zones can result in snow storm after snow storm.
Don’t believe me? Then take a look at what weather experts Jeff Masters and Jennifer Francis have to say on the matter:
Polar Warmth and Rossby Wave Pattern Going into Winter 2013-2014
As noted above, a powerful and continuous ridge in the Jet Stream over the north eastern Pacific near Alaska has persistently provided an equally powerful down-sloping trough over much of the US over the past year. The December 10 Jet Stream configuration map shows this pattern remaining locked in place:

Note the strong multi-channel ridge to the south of Alaska and to the west of Canada diving down into a deep trough with convergent upper level air flows over the central and eastern US.
On the map, we also see powerful ridges and correlating warmer regions over Europe, Central Asia, and the western Pacific. These large meanders are now typical to the highly weakened Jet Stream pattern we have seen in recent years due to loss of polar sea ice.
Global temperature maps also show anomalously warm temperature departures for much of the Arctic as well as for regions beneath these powerful jet stream ridges. Note that the only northern hemisphere region showing strong anomalously cool conditions is a large swath adjacent to the large trough over North America and southern Greenland.

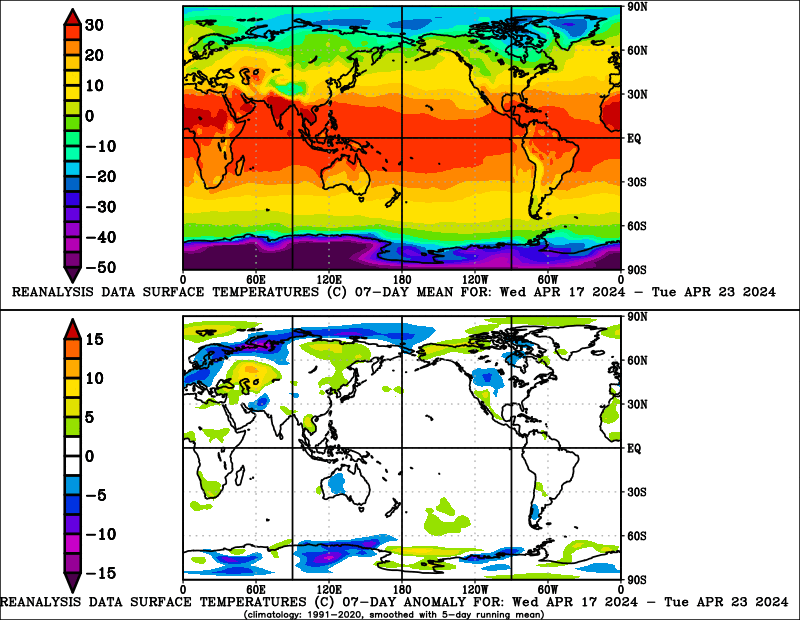
Temperature averages in the Arctic region of Kamchatka, the Bering Sea, the Chukchi Sea and Alaska have ranged between 11- and 12 degrees Celsius above average for the first week of December with much of the Arctic showing 4-12 degrees Celsius above average readings. The US and southern Canada, conversely, have shown temperatures 4-10 degress Celsius below average. It is also worth noting the massive swath of 3-12 C above average temperatures stretching all the way from the Middle East to the west coast of Greenland.
Overall, the prevalence of high latitude warmth and a continued high amplitude Rossby wave pattern trough over much of the US is a very conducive pattern for severe winter weather over the coming weeks. Most likely, this pattern will continue to persist through at least early to mid winter. So for the US and especially from the Rockies to the east coast, a progression of strong storms is likely to continue as winter advances.
Links:
Supporting Research:
Typhoon Season 2013: Anomalously Hot Pacific Disgorges Record 52 Cyclones by Early December

8
December, 2013
Back
in January, on January 1st in fact, the first cyclone of this year’s
Eastern Pacific Typhoon season formed. It would be one of at least 52
tropical depressions, storms, and typhoons that would rake through
this vulnerable region over the next 11 months — resulting in over
7,000 deaths and tying a record for the most storms set 49 years ago
in 1964.
The
typhoon season that would repeatedly rake the Phillippines with
monster storms and disgorge the strongest cyclone — Haiyan — to
ever make landfall came on, at least in part, due to anomalously hot
Pacific Ocean waters. Throughout the year, a large swath of the
Western Pacific remained between 2 and 5 degrees Celsius above the
1979-2000 average. This stretch of water reached 90 degrees
Fahrenheit during the summer of 2013, contributing to the extremely
hot air mass that set off temperature record after temperature record
in southeastern China from late July through early August.
According
to reports from NOAA, not only was this mass of water very warm, its
warmth extended far into the depths of the Pacific. NOAA’s report:
Deep
Warm Water Fuels Haiyan Intensification
linked the anomalously deep and hot water to Haiyan’s rapid
intensification as well as provided a basis for understanding why so
many cyclones had formed during the, very prolific, typhoon season of
2013.

NOAA
noted:
The
intensification of Super Typhoon Haiyan is being fueled by “ideal”
environmental conditions – namely low wind shear and warm ocean
temperatures. Maximum sustained winds are currently at 195 mph, well
above the Category 5 classification used for Atlantic and East
Pacific hurricanes. Plotted here is the average Tropical Cyclone Heat
Potential product for October 28 – November 3, 2013, taken directly
from NOAA
View.
This dataset, developed by NOAA/AOML,
shows the total amount of heat energy available for the storm to
absorb, not just on the surface, but integrated through the water
column. Deeper, warmer pools of water are colored purple, though any
region colored from pink to purple has sufficient energy to fuel
storm intensification. The dotted line represents the best-track and
forecast data as of 16:00 UTC on November 7, 2013.
It
will only take the formation of one more cyclone to break the
all-time record number of storms formed back in 1964. With 6 cyclones
having formed since Haiyan ripped through the Philippines in early
November and with Pacific Ocean temperatures remaining anomalously
hot, it appears possible that 2013 will break this long-standing
record.
For
years, researchers have debated whether increasing ocean heat content
due to human caused global warming will result in more numerous
tropical cyclones. Heat is the primary driver for the formation and
strengthening of these storms and with average global temperatures
increasing at the rate of at least .2 degrees Celsius per decade,
that driver continues to strengthen. At the very least, researchers
agree that the strongest storms will likely be stronger. But tropical
cyclone formation is complex and other factors, such as large areas
of dust stirred up from expanding deserts, may also act to suppress
storms in a warming world, at least in some basins.
One
factor that has not been explored in depth is what appears to be a
steadily growing length of hurricane seasons. In almost all basins,
storms appear to be forming earlier and earlier in the year.
Climatological peaks for typhoon seasons are still occurring at the
usual time. But the warming oceans appear to be setting the stage for
year-round tropical cyclone formation. A tropical cyclone typically
needs water temperatures of at least 75 degrees (Fahrenheit) to form.
And with pools of water at this temperature and above expanding even
during what is typically winter it would seem that the basic
ingredients for year-round storm formation are steadily being
provided.
Links:
No comments:
Post a Comment
Note: only a member of this blog may post a comment.