

My suggestion is to try sharing this article with some of the idiot meteorologists in this country or elsewhere, that link extreme weather conditions with el-Nino or la-Nina.
They're either willfully ignorant or lying.
Good
luck!
Rapid Polar Warming Kicks ENSO Out of Climate Driver’s Seat, Sets off Big 2014-2016 Global Temperature Spike
“What
is happening right now is we are catapulting ourselves out of the
Holocene, which is the geological epoch that human civilisation has
been able to develop in, because of the relatively stable climate. It
allowed us to invent agriculture, rather than living as nomads. It
allowed a big population growth, it allowed the foundation of cities,
all of which required a stable climate.”
A
strong El Nino in 2015 helped to contribute to record hot global
temperatures over the past three years. But with so much heat
unexpectedly showing up in the global climate system, there’s
clearly something else going on. And indicators are that the natural
climate variability that human beings have grown accustomed to over
the last 10,000 years may now be a thing of the past — as it is
steadily overwhelmed by a stronger overall greenhouse gas based
warming signature. One that is concentrating more and more warming
near the poles.
****
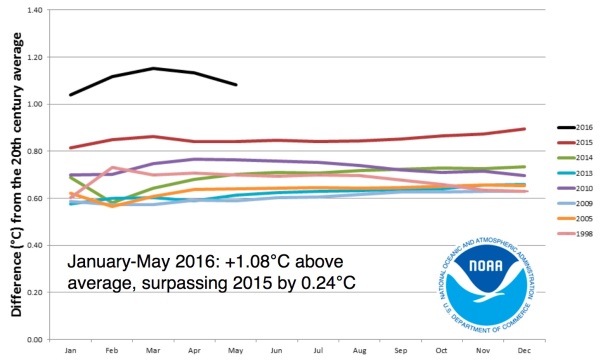
2014
was the hottest year on record. But that lasted only until the end of
2015 — which shattered the 2014 global heat record by a big margin.
Then 2016 rolled around and produced what could best be described as
an insane heat spike during the January through May period. Now, it’s
about 95 percent certain that the 2015 record will also fall, leaving
2016 as the new hottest year on record in yet one more climate
vertigo inducing temperature jump.
(The
rate of warming for 2014 through 2015 is just off the charts. This
scares scientists, and it should. This makes many climate experts
wonder about causes, and it should. Pime suspect for the increased
rate of change — amplifying feedbacks in the Arctic. Image
source:NOAA
Global Analysis and Weather
Underground.)
In
the end, temperatures are expected to level off near 1 C above 20th
Century averages and around 1.2 C above 1880s averages by the end of
this year. That’s a 0.3 C leap up since the mid 2000s. A screaming
rate of decadal warming that is about twice as fast as that
experienced since 1979. That’s an insanely fast pace of heat
build-up. And it’s got many scientists seriously concerned. The
records, as
the Guardian aptly notes,
were not just broken, they were obliterated. Adam Scaife, a scientist
at the Met Office in the UK, agrees:
“The numbers are completely unprecedented. They really stick out like a sore thumb… Including this year so far, 16 of the 17 warmest years on record have been since 2000 – it’s a shocking statistic.”
So
what the heck is going on? We know that a strong El Nino just passed.
But, though a real beast of a thing, the 2015-2016 event wasn’t
quite as powerful as the 1997-1998 El Nino. And global temperatures
will end up being about 50 percent hotter than 1998 averages by the
end of this year. Essentially leaving this great El Nino’s heat
spike in the dust. Meanwhile,scientists
attribute about 1/5th of the 2014 to 2016 heat spike to El Nino.
The rest came from someplace else. But where?
The
first obvious suspect is greenhouse gasses. In 1998, atmospheric CO2
levels peaked at around 365 parts per million at the Mauna Loa
Observatory. This year, that heat trapping gas hit near 408 parts per
million in the same measure. That’s a 43 parts per million jump
peak to peak in just 18 years. A 12 percent increase in a gas that is
capable of causing severe geo-physical changes in what, geologically
speaking, is not even a blink of an eye. And you have to go back
millions of years into Earth’s history to find times when CO2
readings were so high.
So
the big build-up of heat trapping gasses is the obvious driver of the
overall insane rate of warming that we are now seeing. But that
doesn’t account for what is an unexpected acceleration over the
past three years. And to puzzle out that speed-up we need to dig a
little deeper. To consider factors that are known as amplifying
feedbacks.
And,
thankfully, in this investigation, we are not flying completely
blind. NASA and the other global climate monitors give us a rough
global overview of where the Earth is warming up the fastest. And an
investigation of comparable temperature anomalies at the Earth’s
surface can give us some indication where the extra heat is coming
from and why.
1997
— Some Polar Amplification (aka Death of Winter), But Mostly
Equatorial Warming
The
obvious choice is to pick two relevant years for comparison. And for
our purposes we’ll pick 2015 and 1997. The reason for this pick is
that both 1997 and 2015 were years in which strong El Ninos were
building up and having their impact on the global climate system. And
based on what we know about El Nino, we can expect a lot of heat
coming out of the Equatorial Pacific as sea surface temperatures
there ramp up. In a climate system that is only driven by a natural
variability related El Nino, what you’d expect is that the primary
heat spike would be in the Eastern Equatorial Pacific region. Any
other heat spike would be a possible indicator of another climate
driver for global temperatures.

(1997
may have been the last year in which a big El Nino still maintained a
tenuous grip as the primary driver for the global climate system.
Image source: NASA.)
So
for the year of 1997 (Jan-Dec) we find that a strong heat pulse does
originate from the Eastern Equatorial Pacific region. In fact, it’s
the largest zone containing temperature anomalies in the range of 2
to 4 C above average. But during this year we also find some pretty
big anomalies in Central and North Asia. These flow across the Bering
Sea into Alaska, Northwest Canada, and the Beaufort. High Arctic
temperatures are somewhat cooler, though still anomalously warm. And
West Antartica also shows its own, not insignificant temperature
spike.
Given
the fact that El Nino will tend to strengthen the Jet Stream and
generate a warming bias in the tropical zones, we can already see
that there’s probably some polar amplification going on in 1997.
And overall, the northern polar zone from 66 North to 90 North
shows a
positive anomaly signature that is just 0.1 C shy of the equatorial
anomaly produced by El Nino.
But the heat signal between El Nino and Northern Hemisphere polar
amplification appears to be more balanced, with El Nino still
providing a slightly stronger share of the overall heat contribution.
Understanding
Polar Amplification’s Impact Due to Global Warming
For
reference — polar amplification is an expected more rapid increase
in polar temperatures as global greenhouse gas concentrations
increase. Under pressure from greenhouse gasses, the poles warm
faster for a number of reasons. The first is due to albedo or
reflectivity loss as ice melts. White ice changing to brown earth or
blue ocean due to melt absorbs more sunlight and creates a
preferential warming at the poles. In addition, greenhouse gasses
(especially CO2) capture and re-radiate sunlight’s heat energy like
a blanket. As a result, temperatures tend to homogenize more over the
globe resulting in a greater rate of temperature increase where it’s
coolest and darkest. And the poles are the coolest and darkest places
on Earth.
A
third cause of polar amplification involves added heat resulting in
natural carbon store release. And some of the greatest concentrations
of the world’s sequestered carbon stores are locked in frozen
ground and water at or near the poles. If ice at the poles thaws, you
tend to end up with a higher overburden of greenhouse gasses in these
regions. This is particularly true in the Northern Hemisphere where
large regions of permafrost and ocean carbon stores are more
vulnerable to release from early warming than the deeply sequestered
stores in Antarctica.
(Dr.
Jennifer Francis’s observations on Jet Stream weakening and polar
amplification have big implications both down [Pole] and up [Equator]
stream.)
Finally,
as the polar zones warm up, they tend to generate weaknesses in the
circumpolar Jet Stream. This is due to the fact that temperature
differences between pole and tropics drive both Jet Stream speed and
strength. As the relative difference drops off, the Jet Stream slows.
And when the Jet Stream slows it meanders — creating
big troughs and ridges centering on the middle Latitudes but
sometimes extending all the way up to the poles.
In the ridge zones, warm air is able to drive further north or south.
And this feeds polar amplification by linking hot Equatorial air
masses with the Pole itself. Over recent years, high amplitude Jet
Stream waves have become a regular feature of the global climate
system and have been associated with numerous extreme weather events
— some of the most notable being the Russian Heatwave and Pakistan
floods of 2011 and the anomalous late December 2015 warming of the
North Pole above freezing.
2015
— Polar Amplification in the Driver’s Seat
By
2015, the polar amplification signature, especially in the Northern
Hemisphere, started to look ridiculously strong.

(2015’s
picture of Polar Amplification during an El Nino year should disturb
anyone who knows anything about how global climate systems should
work. Image source: NASA.)
And
during this year we find that the zone of greatest temperature
anomalies lies not over the Equatorial Pacific — but over the high
Latitude regions of the Northern Hemisphere. 2-4 C above average
temperatures dominate a huge zone stretching from North Central Asia
and Europe and on up to the North Pole. A similar zone dominates
Northwestern Canada, Alaska and the Beaufort Sea. And pretty much the
entire Northern Hemisphere Polar and near Polar zone falls under 1-4
C above average temperatures for the year.
By
comparison, the Eastern Equatorial Pacific appears to play second
fiddle to the Polar and near Polar heat build up. A broad region
across the Central and Eastern Equatorial Pacific does see 1-2 C
above average temperatures, with a small pool of 2-4 C deltas off
South America. But it’s not that much greater a signal than a
significant heat pool over the Indian Ocean. And the Northern
Hemisphere near Polar zone is altogether the area that’s clearly
the global heat center of gravity. An observation bearing out in
NASA’s zonal anomaly measure which finds that Latitudes 66 to
90 North were about 1.6 C above average and the highest relative
temperature anomaly zone on the planet. Meanwhile, the Equator lags
at +1.2 C above normal. That’s a relative Equator to Pole anomaly
change of +0.5 C from El Nino years 1997 to 2015. An indicator that
El Nino may no longer be the primary driver of the global temperature
and climate engine. And that its overall role is greatly diminished
over the 1997 to 2015 timeframe. And, finally, that a greenhouse gas
based warming polar amplification signature is now in the driver’s
seat.
So,
basically what we have during an El Nino year is the pole warming
relative to the Equator and under any condition other than human
forced climate change — this is something that definitely should
not happen. In other words, you’re not in Kansas anymore and Kansas
isn’t on Earth anymore. At least the Earth that human civilization
is used to. For what we’re experiencing is the climate of a planet
that is definitely not operating under Holocene norms — but under
the transitionally destabilizing forces of greenhouse gas based
warming.
Warm
Air Slots and The Death of Winter
So
in comparison to 1997, it appears that during 2015 the Northern Pole
gained heat very rapidly (increasing by +1 C over these 18 years)
while Equatorial heat continued to build (adding +0.4 C over the same
period). In other words, Polar warming was about 2.5 times faster
than Equatorial warming during the 18 year interval. The result is
that by the El Nino year of 2015, the Pole showed dramatically higher
relative global temperature anomaly spikes. This, in a few simple
words, is the evidence of a greenhouse gas warming based polar
amplification writ large. But digging down into the details a bit
more we find a number of further disturbing clues as to what’s
really going on in the grinding gears of our global climate
machinery.

(September
of 2015’s crushed polar vortex and high amplitude Jet Stream wave
patterns during a peak period of Equatorial heat known as El Nino is
a bad, bad sign. A clear indication that polar amplification is
starting the drive and destabilize the global climate regime.
September 10 of 2015’s Northern Hemisphere Polar reference Jet
Stream capture is by Earth
Nullschool.)
The
first is the appearance of a big warm air slot running directly from
the Equatorial Pacific over the Eastern Pacific and North America and
on up into the Northern Polar zone. Here we find the signature of
2015’s ridiculously resilient ridge (RRR) pattern in the NASA
global anomaly map for the year. Warm air consistently funneled
directly from the Equator, was drawn through the high amplitude ridge
(see Dr Francis’s video above) and pulled into the polar zone.
But
the RRR zone wasn’t the only big warm air slot pulling air north
during 2015 — just, perhaps, the most obvious. A second big warm
air slot appeared over the Eastern North Atlantic, Western Europe and
extended to cover most of Asia. And this enormous Equatorial air
sucking beast really ramped into high gear during late December of
2015 when it drove North Pole temperatures above freezing.

(Upper
level Equatorial zonal winds all peaked at the same time during
September of 2015. A sign that Equatorial heat went north in a manner
that produces some potentially bad implications for Northern
Hemisphere Winter under a regime of human-forced climate change.
Image source: Anthony
Masiello.)
Taken
in total, these warm air slots were enormous — exerting an amazing
influence over the totality of global weather. The overall story is
one in which the polar vortex was basically getting smashed during an
El Nino year. Another big indication that things are teetering pretty
far off kilter. One indicator of this was an anomalous spiking of all
the upper level Equatorial wind speeds at the same time (in the Quasi
Biennial Oscillation measure)
during September of 2015. An event that current climate theory says
shouldn’t happen, but it did. And yet one more hint that the Hadley
Cell produced a huge northward bulge at the time. It’s also an
indicator that Northern Hemisphere Winter is getting steadily beaten
back to the ropes by the bully of northward running heat.
So
what we’ve seen from 1997 to 2015 is a dramatic transition in which
El Nino appears to have lost climate influence powers and become a
slave to what is now a heat-sucking engine at the pole. It’s an
emerging first phase of a death of winter type scenario. And the
upshot is that the extra heat in the system that scientists are
getting pretty concerned about appears now to be coming in large part
from a ramping Northern Hemisphere polar amplification.
Links:
Scientific
hat tip to Dr. Jeff Masters and his best-in-class Weather Underground
Scientific
hat tip to the prescient Dr. Jennifer Francis
Scientific
hat tip to Dr. Stefan Rahmstorf
Scientific
hat tip to Adam Scaife
Hat
tip to Greg
Hat
tip to Colorado Bob
Hat
tip to Cate
Hat
tip to DT Lange
No comments:
Post a Comment
Note: only a member of this blog may post a comment.