

Just
imagine the effects of a sudden shutdown of all economic activity!
Could
cuts in sulfur from coal and ships help explain the 2015 spurt in
Northern Hemisphere temperatures?
20
May, 2016
- Daniel S. Cohan, Nir Y. Krakauer, James J. Corbett, Daran Rife, Rui Zhang, Anna Ruth Halberstadt and Leah Y. Parks
By
Daniel S. Cohan, Associate Professor, Rice University
Nir Y. Krakauer, Associate Professor, City College of New York
James J. Corbett, Professor, University of Delaware
Daran Rife, Global Head of Mesoscale Modeling, DNV GL – Renewables Advisory
Rui Zhang, Postdoctoral Researcher, Rice University
Anna Ruth Halberstadt, Graduate Student, Rice University
Leah Y. Parks, Associate Editor, Electricity Policy
Reductions
in cooling sulfate aerosols may have contributed to recent warmth.
The
year 2015 was the warmest in recorded history, and featured an
intense El Niño event in the second half of the year. Since global
temperatures have been increasing alongside greenhouse gas (GHG)
concentrations and also correlate with the El Niño Southern
Oscillation (ENSO), both the U.S. National Centers for Environmental
Information and the Australian Bureau of Meteorology indicate that El
Niño was a major contributor to the 2015 record warmth
(NOAA 2016; BoM
2016).
We
offer a hypothesis for an additional contributor to the record global
warmth in 2015: a reduction in sulfur emissions from the combustion
of coal and of petroleum-derived ship fuel. Sulfur emissions have
been cut in order to reduce the health impacts of the sulfur dioxide
(SO2) pollutant and of the particulate matter (sulfate aerosols) that
subsequently forms in the atmosphere. However, sulfate aerosols also
provide a cooling veil by scattering sunlight, brightening clouds,
and extending cloud size and lifetime (IPCC 2013). Reducing sulfate
aerosols could curtail this atmospheric cooling effect (Fiore et al.
2015), and thus contribute to the observed record-breaking 2015
temperatures.
This
paper reviews the temperature anomalies of 2015, and presents
evidence both consistent with and contradictory to a contributing
role of sulfur cuts in recent warming. We suggest the hypothesis
presented merits scientific attention in climate models and
observations.
Temperature anomalies in 2015
Close
examination of the spatial and temporal distribution of record warmth
in 2015 reveals key features that do not fit a narrative of causation
by El Niño. Specifically:
- ENSO indices started 2015 at positive levels (i.e., closer to El Niño than La Niña conditions) but below thresholds that typically signify a meaningful El Niño event. The indices rose sharply in mid-2015, and by late 2015 ranked among the three strongest El Niños since 1950 (Climate.gov 2016).
- Global temperature anomalies rose sharply in early 2015, before El Niño was fully established. On a quarterly basis, they rose 0.09K from September-November 2014 to December 2014-February 2015. February and March 2015 were the largest temperature anomalies on record, later surpassed by each month September 2015-March 2016 (NOAA 2016).
- Satellites observed record warm sea surface temperatures (SST) off the coasts of North America and Europe throughout 2015 (Figure 1).
These observations from 2015 appear inconsistent with causation exclusively by El Niño. How could an El Niño that began in Q2 2015 and intensified in Q3 and Q4 of 2015 have caused an intense spurt in temperatures that began in the first quarter (Q1) of 2015? Furthermore, El Niño SST anomalies manifest most strongly in the tropical Pacific Ocean, with eastern waters warmer than usual and western waters cooler. Previous El Niño events have not been accompanied by warm SST anomalies in the extratropical waters off the coasts of North America and Europe. The 2015 temperature spurt that occurred almost exclusively in the Northern Hemisphere is also curious, since El Niño is centered over the Equator. However, the El Niño event in 1997-98 also featured more warming in the Northern than Southern Hemisphere.

Figure
1. 2015 SST anomalies for Q1 and Q2 compared to the 1981-2010
average. Image Credit: Huang et al. 2014; Liu et al. 2014
Sulfur’s Influence on Climate
Anthropogenic
sulfur emissions arise primarily from the burning of coal and fuel
oil, and most emissions occur in industrialized regions of the
Northern Hemisphere and from ships (Smith et al., 2011). The SO2 is
oxidized in the atmosphere, or removed by wet or dry deposition if it
comes into contact with a surface or precipitation (Figure 2). The
main climate impact of SO2 comes when it is oxidized to form sulfate
aerosols (Eatough et al. 1994).
Sulfate
aerosols in the atmosphere influence climate in two ways: directly,
by scattering solar radiation, and indirectly, by brightening clouds
or extending their lifetime or size (Lelieveld and Heintzenberg 1992;
Chuang et al. 1997). Both of these effects cause negative radiative
forcing (IPCC 2013). Given the lifetime of sulfur in the troposphere
(days to weeks), the cooling likely extends hundreds of kilometers
from the emissions sources (Fiore et al. 2015).

To
assess whether sulfur cuts contributed to temperature anomalies in
2015, we assess three lines of evidence (Figure 2):
- Evidence of sulfur emission reductions, specifically from coal in China and ship fuel in emission control areas (ECAs);
- Atmospheric observations of SO2 and aerosols; and
- Temperature trends where sulfur emissions were reduced.
Our analyses show strong evidence of point 1, but conflicting evidence for points 2 and 3. We begin by presenting evidence that emissions from coal and ship fuel oil declined in 2015 in distinct regions of the Northern Hemisphere.

Figure 2. Hypothesis for how reductions in SO2 emissions from ships and coal could lead to warmer temperatures. Numbering in the schematic aligns with the table above. Image Credit: Anna Ruth Halberstadt
Coal Sulfur in China and Elsewhere
Dramatic
reductions underway in China coal use have been recognized only
recently. China consumes as much coal as the rest of the world
combined (EIA 2014; Buckley & Sanzillo 2015), and coal
consumption grew at an annual rate of 7.8 percent between 2000 and
2012 (Hao et al. 2015). Most forecasts by the Intergovernmental Panel
on Climate Change projected growth in coal in China and worldwide
(IPCC 2014). However, the Chinese government in December 2015
announced that it was banning new coal mines for three years to
alleviate growing stockpiles of coal. A January 2016 announcement
from the National Energy Administration (NEA) outlined plans to
shutter 4,300 existing small and inefficient coal mines and cut
outdated production capacity of 700 million tonnes in the coming
three years (Xinhua Net 2016). Together, these developments strongly
indicate that Chinese coal combustion is in ongoing decline. China’s
National Bureau of Statistics confirmed in February 2016 that China’s
coal use has fallen for a second year in a row, dropping roughly 3.7
percent in 2015
Sulfur
emissions associated with China’s coal combustion have fallen
faster than the declining coal usage. The national average sulfur
content of coal used by the power sector in China was 1.01
percent in 2005, ranging between 0.25 and 3.24percent for different
source regions (Wang and Li 2001; Zhao et al. 2008; You and Xu 2010).
China has explicitly targeted sulfur emission reductions to mitigate
unhealthy levels of particulates in eastern cities. A Chinese
government plan issued in September 2013 aims to increase coal
washing rates to 70percent by 2017 and to accelerate construction of
scrubbers for flue gas desulfurization (Chinese Environmental
Protection Ministry 2013).
In
addition to China, declines in coal consumption have also been
reported in the United States, Japan, the European Union, South
Korea, and South Africa (Buckley & Sanzillo 2015). In the United
States, for example, power plant consumption of coal fell 12percent
in 2015 (EIA 2016). Only two of the major coal-consuming countries,
India and Australia, showed growth in 2015 (Buckley and Sanzillo
2015). Although the International Energy Agency expects India to lead
global growth in coal demand (IEA 2015), growing stockpiles and
lagging demand for coal (Cohan 2016) have led to moves to scale back
coal mining and imports in India (Kanungo 2016; Das 2016).
Ship
combustion of fuel oil is estimated to emit 13percent to 15percent of
global SO2 from anthropogenic sources (Klimont et al 2013, Smith et
al 2014), ranking behind the power sector and industrial coal
combustion but producing eight times more SO2 than other transport
sources. Ships burn residual fuel oil, which contains orders of
magnitude more sulfur than highway diesel and gasoline, and they
typically do not control their SO2 emissions. Emission Control Areas
(ECAs) for shipping were established by the 1997 MARPOL Protocol that
originally took effect in May 2005. ECAs extend 200 nautical miles
from the U.S., Canada, and portions of Europe. Ship fuel sulfur
limits within ECAs were tightened to 1.0percent in July 2010, and to
0.1percent in January 2015. Elsewhere, the International Maritime
Organization (IMO) began limiting ship fuel to 3.5percent sulfur in
January 2012, and plans to set a 0.5percent limit in 2020 or 2025
(IMO 2008).
Despite
their limited geographical extent, ECAs substantially influence
shipping SO2 emissions overall since ships spend much of their
time in and near ports, and approximately 70percent of their
operating time within 200 nautical miles of land (Corbett and
Fischbeck, 1997). Assuming full compliance, the ECA regulations would
imply a 90percent reduction in ship SO2 emissions in those areas
beginning January 2015. Because fuel with a higher sulfur content is
cheaper, it is likely that ships would resume their use of
high-sulfur fuel oil upon leaving the ECAs. The North American ECAs
are expected to have reduced SO2 emissions by 834,000 tonnes per
year (Marine Environment Protection Committee, 2009), and the
European ECA by 150,000 tonnes per year (Kalli et al. 2013).
Together, that would represent about a 9percent reduction in shipping
SO2 emissions in the Northern Hemisphere. In terms of radiative
forcing, Lauer et al (2009) estimate that a 0.1percent sulfur cap on
ship fuel within 200 nautical miles of coasts (akin to the 2015 ECAs,
but also applied to other coasts) would increase radiative forcing
globally by 0.12 W/m2 (Watts per square meter), largely via
interactions of the sulfate with marine clouds. While this radiative
forcing is smaller than needed to explain the rise in Northern
Hemisphere temperatures in 2015, it could have played a contributing
role regionally.
The
ECAs complement a growing array of strict regulations of ship sulfur.
For example, China implemented a 0.5percent fuel sulfur capeffective
July 2015 in Hong Kong and January 2016 in the Pearl River Delta,
Yangtze Delta, and Bohai Bay rim. European
ParliamentDirective 2005/33/EC
limited ship fuel sulfur in inland waterways and ports to 0.1
percent, effective January 2010. The Port of Long Beach, California,
offered a Green Ship Incentive Program for ships that met 2016
emission standards early.
Satellite Observations of SO2
Though
in situ measurements of SO2 are not readily available over the oceans
or beyond urban regions of China, NASA provides daily and monthly
averaged measurements of SO2 from the polar-orbiting Ozone Monitoring
Instrument (OMI) that
can be used to evaluate point 2a of our hypothesis. A recent study
used OMI to identify trends in SO2 over the last decade (Krotkov et
al 2015; Figure 3). Though China tops the world in SO2 emissions, OMI
observed a 50percent drop in SO2 concentrations over China from 2011
to 2014 (Krotkov et al. 2015). OMI also observed large reductions in
SO2 columns over the U.S. and Eastern Europe from 2005 to 2014.
Meanwhile, OMI observed SO2 increases over India over what time
frame.
Our
examination of OMI satellite Level 3 monthly data for 2015 shows an
acceleration of the downward trend in SO2 over China. However, SO2
from ships is too diffuse for the trends to be observed by OMI
(Iolanda Ialongo, Finnish Meteorological Institute, and Nickolay
Krotkov, NASA, personal communication).
Aerosol
Anomalies and Diurnal Temperature Range in 2015

Figure 3: SO2 over China observed by OMI satellite, averaged over 2005-2007 (top) and 2011-2014 (bottom). Image Credit: NASA
To
evaluate whether aerosols responded to the emissions changes (Point
2b of our hypothesis), we consider weekly values of over-ocean
aerosol optical thickness (AOT), available on a 1-degree grid from
the National Oceanic and Atmospheric Administration’s Advanced Very
High Resolution Radiometer (AVHRR) aboard polarorbiting satellites
(Tragou and Lascaratos 2003). The mean AOT from this AERO100 dataset
was stable globally from 2010-2015.
Here,
we analyze AERO100 data over regions most likely to be affected by
the sulfur cuts from China coal and the shipping ECAs (Figure 4). For
China, we define a region over the China Sea bounded by the Korean
Peninsula, Japan, the Philippines, and Vietnam (Figure 4). Over this
region, AOT was 6percent lower in 2015 than the 2008-2014 average
(Table 1). The AOT drop in 2015 was greatest near the China coast,
consistent a reduction of SO2 from inland sources. Over the North
American and European ECAs, AERO100 data show AOT declined 2.7 to
8.0percent in 2015 relative to the prior seven-year average (Table
1). The exception is the Hawaiian ECA, which showed a slight increase
in AOT in 2015.
We
had hypothesized that the lower AOT would increase sunlight reaching
the regions, leading to daytime warming and a wider gap between
maximum and minimum daily temperatures (Figure 2, point 3b). However,
1-degree gridded temperatures from the Berkeley Earth Surface
Temperature project (BEST)
based on land weather stations, do not show a statistically
significant change in the daily temperature range over China or near
the ECAs.
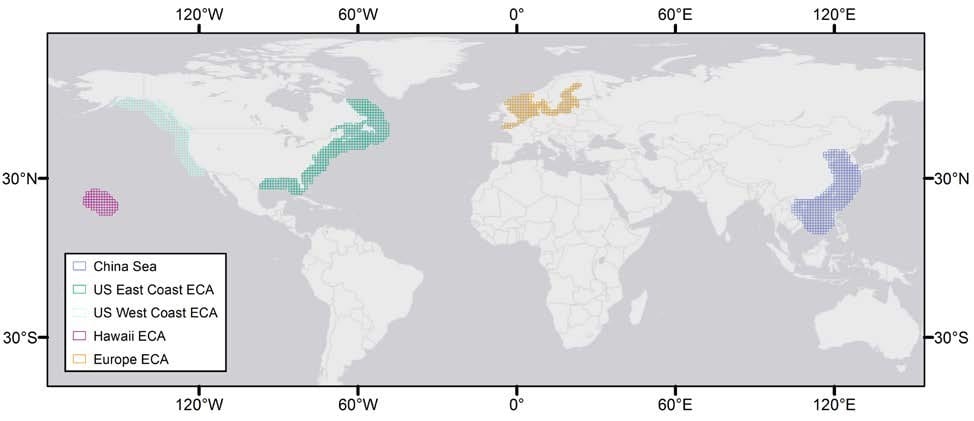
Figure
4. Regions over which aerosol optical thickness was assessed. Image
Credit: Basemap: ESRI, DeLorme, HERE, MapMyIndia
Conclusions and Implications
The
analysis and discussion above provide mixed evidence about whether
reduced sulfur emissions contributed to 2015 Northern Hemisphere
warming. The temperature anomaly distribution (Figure 1) suggests
that El Niño alone cannot explain several of the key features of
2015 Northern Hemisphere warming. Regulatory changes and economic
statistics are consistent with declines in sulfur emissions from coal
in China and the U.S. and from ships in the ECAs (Figure 2, point 1).
OMI observations confirm SO2 reductions over China (Figure 3,
point 2a), but cannot detect changes over the ECAs, while another
satellite confirms reductions in aerosols over the ECAs (Table 1;
point 2b). Warm SST anomalies are observed over the ECAs (Figure 1;
point 3a), but air temperature data do not show an increased gap
between maximum and minimum temperatures (point 3b).
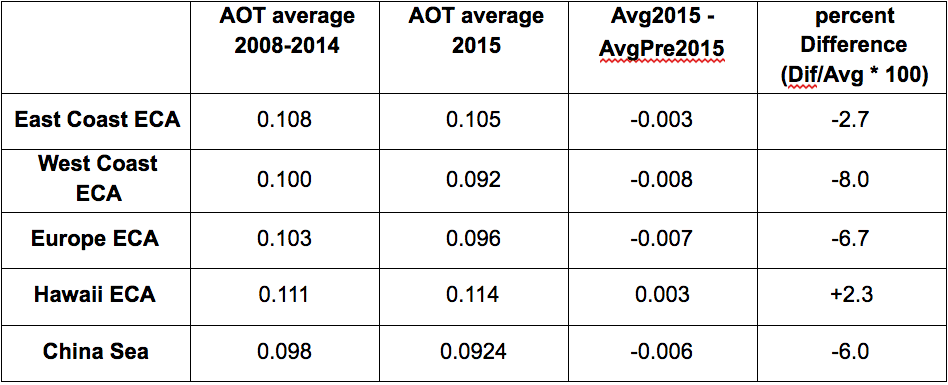
Table
1. Aerosol optical thickness over the ECA regions of North America
and Europe, in 2015 and averaged over the prior 7 years in AERO100
data.
IPCC
forecasts predict that SO2 and sulfate aerosols will decline sharply
in the coming decades; accelerating those reductions is a boon to
public health. However, CO2 and other long-lived gases accumulate in
the atmosphere, whereas sulfur is short-lived. Thus, reducing CO2 and
other greenhouse gases must remain a primary target of climate change
mitigation, even if sulfur reduction drives short-term regional
warming.
The
possibility that a cut in ship sulfur emissions could dramatically
impact temperatures in ECAs raises important policy questions. In
particular, is it wise for the IMO to follow through with plans to
cut ship fuel sulfur globally in 2020 and 2025? This question was
recently raised in the context of Arctic shipping by Lindstad et al
(2016). Creating new ECAs near coasts, especially near the heavily
populated coastal mega-cities of Asia and beyond, would reduce
population exposure to harmful particulate matter. However, sulfur
released over the open oceans is more likely to enter clouds than
human lungs. In remote marine areas where baseline particulate matter
and cloud condensation are typically low, sulfate aerosols derived
from ship sulfur emissions may be especially impactful on clouds
(Lauer et al. 2009). After decades of ships emitting cooling sulfur
over the open oceans, imposition of a global cut in fuel sulfur
content could bring a sudden change to the little noticed climate
“geoengineering” that ships provide in remote marine areas.
Observations and modeling studies should be deployed to better
quantify the climate, health, and ecosystem impacts of ship emissions
in the open ocean and to help guide the timing and sequence of
regulations to reduce shipping fossil fuel use and pollution as part
of the global transition away from reliance on fossil fuels.
Ultimately,
our speculations and hypotheses raise as many questions as answers.
It is our hope that future work by our team and other scientists will
better elucidate the roles of sulfur and other factors in driving
recent atmospheric and ocean warming, and its impact on the weather
and climate variability.
Acknowledgments:
This
manuscript benefitted from a review by Tracy Volz of Rice University,
discussions with Nickolay Krotkov (NASA) and Iolanda Ialongo (Finnish
Meteorological Institute), and the comments of two anonymous
reviewers. Funding for D. Cohan, R. Zhang, and A.R. Halberstadt was
provided by NASA Air Quality Applied Sciences Team.
Daniel
Cohan is associate
professor of
environmental engineering at Rice University, a member of the NASA
Air Quality Applied Sciences Team, and a contributing author for The
Hill, The Conversation, and The Houston Chronicle.
Rui
Zhang is a
postdoctoral researcher.
Anna
Ruth Halberstadt received
her M.S. in Earth Sciences at Rice University.
References
Australian
Bureau of Meteorology (2016). Annual Climate Statement
2015. http://www.bom.gov.au/climate/current/annual/aus/.
Buckley
and T. Sanzillo. (Nov 2015). Past Peak Coal In China, Institute for
Energy Economics and Financial Analysis Report,
Available:http://ieefa.org/wpcontent/uploads/2015/11/IEEFA_Peak-Coal_November-2015.pdf
Chinese
Environmental Protection Ministry (2013). The State Council issues
action plan on prevention and control of air pollution introducing
ten measures to improve air quality.
Available: http://english.mep.gov.cn/News_service/infocus/201309/t20130924_260707.htm-minister-says/
C.C.
Chuang et al., “An assessment of the radiative effects of
anthropogenic sulfate,” J. Geophys. Res. Atmos., vol. 102, pp.
3761-3778, 1997.
D.S.
Cohan (Feb 17, 2016), “Plummeting coal use and peaking stockpiles”
The Hill.
Available: http://thehill.com/blogs/pundits-blog/energy-environment/269684-plummeting-coal-use-andpeaking-stockpiles
D.S.
Cohan and L.Y. Parks (Feb 26, 2016), “Achieving Clean Power Plan
targets well ahead of schedule,” The Hill.
Available:http://thehill.com/blogs/pundits-blog/energy-environment/270544achieving-clean-power-plan-targets-well-ahead-of
Corbett,
J. J. and P. Fischbeck (1997). “Emissions from ships.” Science
278(5339): 823-824.
A.K.
Das (Feb 2016), “Coal of India may scale back production to deal
with 40Mt stockpile,” Mining Weekly.
Available:http://www.miningweekly.com/article/coal-of-india-may-scale-backproduction-to-deal-with-40mt-stockpile-2016-02-22
D.J.
Eatough et al., “The conversion of SO2 to sulfate in the
atmosphere,” Isr. J. Chem., vol 34, no. pp. 301-314, 1994.
Energy
Information Administration (EIA), (2014). Today in Energy.
Available: http://www.eia.gov/todayinenergy/detail.cfm?id=16271
Energy
Information Administration (EIA), (2016). Short Term Energy Outlook,
Coal. Available:https://www.eia.gov/forecasts/steo/report/coal.cfm
A.M.
Fiore et al., “Air Quality and Climate Connections,” J Air Waste
Mgmt Assoc, vol. 65, pp. 645-685, doi:10.1080/10962247.2015.1040526,
2015.
Hao
et al, “China’s farewell to coal: A forecast of coal consumption
through 2020,” Energy Policy, vol. 86, pp. 444-455, 2015.
Huang
et al., “Extended Reconstructed Sea Surface Temperature version 4
(ERSST.v4): Part I. Upgrades and intercomparisons,” J. Climate,
vol. 28, pp. 911–930, 2014.
International
Energy Agency (IEA) (2015). Coal medium-term market report: market
trends and projections to 2020.
Available:http://www.iea.org/bookshop/712-MediumTerm_Coal_Market_Report_2015
Intergovernmental
Panel on Climate Change (IPCC), Climate Change 2013: The Physical
Science
Basis. Contribution of Working Group I to the Fifth Assessment Report
of the Intergovernmental Panel on Climate Change, Cambridge
University Press, Cambridge, United Kingdom and New York, NY, USA,
2013.
Intergovernmental
Panel on Climate Change (IPCC), Climate Change 2014: Mitigation of
Climate Change. Contribution of Working Group III to the Fifth
Assessment Report of the Intergovernmental Panel on Climate Change,
Cambridge University Press, Cambridge, United Kingdom and New York,
NY, USA, 2014.
International
Maritime Organization (2008). Revised MARPOL Annex VI: Amendments to
the
Annex
of the Protocol of 1997 to Amend the International Convention for the
Prevention of Pollution From Ships, 1973, as Modified by the Protocol
of 1978 Relating Thereto. International Maritime Organization.
London, UK, International Maritime Organization. MARPOL Annex VI:
Kalli,
J.-P. Jalkanen, L. Johansson, and S. Repka. “Atmospheric emissions
of European SECA shipping: long-term projections,” WMU Journal of
Maritime Affairs, vol. 12(2), pp. 129145, 2013.
Kanungo
(Jan 29, 2016), “Coal India likely to scale back production as
stock piles: Piyush Goyal,” Live Mint.
Available:http://www.livemint.com/Industry/e5apwEUsVytgLGq0EbAsRP/Coal-India-likely-to-scale-backproduction-as-stock-piles-P.html
Klimont
et al. (2013). The last decade of global anthropogenic sulfur
dioxide: 2000-2011 emissions.
Available:http://iopscience.iop.org/17489326/8/1/014003/media/erl441620suppdata.pdf
A.
Krotkov et al., “Aura OMI observations of regional SO2 and NO2
pollution changes from
2005
to 2014,” Atmos. Chem. Phys. Discuss., vol. 15, pp. 26555-26607,
doi:10.5194/acpd-1526555-2015, 2015.
Lauer,
V. Eyring, J.J. Corbett, C. Wang, and J.J. Winebrake. “Assessment
of Near-Future Policy Instruments for Oceangoing Shipping: Impact on
Atmospheric Aerosol Burdens and the
Earth’s
Radiation Budget,” Environmental Science and Technology, vol. 43,
pp. 5592-5598, 2009.
Leber
(Feb 29, 2016). “Coal use is down in the U.S. and China — and
it’s not a blip”,
Grist. Available: http://grist.org/news/coal-use-is-down-in-the-u-s-and-china-and-its-not-a-blip/
Lelieveld
and J. Heintzenberg, “Sulfate cooling effect on climate through
in-cloud oxidation of anthropogenic SO2,” Science, vol. 258, pp.
117-120, 1992.
Lindstad,
H., R. M. Bright and A. H. Strømman (2016). “Economic savings
linked to future Arctic shipping trade are at odds with climate
change mitigation.” Transport Policy 45: 24-30.
Liu
et al., “Extended Reconstructed Sea Surface Temperature version 4
(ERSST.v4): Part II. Parametric and structural uncertainty
estimations,” J. Climate, vol. 28, pp. 931–951, 2014.
Marine
Environment Protection Committee, “Proposal to Designate an
Emission Control Area for Nitrogen Oxides, Sulphur Oxides and
Particulate Matter,” MEPC 59/6/5, available
at https://www3.epa.gov/nonroad/marine/ci/mepc-59-eca-proposal.pdf, 2009.
National
Bureau of Statistics of China (NBS) (Feb 29, 2016), Statistical
Communiqué of the People’s Republic of China on the 2015 National
Economic and Social Development,
Available: http://www.stats.gov.cn/english/PressRelease/201602/t20160229_1324019.html
NOAA
National Centers for Environmental Information (2016). State of the
Climate: Global Analysis for Annual 2015, published online January
2016, retrieved on April 26, 2016
from http://www.ncdc.noaa.gov/sotc/global/201513.
Parkinson
(Jan 2016), “Solar Power Now Cheaper Than Coal In India, Says
Energy Minister,” CleanTechnica, Available
at,http://cleantechnica.com/2016/01/22/solar-power-nowcheaper-than-coal-in-india-says-energy-minister/
Shah
(Feb 2016), “Why India Has Become The Sunniest Land For Solar
Opportunities,” SeekingAlpha, Available
at,http://seekingalpha.com/article/3883056-india-become-sunniestland-solar-opportunities
Wang
and R. Li, R., 2011, “Typical kinds of coal in China and some
special coals with their fly ash difficult to precipitate by ESP”.
in 8th International conference on Electrostatic Precipitation,
Available: http://www.isesp.org/icesp%20viii%20papers/VIII-ICESP%20PC4-2.pdf
Rife,
et al. (Mar 2016) “A New Kind of Drought: U.S. Record Low Windiness
in 2015.” Submitted to Earthzine.
Robert
et al., “Berkeley earth temperature averaging process,” Geoinfor.
Geostat.: An Overview, vol. 1, pp. 1-13, 2013.
J.
Smith, J. van Aardenne, Z. Klimont, R. J. Andres, A. Volke, and S.
Delgado Arias, “Global and
regional anthropogenic sulfur dioxide emissions: 1850-2005”,
Atmos. Chem. Phys., 11, 1101-1116, doi:10.5194/acp-11-1101-2011,
2011.
Smith,
T. W. P., J. P. Jalkanen, B. A. Anderson, J. J. Corbett, J. Faber, S.
Hanayama, E.
O’Keeffe,
S. Parker, L. Johansson, L. Aldous, C. Raucci, M. Traut, S. Ettinger,
D. Nelissen, D.
Lee,
S. Ng, A. Agrawal, J. J. Winebrake, M. Hoen, S. Chesworth and A.
Pandey (2014). Third IMO GHG Study 2014. London, International
Maritime Organisation (IMO).
Tragou
and A. Lascaratos, “Role of aerosols on the Mediterranean solar
radiation,” J. Geophys. Res. Ocean, vol. 108, C2, 2003.
Xinhua
Net (Jan 21, 2016). “China to further cut coal capacity.”
Available: http://news.xinhuanet.com/english/2016-01/21/c_135031210.htm
F.
You and X. C. Xu, “Coal combustion and its pollution control in
China,” Energy, vol. 35, pp. 4467-4472, 2010.
Zhao
et al., “Primary air pollutant emissions of coal-fired power plants
in China: Current status and future prediction,” Atmos. Environ.,
vol. 42, pp. 8442-8452, 2008.
Excellent article. Of course, with hindsight, or should I say paleo-hindsight... We know that vulcanism, with its attendant SO2/heavy particulate emissions has played a significant role in changing global temperatures in past geological periods/eras. Not to much of a jump in understanding to see that anthropogenic emissions of SO2 would likely do likewise. Ironic to the point of absurdity.
ReplyDeleteWhat will the geo-engineering fraternity make of this? Seeding the clouds with coal dust? hahaha