

Permafrost
Fires Advancing Toward Arctic Ocean Shores

(Smoke from Siberian permafrost fires entrained in wind pattern blowing over the East Siberian and Laptev seas. What can best be described as a synoptic pattern of smoke stretching for more than 2000 miles. For reference, we are looking at the heart of Siberia, the bottom edge of frame touches the Arctic Ocean. Total width of frame is more than 2000 miles. Image source: LANCE-MODIS.)
1
August, 2014
From
the Northwest Territory of Canada to a broad central section of
Russian Siberia called Yedoma, the permafrost fires this year have
been vicious, powerful and colossal. They have burned deep into the
basement soil and permafrost layer, casting out billows of dense,
smokey material that, at times, has blanketed a majority of both
Siberia and the North American Continent.
In
Minnesota, hundreds of miles away from the still raging Northwest
Territory fires, James Cole, who comments here frequently, noted:
Forest
fire smoke here in N.E. Minnesota was off the charts yesterday! I
went out to watch the blazing red sun sink below the green hills.
This almost invisible red ball brought back an old memory from
watching a sun set in San Diego County during a very bad fire out
break back when I was home ported with my ship there. These Alberta
fires are a huge distance from here, but I can guess at their size by
the thick gray haze, the smell and a sunset just like one in an
active fire zone.
And
these fires aren’t anything normal. They burn the land as well as
the trees. They cast off an inordinately high volume of smoke, such
that they are far more visible in the satellite shot than more
southerly fires of similar size. And they continue to burn for weeks
and weeks — with lands that were lit nearly a month ago still
casting off smoke and fire from the same locations.
The
quantity of material necessary to keep such fires burning from the
same location day in, day out, must be immense and it is becoming
increasingly obvious to this observer that woodland as well as the
soil and, likely, the thawing permafrost itself have become involved.
It is a basement layer that, when fully thawed can be scores of feet
deep. A set of peat-like material that, were it to be sequestered,
would likely turn into a hundreds foot deep seam of coal over ages of
heat and pressure. Instead, it is now being liberated as fuel for
fires by human-caused warming.
 (Wildfire burning near Laptev Sea on August 1, 2014. The terrain in this region is tundra and tundra lakes, similar to the Yamal region where methane outburst sites where recently discovered. Wildfire is the comet like feature in upper center frame. The shoreline of the Laptev is visible along the lower frame border. Note the steely gray pallor of smoke running south to north [top to bottom] through the image frame. For reference, bottom edge of frame is about 150 miles, fire front is approximately three miles. Image source:LANCE-MODIS.)
On
the Canadian side, the fires have primarily remained in the same
region, simply continuing to burn from mostly the same sources or
spreading only to local areas. But on the Russian side, the fires
have leapt from their original cauldrons to ignite in massive blazes
along regions both east and west, north and south.
Over
recent days, fires have been creeping northward along a ridge line
toward the Laptev Sea. Yesterday, a large fire ignited in the
treeless tundra just 70 miles south of Arctic Ocean waters. You can
see a close up image of this fire in the MODIS shot above.
So
we have hard tundra burning just 70 miles south of the Arctic Ocean.
No trees here, just an endless expanse of thawing ground.
Links:
Hat
tip to Colorado Bob (First Observation)
Hat
tip to James Cole
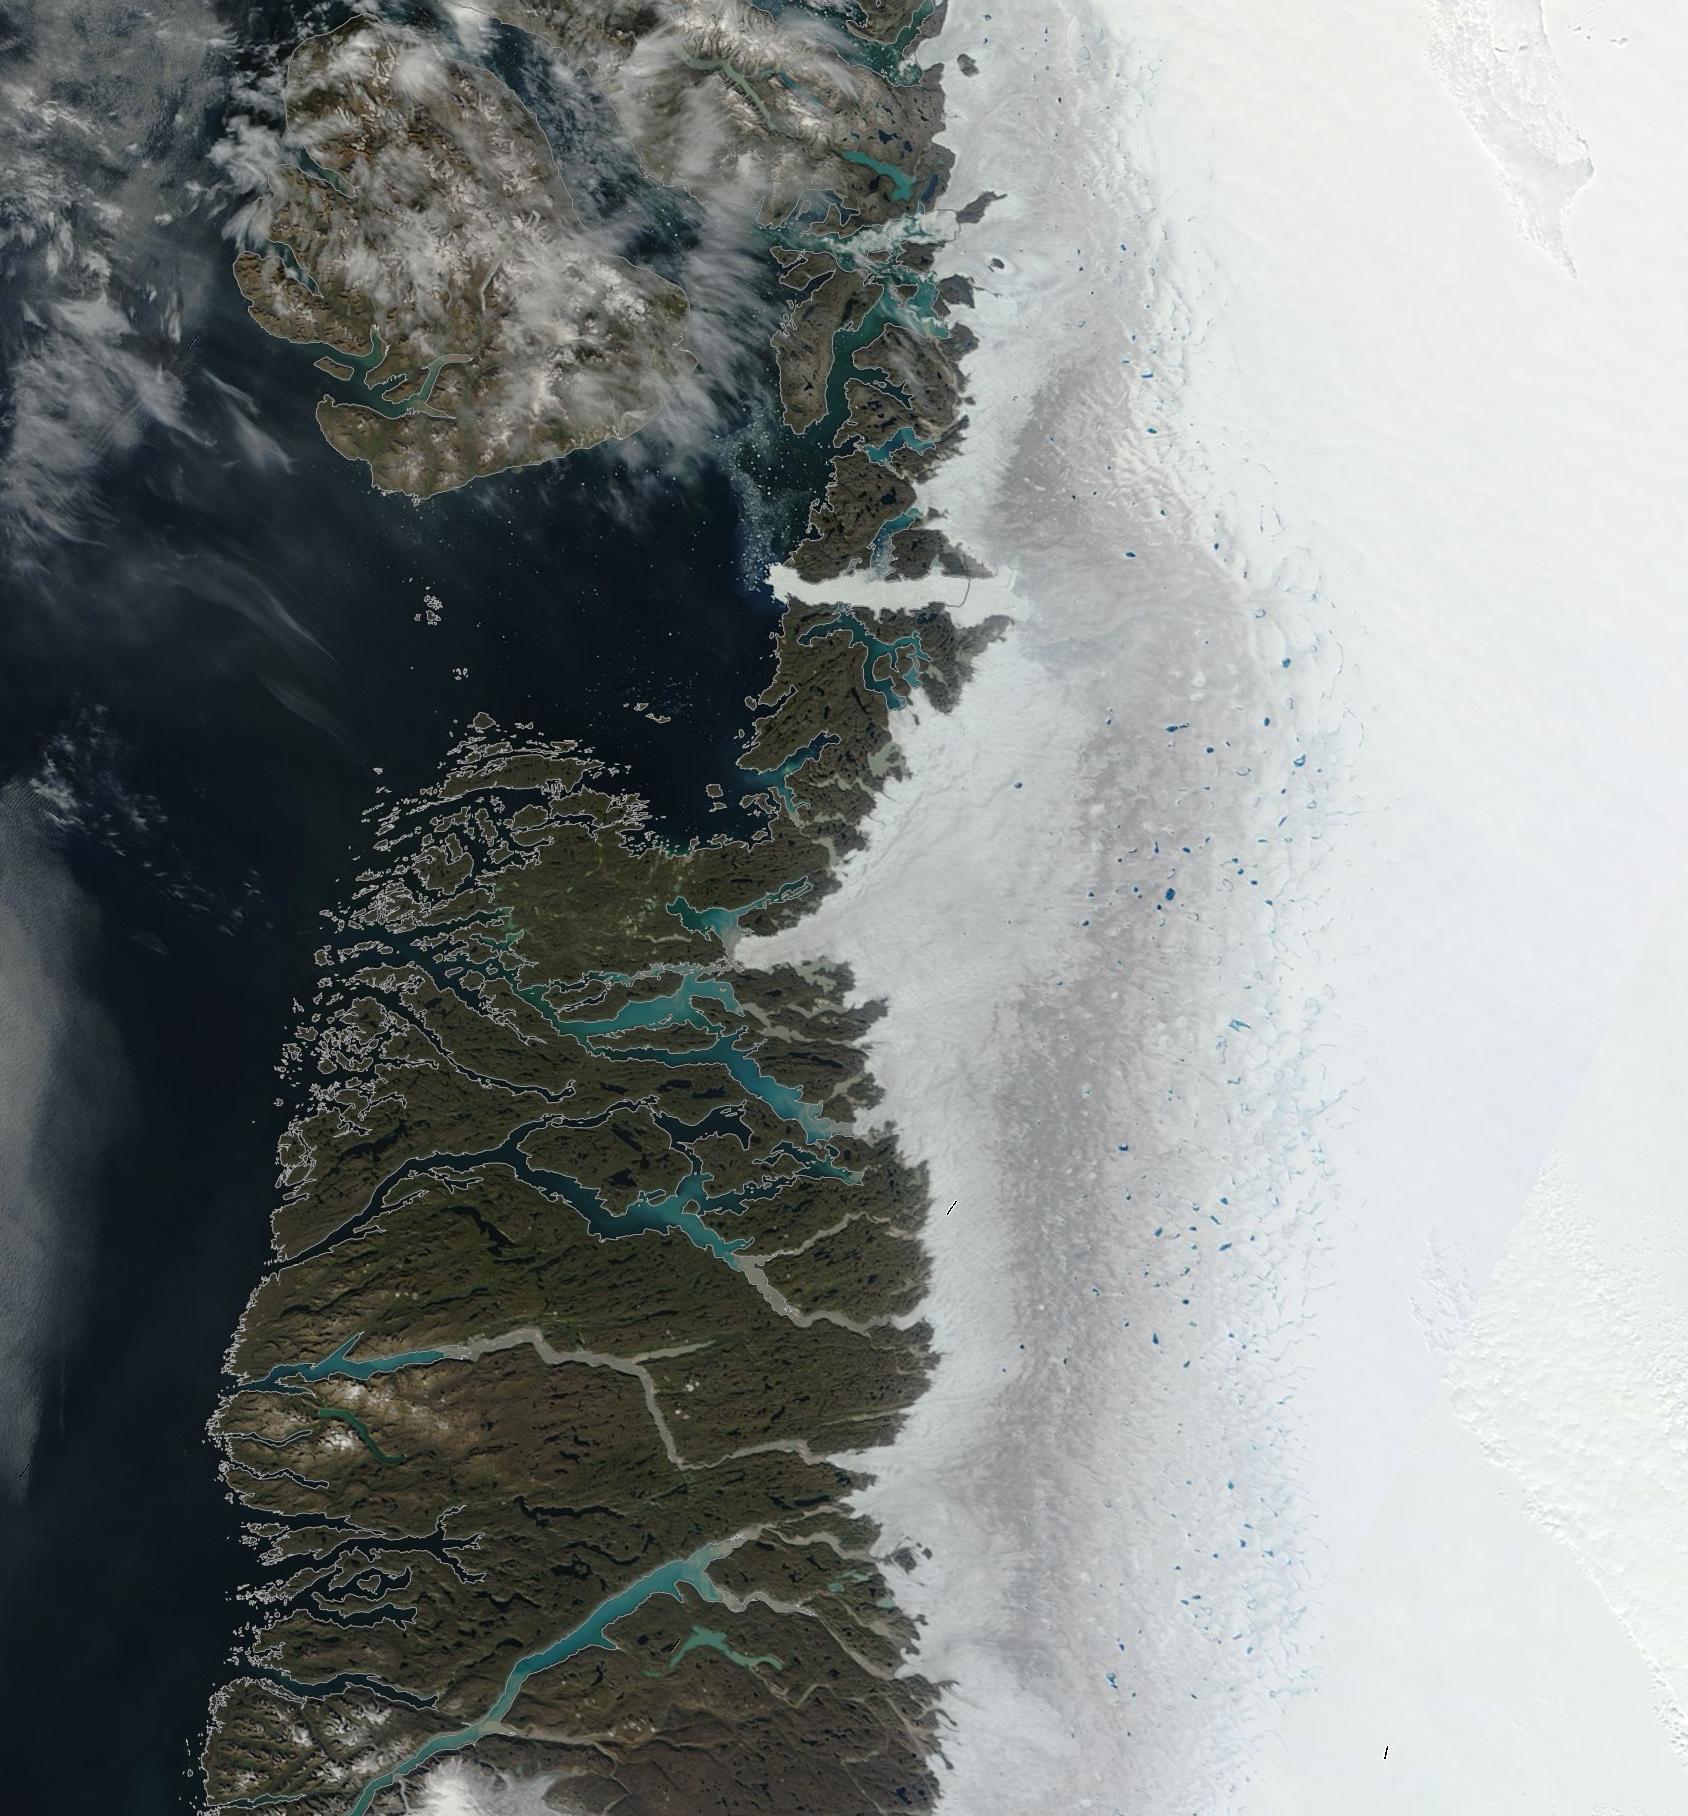
Smokey
Greenland Sees Another Summer of Substantial Melt

(Smoke from Record Northwest Territory Wildfires on August 1, 2014 crossing Baffin Bay and the West Coast of Greenland. Image source: LANCE-MODIS.)
1
August, 2014
According
to our best understanding of paleoclimate, at current greenhouse gas
levels of 402 parts per million CO2 and 481 parts per million CO2e,
the Greenland Ice Sheet eventually melts out entirely. It’s a level
of atmospheric heat forcing we’ve already set in place, a level
that keeps rising at a rate of about 2.2 parts per million CO2 and 3
parts per million CO2e each and every year due to our ongoing and
reckless carbon emissions. And it’s a level that is
already starting
to receive substantial additions from destabilizing permafrost
carbon together with likely
increasing releases from sea bed methane stores.
In
this, rather stark, geological, climatological and physical context,
we ask the question — is it possible for us to stop a wholesale
collapse of Greenland’s ice? And we wonder, how long can the ice
sheet last as human greenhouse gas forcings together with ongoing
releases from some of Earth’s largest carbon stores continue to
rise?
(Extensive melt ponds, Dark Snow on West Face of Greenland Ice Sheet near the Jakobshavn Glacier on July 30, 2014. Extensive darkening of the ice sheet surface, especially near the ice sheet edge, is resulting in more solar energy being absorbed by the ice sheet. Recent studies have shown that edge melt results in rapid destabilization and speeds glacier flows due to the fact that edge ice traditionally acts like a wall holding the more central and denser ice pack back. Notably, the Jakobshavn is currently Greenland’s fastest glacier. Image source: LANCE-MODIS.)
For
ultimately, our ability or inability to rapidly mitigate and then
draw down extreme levels of atmospheric greenhouse gasses will
provide an answer these key questions. And whether we realize it or
not, we are already in a race against a growing Earth Systems
response that may eventually overwhelm our efforts, if we continue to
delay for too long.
But
there’s a lot of inertia in the ice. It represents aeons and aeons
of ancient cold locked in great, mountain-high blocks. And its
eventual release, which is likely to continue to ramp higher and
higher this century, is bound to result in a temporary and
weather-wrecking outrush of that cold causing dramatic swings in
temperature and climate states to be the rule of the day for
Greenland as time moves forward.

(Large melt ponds, extensive surface water over Zachariae Glacier in Northeast Greenland on July 25 of 2014. For reference, the larger melt ponds in this image range from 1 to 4 kilometers at their widest points. The Zachariae Glacier sits atop a deep, below sea level channel that runs all the way to a massive below sea level basin at the center to the Greenland Ice Sheet. This Glacier is now one of more than 13 massive ice blocks that are moving at ever increasing velocity toward the ocean. Image source: LANCE-MODIS)
So
we should not expect any melt to follow a neat or smooth trend, but
to instead include large variations along an incline toward greater
losses. In short, we’ve likely locked in centuries of great
instability and variability during which the great ice sheets are
softened up and eventually wither away.
Another
Year of Strong Greenland Melt
In
the context of the past two decades, the 2014 summer melt has trended
well above the 30 year average in both melt extent and surface mass
losses. Though somewhat behind melt during 2012, 2014 may rank in the
top 10 melt years with continued strong melt in various regions and
an overall substantial loss of ice mass.
Surface
melt extent appears to be overall above 2013 values, ranging well
above the 1981-2010 average, but significantly below extents seen
during the record
2012 melt:


(Last three years of surface melt extent with the most current melt graph for the 2014 melt season at the top and the preceeding years 2013 and 2012 following chronologically. Dotted blue line indicates 1981-2010 average. Top three surface melt years in the record are 2012, 2010 and 2007, respectively. Image source: NSIDC.)
Overall,
2014 showed four melt spikes above 35% melt coverage with three
spikes nearing the 40% melt extent coverage mark. By contrast, 2013
only showed two such melt spikes, though the later spike was slightly
more intense than those seen during 2014. 2012’s 150 year melt, on
the other hand, showed melt extents ranging above 40 percent from mid
June to early August with two spikes above 60% and one spike above
80%.
Losses
of mass at the surface also showed above average melt trends, but
with net melt still below both 2013 and 2012:

(Greenland surface mass balance trend for 2014 [blue line] compared to mean for 1990 to 2011 [gray line] and record melt year of 2012 [red line]. Image source: DMI.)
2012
was a strong record year and, on average, we’d expect to see the
record jump back to lower levels after such a severe event. However,
there’s little to indicate that either 2013 or 2014 have bucked the
trend of ongoing and increasing surface melt over Greenland. To the
contrary, that trend is now well established with yearly surface mass
losses now taking place during all but one of the last 13 years. And
there is every indication that 2014 will be a continuation of this
trend.
Basal,
Interior Melt Not Taken Into Account in the Surface Measure
While
surface measures are a good measure of melt on the top of the ice
sheet, it doesn’t give much of an idea of what’s happening below
the first few feet. There, during recent years, sub surface melt
lakes have been forming even as warming ocean waters have eaten away
at the ice sheet’s base. And since more than 90% of human-caused
warming ends up in the world’s oceans even as many of Greenland’s
glaciers plunge hundreds of feet into these warming waters, one might
expect an additional significant melt to be coming from the
ocean-contacting ice faces.
We
can see an indication of the severe combined impact of basal,
interior and surface melt in the GRACE mass measurements of the
Greenland Ice Sheet since 2002. A record that finds a precipitous and
increasing rate of decline:

(Greenland cumulative mass loss through mid 2013. Data provided by the GRACE satellite gravity sensor. Image source: NOAA.)
It
is this ongoing overall mass loss that tells the ice sheet’s full
tale. One
that now includes an ever-increasing number of destabilized glaciers
speeding more and more rapidly seaward.
Links:
|
The
Really Scary Thing About Those Jaw-Dropping Siberian Craters |

1
August, 2014
Russian
scientists have determined that a massive crater discovered in a
remote part of Siberia was probably caused by thawing permafrost. The
crater is in the Yamal Peninsula, which means “end of the world.”
It caught hold of the media spotlight in mid-July when it was spotted
by oil and gas workers flying over the area. At roughly 200 feet wide
and seemingly bottomless, speculation abounded about the cause with
the Siberian Times reporting
that,
“theories range from meteorites, stray missiles, a man-made prank,
and aliens, to an explosive cocktail of methane or shale gas suddenly
exploding.”
Since
this first discovery, two other smaller craters have been spotted in
the surrounding regions, fueling even more armchair conjecture.
Russian scientists sent to the site are now providing first-hand data
showing that unusually high concentrations of methane of up to 9.6
percent were present at the bottom of the first large crater shortly
after it was discovered on July 16. Andrei Plekhanov, an
archaeologist at the Scientific Centre of Arctic Studies in
Salekhard, Russia, who led an expedition to the crater, told
The Journal Nature that air normally contains just 0.000179 percent
methane.
The
last two summers in the Yamal have been exceptionally warm at about
nine degrees Fahrenheit above average.
According
to Plekhanov, the last two summers in the Yamal have been
exceptionally warm at about nine degrees Fahrenheit above average.
Rising temperatures could have allowed the permafrost to thaw and
collapse, releasing the methane previously trapped by the
subterranean ice. Methane is the primary component of natural gas.
The original crater is about 20 miles from a large natural gas plant
and the entire Yamal Peninsula is rich in natural gas that is being
extensively tapped to help fuel Russia’s natural gas boom.
Hans-Wolfgang
Hubberten, a geochemist at the Alfred Wegener Institute in Potsdam,
Germany, told Nature that climate change and the slow, steady thaw of
the region could be to blame.
“Gas
pressure increased until it was high enough to push away the
overlying layers in a powerful injection, forming the crater,” he
said.

This
frame grab made Wednesday, July 16 shows the 200-foot wide crater
discovered in the Yamal Peninsula. CREDIT:
ASSOCIATED PRESS TELEVISION
While
staring down into the abyss of these craters is a scary thought, the
release of large quantities of greenhouse gases from melting
permafrost is existentially daunting. A study
from earlier this year found that melting permafrost soil, which
typically remains frozen all year, is thawing and decomposing at an
accelerating rate. This is releasing more methane into the
atmosphere, causing the greenhouse effect to increase global
temperatures and creating a positive
feedback loop
in which more permafrost melts.
“The
world is getting warmer, and the additional release of gas would only
add to our problems,” said
Jeff Chanton, the John Widmer Winchester Professor of Oceanography at
Florida State and researcher on the study. According to Chanton, if
the permafrost completely melts, there would be five times the
current amount of carbon equivalent in the atmosphere.
Kevin
Schaefer, a permafrost scientist at the National Snow and Ice Data
Center, told ThinkProgress that there are actually two sources of
GHGs released by melting permafrost: methane hydrates that
destabilize when permafrost temperatures rise, as has been the case
in Siberia, and frozen organic matter.
“Note
that the methane hydrate and the decaying organic matter emissions
result from two completely different mechanisms,” said Schaefer.
“Methane hydrate emissions come from deep permafrost due to purely
physical processes. The decaying organic matter emissions come from
near-surface permafrost due to purely biological processes.”
He
said that as the permafrost thaws, the organic matter will also thaw
and begin to decay, releasing CO2 and methane into the atmosphere.
“Published estimates indicate 120 gigatons of carbon emissions from
thawing permafrost by 2100, which would increase global temperatures
by an additional 7.98 percent,” he said.
As
with other processes in the permafrost zone, abrupt changes appear to
be as or perhaps more important than slow gradual change.
Schaefer
said the phenomenon of the Siberian craters was a surprise to him
because he thought the methane would leak out more slowly. Capturing
these large bursts of methane before they enter the atmosphere could
be possible, according to Schaefer, however extremely difficult.
“The
key is drilling into the permafrost before the methane escapes,” he
said. “However, creating the infrastructure just to get to these
remote locations is daunting.”
He
said that capturing the emissions from decaying organic matter would
be impossible.
Ted
Schuur, a professor of ecosystem ecology at the University of Florida
and leader of the Permafrost Carbon Network, told ThinkProgress that
the Siberian craters remind him of ‘hot spots’ of methane
bubbling that occur both in lakes and undersea in the permafrost
zone.
“This
could be a terrestrial version that was previously capped by ground
ice in permafrost,” he said. “If indeed they are the result of
warming permafrost they could be a significant pathway of greenhouse
gas release to the atmosphere. As with other processes in the
permafrost zone, abrupt changes appear to be as or perhaps more
important than slow gradual change.”
A
survey
of 41 permafrost scientists in 2011 estimated that if human
fossil-fuel use remained on a high projection and the planet warmed
significantly, gases from permafrost could eventually equal 35
percent of present day annual emissions. In the few years since then,
emissions have continued to rise.
If emissions are heavily curtailed, greenhouse gases from permafrost
could make up as little as around the equivalent of 10 percent of
today’s human-caused emissions. This is far lower, but still highly
disconcerting.
“Even
if it’s 5 or 10 percent of today’s emissions, it’s
exceptionally worrying, and 30 percent is humongous,” Josep G.
Canadell, a scientist in Australia who runs a global program to
monitor greenhouse gases, told
the New York Times at the time of the study. “It will be a chronic
source of emissions that will last hundreds of years.”
No comments:
Post a Comment
Note: only a member of this blog may post a comment.