

We have been fed propaganda on how much China is doing to reduce its emissions. Of course it was always a lie as any quick checking of the data will show.
There is a history of local communist governors lying to the central authorities. This is on an epic scale.
Margo and I have been covering methane emissions on a regualr basis for the last 6 months and although we have been concentrating on the Arctic it has been extremely difficult to overlook both China and India.
Question: when are they going to mention India's emissions?
China’s methane emissions rise despite tougher laws, satellite data shows
29 January, 2019
Methane emissions from coal mining in China have risen despite stricter government regulations that aimed to curb the greenhouse gas, satellite data shows.
The data, which is published in Nature Communications, finds China’s methane emissions rose by 1.1m tonnes a year between 2010 and 2015. This could account for up to a quarter of the rise in methane emissions seen globally over that period, the study finds.
China is the world’s largest emitter of methane – a greenhouse gas that is 34 timesmore potent than CO2 over a 100-year period.
The findings show how satellites can be used to pinpoint greenhouse gas emissions “from misbehaving industries that nobody may have suspected”, the lead author tells Carbon Brief.
Methane matters
Methane is the second largest contributor to human-caused global warming after CO2.
Globally, the largest driver of human-caused methane emissions is agriculture – particularly livestock and rice production. The second main driver is fossil fuel production, which allows underground methane to “escape” into the atmosphere during the drilling, extraction and transportation process.
(Methane is also released by several “natural processes” in wetlands, thawing permafrost and freshwater lakes.)
China is the world’s largest producer and consumer of coal. When coal is mined, methane can escape from the “coal seam” – the name given to a layer of coal in the earth that is thick enough to be exploited, says study lead author Prof Scot Miller, a researcher of greenhouse gases and air pollution from John Hopkins University in Baltimore. He tells Carbon Brief:
“Coal forms underground over long geological time scales and methane is often produced in the coal seams during this process. The methane remains trapped in the coal seam, but it can be released into the atmosphere if the coal seam is mined.”
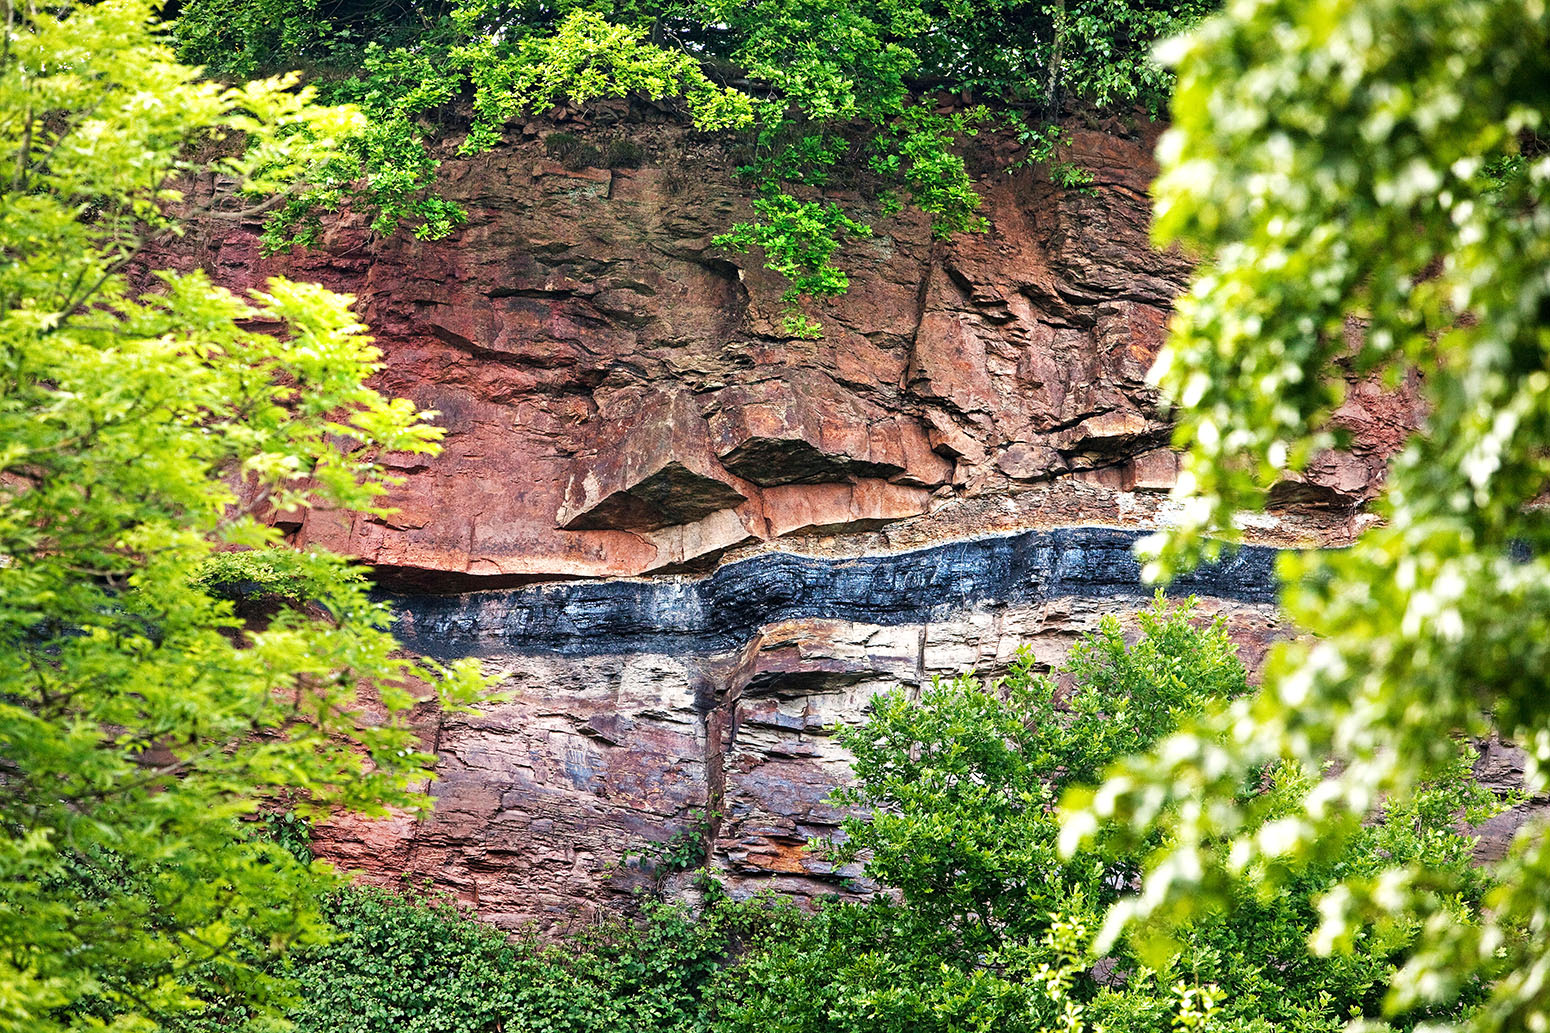
Geological outcrop with overground coal seam, Witten, Germany. Credit: imageBROKER / Alamy Stock Photo.
However, there are ways to reduce the methane emissions from the mining process, he adds:
“One option is to burn or ‘flare’ the methane. This process converts methane to CO2, a greenhouse gas that is much less potent per molecule. Another option is to capture this gas and use it to generate electricity or heat homes.”
(Methane flaring has faced criticism for being “wasteful”. In the US, Obama-era environmental regulations sought to minimise the practice – though the new rules were later rolled back by the Trump administration.)
China’s government has laid out “ambitious plans” to pursue these options, Miller says. In its 12th five-year plan, which set out policies for 2011-15, the Chinese government aimed to recover and utilise 5.6m tonnes of methane from coal mining. By 2020, it aims to recover 13.2m tonnes of methane.
But the satellite data collected by the research team suggests that these regulations have been “unsuccessful” in curbing methane emissions from mining, Miller says:
“We found that China’s methane emissions have been increasing ‘business as usual’ – and these increases are likely driven by increasing emissions from coal mines. In other words, China’s methane regulations have not had a detectable impact on the country’s methane emissions.”
Satellite sentinels
To study methane emissions from China and other parts of East Asia, the research team used data from the Greenhouse Gases Observing Satellite (GOSAT). The satellite was launched in 2009 by the Japan Aerospace Exploration Agency. (In 2016, Carbon Brief published an interactive showing how satellites, including GOSAT, are used to monitor climate change.)
The satellite detects levels of methane in the atmosphere using infrared sensors. This information is then analysed by statistical models to link it to changes in methane observed at the Earth’s surface, Miller says.
The results show that China’s methane emissions rose at a rate of 1.1m tonnes a year between 2010 and 2015. This is indicated on the chart below, which shows the results from this study (green) alongside other previous estimates.
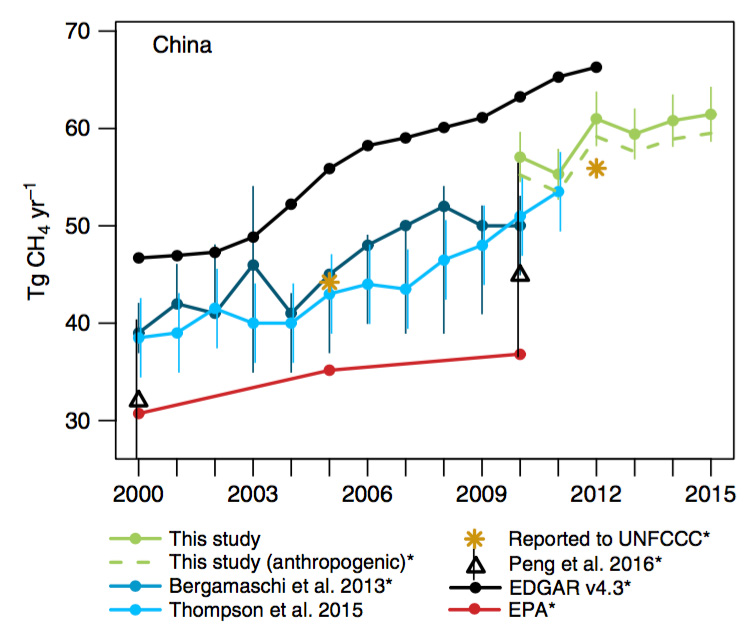
Methane emissions from China, according to this study (green; anthropogenic emissions in dashed green), Bergamaschi et al.(2013) (dark blue), Thompson et al. (2015) (light blue), Peng et al. (2016) (triangles), the Emissions Database for Global Atmospheric Research (EDGAR) (black), the US Environmental Protection Agency (EPA) and official statistics reported to the United Nations Framework Convention on Climate Change (UNFCCC) (stars). Note: the y-axis does not begin at zero. Source: Miller et al. (2019)
Since 2007, global methane emissions have been increasing at an annual rate of between 5m and 8m tonnes a year, the study says. This means the increase seen in China could represent between 11% and 24% of the global rise in methane emissions.
The researchers compared their results to previous studies looking at China’s methane emissions from 2000-10 (shown on the chart above). This comparison shows that “China’s emissions have been increasing at the same rate as during earlier years, in spite of the government’s coal mining regulations”, Miller says.
One estimate – from the Emissions Database for Global Atmospheric Research (EDGAR; black line on chart) – found China’s methane emissions to be even higher from 2010 to 2012.
This estimate uses a “bottom-up” approach – which involves recording methane emissions from the ground, says Prof Greet Janssens-Maenhout, a project leader of EDGAR at the European Commission’s Joint Research Centre. She tells Carbon Brief:
“I think this is a nice [study] and, in fact, the bottom-up estimates and top-down estimates [from this study] don’t differ that much. There is much more agreement now than there was in the past.”
Also notable is that the estimates for China’s methane emissions in 2012 from both this “bottom-up” approach and the new study are higher than the figure reported by China to the United Nations Framework Convention on Climate Change (UNFCCC).
(China is a “non-Annex I” country and so not required to report its greenhouse gas emissions to the UNFCCC on an annual basis.)
Detecting cow fields
The modelling technique also allowed researchers to decide whether methane detected by the satellite had originated from a coal mine, a rice paddy, a cow field or a natural source, such as a wetland, Miller says.
The chart below shows a breakdown of methane emissions in China by sector. The sectors considered include coal (orange), rice (purple), agriculture (turquoise), waste (red), oil and gas (green) and natural sources (grey).
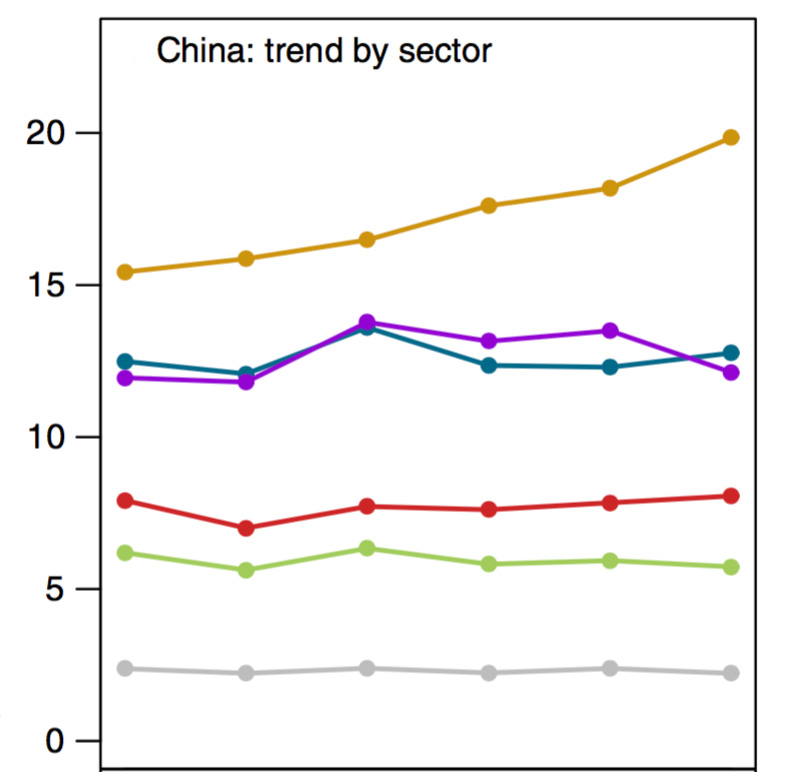
Methane emissions (in millions of tonnes) in China between 2011 and 2015 from coal (orange), rice (purple), agriculture (turquoise), waste (red), oil and gas (green) and natural sources (grey). Source: Miller et al. (2019)
The results suggest that coal mining was the main driver of the rise in methane emissions in China from 2011-15, Miller says:
“We saw the largest increases in methane emissions from regions with a lot of coal production and from regions where the coal seams are known to have large amounts of trapped gas.
“Methane is also emitted by agriculture – by cows, manure management and rice paddies. But between 2010 and 2015, coal mining in China increased enormously while rice production and the number of cows did not. These two lines of evidence indicate that coal mining has probably been driving recent increases in methane emissions from China.”
Missed targets
The findings suggest that China’s “ambitious benchmarks, regulations and incentives” for slashing methane emissions from coal mining had little effect from 2010-15, the authors say.
This could be down to “insufficient infrastructure”, “inadequate technology” and “inadequate or poorly-designed policies”, the authors write in their research paper.
For example, “most coal mines are located in remote mountainous areas, areas that are poorly connected to cities or natural gas infrastructure” – which is needed to recover methane from coal mines, the authors say.
In addition, some policies to promote methane utilisation may have “backfired”, the authors note: “Government policy requires that all mines utilise drained gas with greater than 30% methane content…[There is] anecdotal evidence that mine operators may be diluting drained gas to circumvent the requirement.”
The new findings highlight how using satellites can give an unbiased picture of how greenhouse gas emissions are changing from country to country, Miller says:
“Countries like the US and China estimate their emissions by tallying the number of coal mines, the number of cows, or the number of natural gas wells. However, these inventories can overlook sources or underestimate emissions from misbehaving actors.
“By contrast, greenhouse gas measurements in the atmosphere can detect emissions across an entire landscape, including emissions that government inventories overlook and emissions from misbehaving industries that nobody may have suspected.”
The evidence presented in the study is “alarming”, says Dr Michelle Cain, a science and policy research associate at the Oxford Martin School at the University of Oxford, who was not involved in the research. She tells Carbon Brief:
“This is useful [for] piecing together the full story of what is driving global atmospheric methane upwards. Increasing levels of methane in the atmosphere mean additional warming, so this is an important question to answer if we want to work out whether we are on track to limit warming to 1.5 or 2C.”
There should be sanctions imposed if they don't try to resolve there pollution problems
ReplyDelete