This propaganda, (I would could it lies) dates from 2017 -
2 years ago. The idea that China's emissions were falling
was always pure nonsense but one couldn't prove it.
Here they even provide a graph to 'prove' their lies.
https://insideclimatenews.org/news/28022017/chinas-co2-reduction-clean-energy-trump-us?fbclid=IwAR3El2M1WY3M0Eypw-UbATgT23qoSr-w--DoYDxdQTvpE8EkMOZOmYxkJws
https://www.reuters.com/article/us-china-carbon-idUSKCN0W900J
Now, the truth comes out

China’s
carbon emissions data is notoriously opaque, but as a signatory to
the United Nations Framework Convention on Climate Change, Beijing is
obliged to submit an official inventory to the UN on a regular basis.
It has previously released figures for 2005 and 2010.
As the world’s biggest greenhouse gas producer, China is aiming to bring its total emissions to a peak by “around 2030”, though it has also pledged to show “the highest possible ambition” when it reviews its targets next year.
The 2014 figure, based on the most recent calculations by the Chinese government, includes China’s emissions of greenhouse gases such as carbon dioxide and methane, but does not make adjustments based on changes in land use or increases in forest coverage.
The environment ministry said if the impact of forests and other “carbon sinks” were taken into consideration, total emissions would have stood at 11.186 billion tonnes in 2014, still up 17 per cent from 2010.
Total net US emissions were measured at 5.74 billion tonnes of CO2 equivalent in 2017, down 0.5 per cent on the y
A study published by the Nature Geoscience journal last year estimated that China’s total emissions hit a record 9.53 billion tonnes in 2013 and then declined over the following three years.
The decline in CO2 from 2014 to 2016 came as a result of falling energy consumption, but it has since rebounded.
Record production levels in carbon-intensive sectors such as steel could mean CO2 emissions are still on the rise and could hit fresh records this year, environmental group Greenpeace said.ear, according to the country’s Environmental Protection Agency.
If you need your news to come from a US corporate source...
https://www.cnbc.com/2019/07/15/china-says-its-greenhouse-gas-emissions-soar-over-50percent-in-2005-2014.html?__source=twitter&fbclid=IwAR0W0JQMaD0-x0FsDSLJVj-qoUjb9lc4l7WmpuhbRZO5ddUjfg7oj-1J5pA
Just look at CAMS any day of the year and you can see where the emissions come from
2 years ago. The idea that China's emissions were falling
was always pure nonsense but one couldn't prove it.
Here they even provide a graph to 'prove' their lies.
https://insideclimatenews.org/news/28022017/chinas-co2-reduction-clean-energy-trump-us?fbclid=IwAR3El2M1WY3M0Eypw-UbATgT23qoSr-w--DoYDxdQTvpE8EkMOZOmYxkJws
https://www.reuters.com/article/us-china-carbon-idUSKCN0W900J
Now, the truth comes out
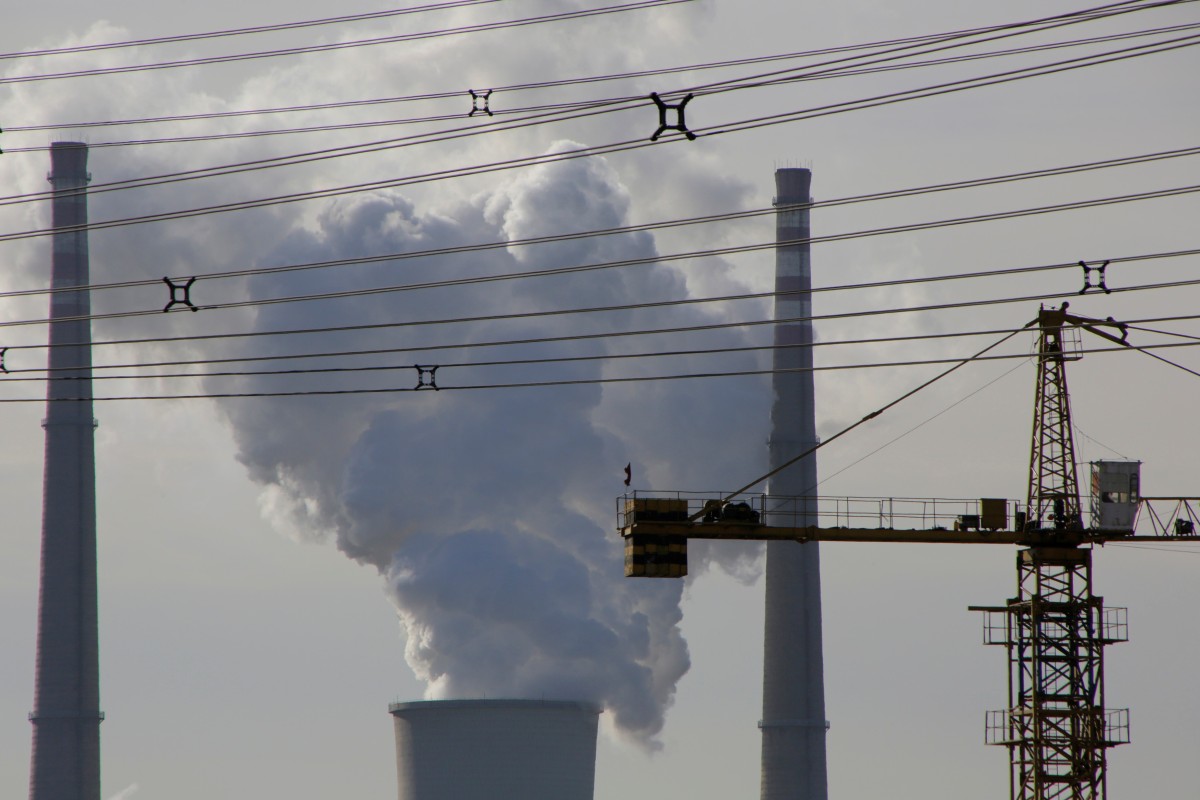
China’s greenhouse gas emissions soar 53 per cent in a decade, data shows
- Figure for 2014 was 12.3 billion tonnes, according to carbon ‘inventory’ submitted to United Nations
- Country is aiming to bring its total to a peak by ‘around 2030’

SCMP,
17 July, 2019
China’s climate-warming greenhouse gas emissions hit 12.3 billion tonnes in 2014, up 53.5 per cent in just a decade, the environment ministry said on Monday, citing the country’s latest carbon “inventory” submitted to the United Nations.
As the world’s biggest greenhouse gas producer, China is aiming to bring its total emissions to a peak by “around 2030”, though it has also pledged to show “the highest possible ambition” when it reviews its targets next year.
The 2014 figure, based on the most recent calculations by the Chinese government, includes China’s emissions of greenhouse gases such as carbon dioxide and methane, but does not make adjustments based on changes in land use or increases in forest coverage.
The environment ministry said if the impact of forests and other “carbon sinks” were taken into consideration, total emissions would have stood at 11.186 billion tonnes in 2014, still up 17 per cent from 2010.
Total net US emissions were measured at 5.74 billion tonnes of CO2 equivalent in 2017, down 0.5 per cent on the y
A study published by the Nature Geoscience journal last year estimated that China’s total emissions hit a record 9.53 billion tonnes in 2013 and then declined over the following three years.
The decline in CO2 from 2014 to 2016 came as a result of falling energy consumption, but it has since rebounded.
Record production levels in carbon-intensive sectors such as steel could mean CO2 emissions are still on the rise and could hit fresh records this year, environmental group Greenpeace said.ear, according to the country’s Environmental Protection Agency.
If you need your news to come from a US corporate source...
https://www.cnbc.com/2019/07/15/china-says-its-greenhouse-gas-emissions-soar-over-50percent-in-2005-2014.html?__source=twitter&fbclid=IwAR0W0JQMaD0-x0FsDSLJVj-qoUjb9lc4l7WmpuhbRZO5ddUjfg7oj-1J5pA
Just look at CAMS any day of the year and you can see where the emissions come from


No comments:
Post a Comment
Note: only a member of this blog may post a comment.