

2014-2015 El Nino Already Most Intense Since 1997-1998, Long Range Model Guidance Shows Strong-to-Monstrous Potential
12
June, 2015
It
all started with a powerful Springtime Kelvin Wave. A trans-ocean
telegraphing of heat that signaled the ramp-up toward El Nino during
2014. Heat spread out over the ocean surface and just beneath, but a
failure of the atmosphere to respond to this forcing meant only the
emergence of a weak El Nino by early 2015. At that time, it looked as
if the El Nino could fade, adding to a long list of other
weak-to-moderate events since the record-shattering years of
1997-1998.
But
extraordinary westerly winds developed over the Western Pacific
during late Winter and re-emerged through Spring. As a result, warm
waters again gathered in an eastward surge across the Pacific — a
Kelvin Wave more powerful than even the intense 2014 event.

(The
Spring Kelvin Wave remains very hot into early June, showing some
reinvigoration due to atmospheric feedbacks. Image source: NOAA’s
Climate Prediction Center.)
By
April and May it had flooded into a warm pool off the West Coast of
South America, pushing surface waters into the peak values of 3-4
Celsius above average temperatures, while 5-6 C + above average
temperatures lurked just below the surface.
By
June, the Kelvin Wave had re-intensified even as it rebounded a bit
off South America. Meanwhile, ocean surface heating continued to ramp
up. By June 8, temperatures in the Central Pacific Nino 3.4 zone had
hit a +1.2 C anomaly — already entering moderate El Nino range.
Meanwhile, NOAA’s multivariate ENSO index showed that by June 4 the
2014-2015 El Nino was now stronger than any event since 1997-1998
with overall departures now exceeding the +1.5 C range. Such a
departure marks a foray into strong El Nino territory:

(2014-2015
El Nino creeps into strong range exceeding all previous Equatorial
Pacific warming events since 1997-1998. Image source: NOAA’s
Earth Systems Research Lab.)
It’s
important to note that models have very high uncertainty during the
Spring due to a tendency of summer patterns to tamp down El Nino
intensification. However, cloudiness has built and persisted over a
broad band of the Equatorial Pacific — a
factor spurring the most intense early season tropical cyclone
development the Northern Hemisphere has ever seen.
In addition, atmospheric wind patterns have continued to support El
Nino strengthening. This continued pattern yesterday
led WeatherUnderground
blogger Bob Henson to
this summation:
This time, the atmosphere and ocean are much more in sync, so we can put more trust in the current model outlooks—especially now that we’re past the “spring predictability barrier” that makes early-year forecasts of El Niño so tough. In today’s update, NOAA is calling for a greater than 90% chance that El Niño will continue through the northern fall of 2015, and around an 85% chance it will last through the winter of 2015-16.
Should
El Nino start to peter out now, we’d be looking at something
perhaps a bit stronger than the 2009-2010 event. But given the above
trends, El Nino is still strengthening. A fact confirmed by forecast
model runs that continue to show potential for a strong to
potentially record-shattering event come Fall of 2015.

(Australian
Bureau of Meteorology shows model runs predicting a strong to record
shattering El Nino by October of 2015. Image source: BOM.)
All
long range models now show Nino 3.4 sea surface temperatures
predicted to hit between 1.5 and 3.0 C above base-line levels by
October. Model averages now show a 2.4 C departure for all the major
runs. Such an event would be extraordinary — equaling or exceeding
the 1997-1998 El Nino (which topped off at 2.2 C above average in the
three month measure).
All
this information generates a clear picture of a still intensifying El
Niño. One that has an increasing potential to develop into a real
beast come Fall. As a result, we can expect continued global record
hot temperatures to continue, as El Nino combines with an egregious
human fossil fuel burning to shove global temperatures into
ever-more-dangerous ranges. In addition, storm track intensification
come Fall could be quite extreme when one considers both the possible
strength of El Nino and the powerful atmospheric moisture loading due
to a ramp up of temperatures into the range of +0.95 C above 1880s
averages.
Links:
Hat
Tip to Colorado Bob
(Please
support the public climate tracking efforts of NOAA and BOM, without
which many of these reports would not be possible)
Whilst I cannot fault his climate science I cannot go along with the contention that the die-off of life in the Pacific is solely due to the warming ocean, and not due to Fukushima. Similarly, I cannot hold with the few that it is due to radiation and not climate change.
This is a perfect storm. With the coming together of factors we can safely say the Pacific is dead.
Climate Change’s ‘Blob’ Heats Up In Northeast Pacific
11
June, 2015
They
call it The Blob. No, it’s not some campy 1950s horror flick
featuring a gelatinous monstrosity from space aimed at devouring all
life in its path. This Blob is a pool of much hotter than normal
water that has become increasingly entrenched in the North-East
Pacific. A surface zone of record ocean warmth that has persisted and
intensified in the same region for the better part of two years.
Though
it’s not the sci-fi movie Blob, this particular climate change
monstrosity could well be described as stranger than fiction. It’s
an ocean feature of the Ridiculously Resilient Ridge which has warded
storms off the North American West Coast over the past couple of
years. A likely upshot of an ongoing Arctic heating — setting off
weather conditions that sparked both this year’s massive Northwest
Territory Wildfires and the worst drought the California region has
seen in at least 1,000 years. And like the sci-fi movie space monster
of yore, the Northeast Pacific heat Blob has a nasty penchant for
devouring ocean life of all kinds.
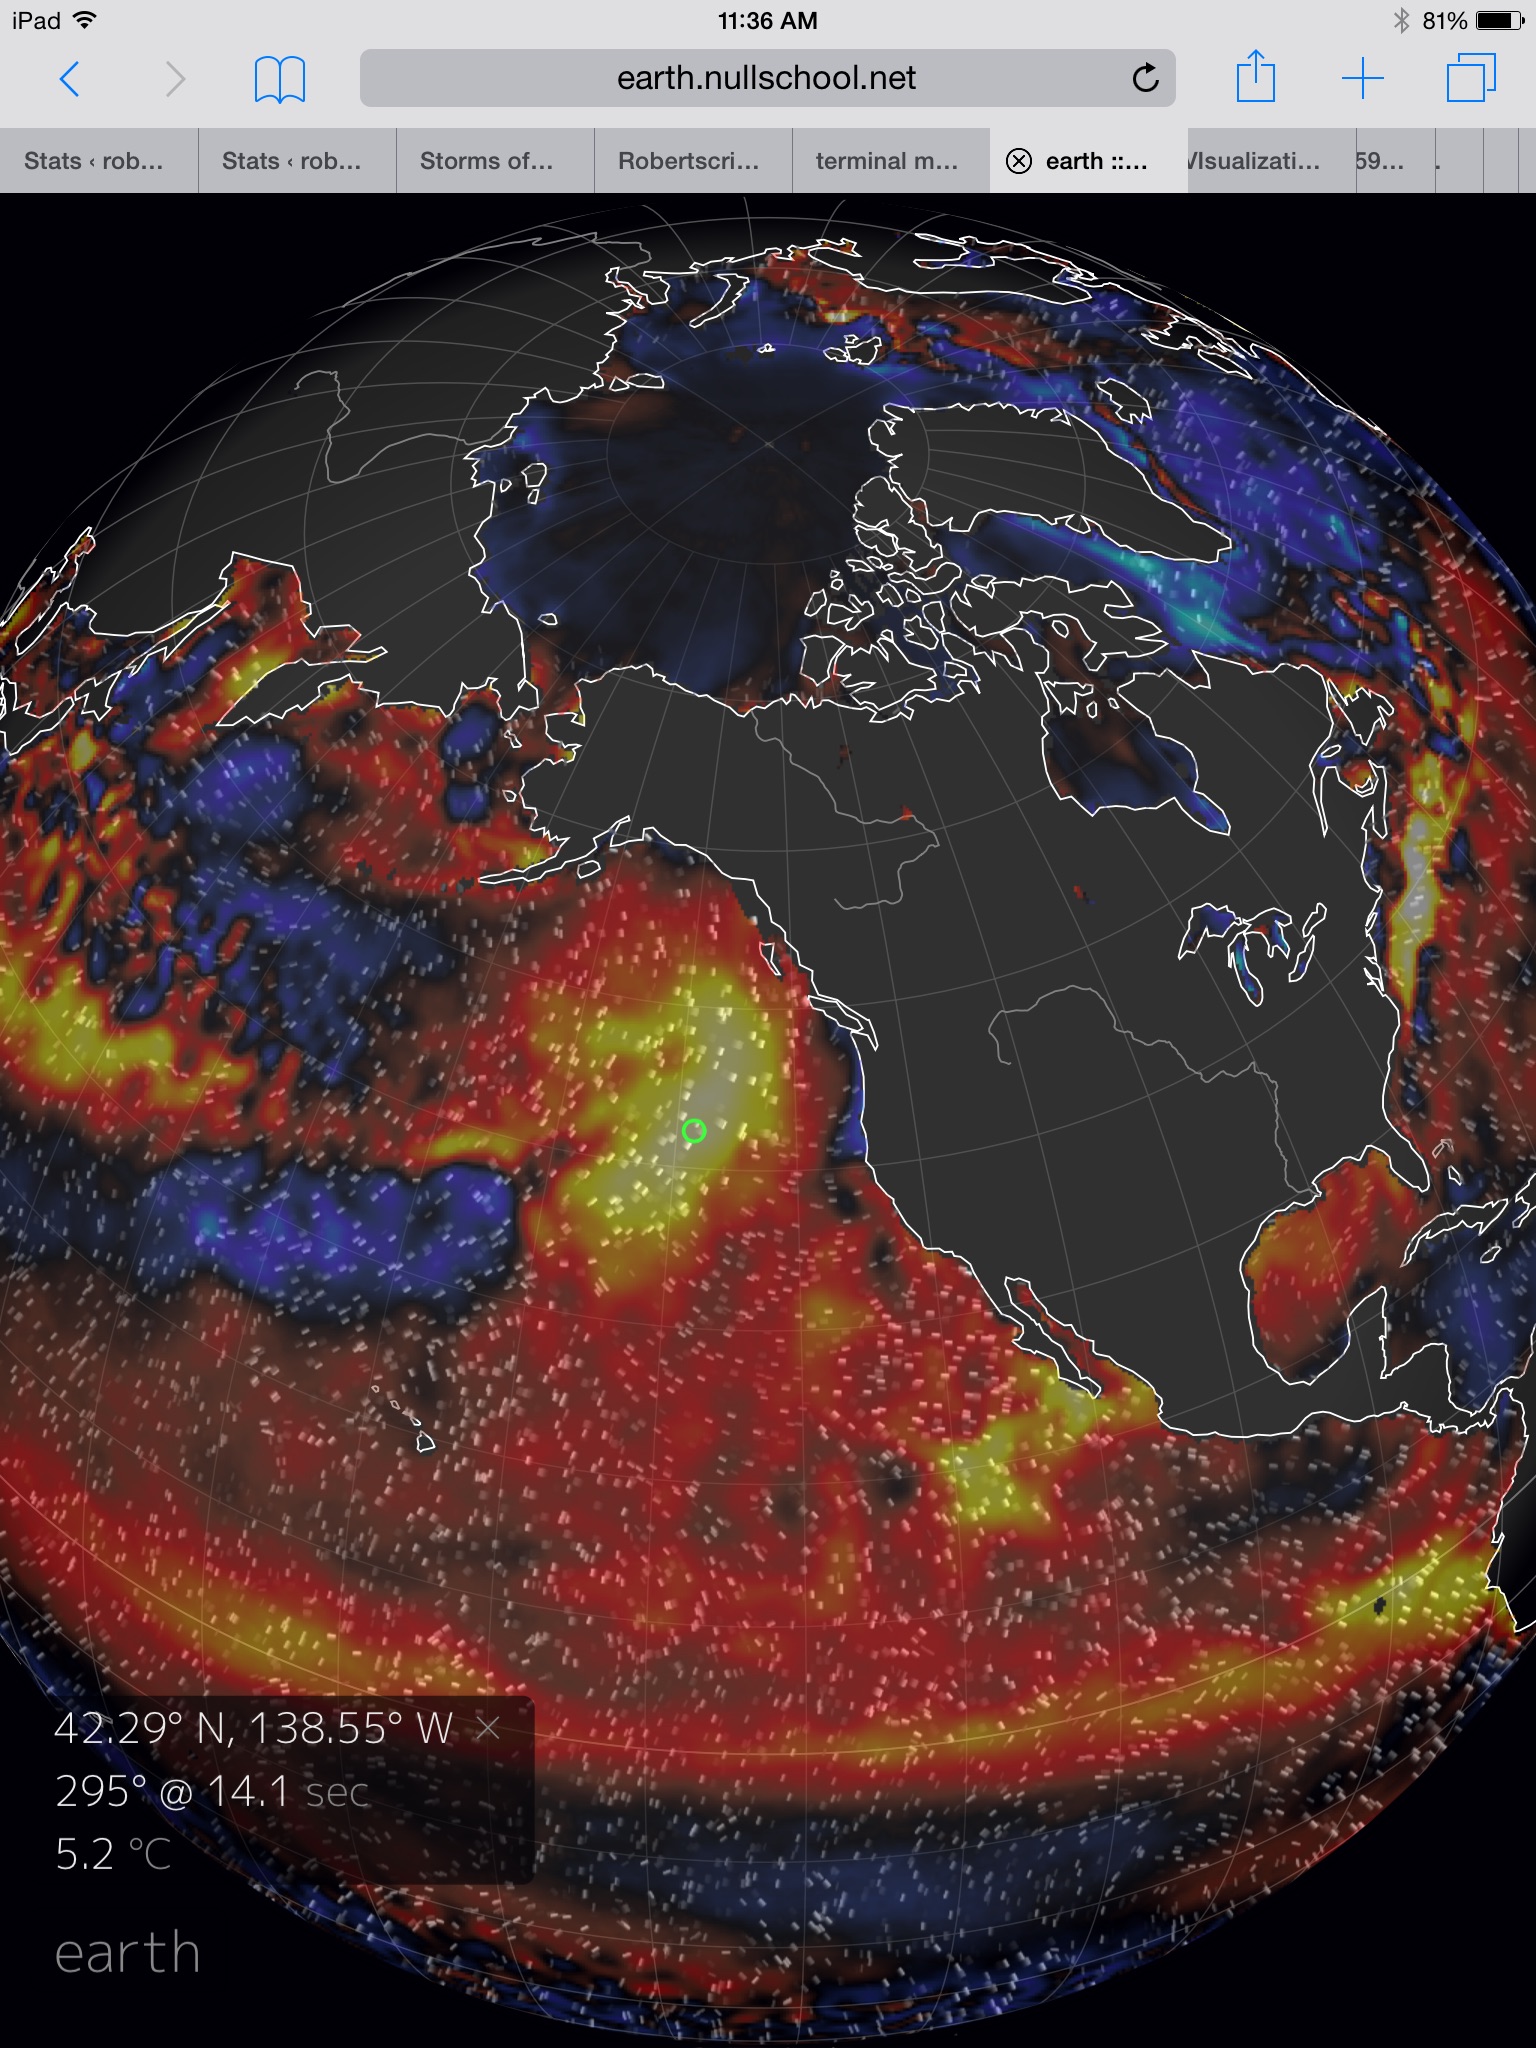
(Under
an ongoing El Nino, the Equatorial Pacific is getting pretty hot with
temperature spikes ranging from +2.5 C above normal temperatures at
mid-ocean to +4 C above average off the West Coast of South America.
But these rather warm temperature anomalies are nothing compared to
The Blob [at center frame above] which now features temperatures in
the range of +5 C above average. Image source: Earth
Nullschool.)
The
news about The Blob today comes in two forms — bad and worse. The
bad news is that it’s still there. Still influencing our weather,
still threatening sea life and fisheries. And the worse news is that
it appears to be heating up. Today’s readings put much of The Blob
in the 3.5 to 5.5 C above average temperature range, which is 1.5 to
2 degrees Celsius warmer than we’ve seen in this zone since its
first heat intensification during the spring of 2014.
Wonky
Weather
Back
in April, a study published in Geophysical
Research Letters and
reported in LiveScience found
that temperatures over a broad region of Northeast Pacific surface
waters had averaged between 1-4 C (2 to 7 F) above normal
temperatures. It covered an area roughly 1,000 miles in
diameter and extended about 300 feet below surface waters.
Nick
Bond, one of the study’s co-authors (and coiner of the term
‘Blob’), had this statement for
the American Geophysical Union:
“In the fall of 2013 and early 2014 we started to notice a big, almost circular mass of water that just didn’t cool off as much as it usually did, so by spring of 2014 it was warmer than we had ever seen it for that time of year.”

(Warm
Blob T anomalies for April of 2014 as provided by NOAA
and AGU.
Note that today’s anomalies are well in excess of April 2014
readings.)
The
Blob’s large size combined with its failure to cool in spring to
set off some rather strange weather impacts, according to the
report’s findings. Winds blowing over high heat content ocean
waters ran inland over the US and Canadian West Coasts. This invasion
pushed warm air over lands and mountains. Snowpacks melted, lands
warmed and dried out. Massive wildfires erupted thoughout both the US
and Canada.
The
hot air mass over the warm water blob has acted as a brutish
atmospheric feature since this time. Like a towering wall of air it
has consistently deflected oncoming storms that typically charge
across the Pacific During Winter and Spring — reinforcing a weird
extreme weather regime.
Threat
to Sea Life
The
AGU report also cited recent severe impacts to sea life as found in a
March 17 study
by NOAA.
Highlights of the NOAA study showed substantial ocean life impacts
including weaker copopod production in the warming waters, likely
less vital salmon fisheries, bird deaths, marine mammal deaths and
starving sea lions due to scarcity of food sources. In addition, the
warm temperatures have been linked to a starfish wasting sickness
that has killed off millions of sea stars up and down the North
American West Coast.
What
the NOAA report did not include was growing evidence that warming
waters off the US West Coast have (when combined with eutriphication
due to atmospheric nitrogen seeding through fossil fuel burning and
farm nutrient runoff), since the early 2000s, resulted in
increasingly dangerous low ocean oxygen levels (see Starving
Sea Lion Pups and Liquified Starfish).
It’s a one-two warming and oxygen loss that is pretty amazingly
dangerous to ocean life.
The
NOAA study further noted that the high sea surface temperatures
spurring these impacts were at or near unprecedented levels, a
confirmation of the AGU report findings:
“We are in some ways entering a situation we haven’t seen before,” said Cisco Werner, Director of the Southwest Fisheries Science Center in La Jolla, Calif. “That makes it all the more important to look at how these conditions affect the entire ecosystem because different components and different species may be affected differently.”
PDO
and Climate Change Not Helping
The
current unprecedented warm temperatures in The Blob are, in part, an
upshot of a warmer sea surface state now in effect called positive
Pacific Decadal Oscillation (PDO). During these times, Pacific Ocean
waters tend to be warmer — especially in the region where the Blob
has recently emerged. During December of 2014, PDO hit new all-time
record high values — an extreme likely pushed over the top by added
atmospheric and ocean heating through human greenhouse gas emissions.
During
positive PDO periods, El Nino events both tend to be more prevalent
and show higher intensity. And during spring and summer El Ninos, we
tend to see increased warming of the Pacific region now dominated by
The Blob.

(A
powerful blocking pattern associated with The Blob remains in place
today. Image source:Earth
Nullschool.)
All
these PDO based fluxes are natural variability related. But the real
kicker, the icing on the cake of this extreme event is almost
certainly climate change. Specifically for the hot Blob zone, general
greenhouse gas warming of the adjacent Arctic called Polar
Amplification has tended to generate a weakness in the Jet Stream
directly over the region. This weakness has tended to aid in
Ridiculously Resilient Ridge development and the month on month, year
on year heatwaves that have pushed ocean temperatures in this zone
into ever more extreme hot values (see Dr. Francis’s “Weird
Weather Plot Thickens As
Arctic Swiftly Warms“).
And though overall global warming now in the range of +0.95 C above
1880s values has also likely contributed in a broader sense, the
direct impact to the Arctic has likely aided in the development of a
high anomaly heat spike for this particular ocean one.
So,
in total, we have a number of factors pushing record ocean warmth in
this region, setting the stage for sea creature death and wrecked
North American weather alike. But the primary contributor to these
unsettling events is almost certainly climate change. For its
influences have made possible the new levels of extreme conditions
which we are now experiencing.
Links:
No comments:
Post a Comment
Note: only a member of this blog may post a comment.