Showing posts with label heat. Show all posts

Saturday, 7 November 2015

Extreme Heat is what defines climate change

All the talk is of sea level rise. However the thing that is going to destroy habitat for human beings in fairly short order is extreme heat and climatic extremes.

Extreme Heat Is Defining Climate Change


5 November, 2015

The lasting legacy of climate change will be heat. The land, the oceans, all of it. It’s the tie that binds and while the global average temperature is the defining metric, the increasing incidence of heat waves and longer lasting extreme heat is how the world will experience it.

Climate change has helped shift the odds of extreme heat.

All eight papers dealing with extreme heat events in this year’s Bulletin of the American Meteorological Society’s attribution report show a clear climate change signal that made them more likely, more hot or both. In fact, of the 22 studies scientists have submitted to the annual review over the past four years, only one didn’t find that climate change increased the odds or severity of extreme heat.


"​Global warming is the most obvious, well-documented effect of ​climate change,” Stephanie Herring, a climate scientist at the National Oceanic and Atmospheric Administration and organizer of this year’s attribution issue, said. “As a result, the signal is very strong so we can more easily detect it amongst noise of natural variability compared to other types of extreme events."

In the case of a strong signal, 2014 stands out as particularly notable. It was the hottest year on record, though this year is on track to top last year’s record (and signs are already pointing to 2016 continuing the record heat parade).

The lift in background temperatures makes extreme heat more likely. “The underlying processes that relate climate change to heat wave intensity and frequency are fairly straightforward to understand: if you increase the average temperature by even a modest amount, then it turns out that you dramatically increase the area under the extreme positive ‘tail’ of the distribution,” Michael Mann, a climate scientist at Penn State who wasn’t involved in any of the new studies, said in an email.

Put another way, it’s like having Steph Curry on your basketball team. He doesn’t always guarantee a win, but he sure as heck increases the odds of a victory.
Unfortunately, rising temperatures are not a game and can have dangerous consequences. Heat at last year’s Australian Open had players hallucinating on the court and this year’s heat wave in India killed thousands.
Maximum temperature anomalies for Australia's May 2014 heat wave.
Credit: Australia Bureau of Meteorology

Researchers looked at heat waves and longer-lasting extreme heat events in Korea, Australia, Argentina, Europe and warm ocean temperatures in parts of the Pacific and Atlantic. In all cases, they found that climate change played a role in increasing the likelihood of extreme heat.


The May 2014 heat wave in Australia included some of the most dramatic results, with climate change increasing the likelihood an eye-popping, sweat-inducing 23 times.
For that study, researchers zoomed down to the city-level in Adelaide and Melbourne. Mitchell Black, the study’s lead author and Ph.D. student at the University of Melbourne, said it is likely the first time such a localized analysis has been done.

Climate change is also making extreme heat even hotter. It’s not just a game of odds when it comes to extreme heat, it’s also one of intensity. An analysis of Europe’s incredibly warm year in 2014 shows that human greenhouse gas emissions are responsible for roughly half of the extra warmth added to the system.

It’s tougher to tease out these intensity connections, but in addition to Europe’s hot year, the May 2014 Australian heat wave and a December 2013 Argentinian heat wave also got a boost in strength from global warming.
The findings could be moving from academia to the public discourse. The new findings show that it isn’t a question of if climate change is influencing extreme heat, it’s basically a question of how much of an influence it has on a particular event.

Heat is the one ​event ​that is most ready for the ​science ​community to have a discussion of ​whether or not every heat ​attribution assessment​ necessarily​​ needs to go ​through the peer review process,” Herring said.
There are already some efforts underway to do get these types of analyses out to the public sooner rather than later, including World Weather Attribution, a project at Climate Central that involves the University of Oxford Environmental Change Institute, the Royal Netherlands Meteorological Institute, the University of Melbourne, and the Red Cross Red Crescent Climate Centre. Herring also noted an effort by the U.K. Met Office to do real time attribution of this summer’s heat wave in Europe as an example of government agencies providing that information directly.

One of the challenges remaining for the science is reducing the range of uncertainty around how much global warming is increasing the odds of extreme heat and whether 1-in-1,000 year events will now be 1-in-100 year events or 1-in-5 year events.
Society could benefit from improved climate change and heat predictions. With heat waves likely tocontinue increasing in frequency and intensity, their impact on people around the world will continue to row.

For example, danger days — when the heat index tops 105°F — are becoming more common in the U.S. and are set to rapidly increase in just 15 years.

Herring believes that quantifying the extreme heat-climate change connection could be a next step to making these types of analyses useful to society.

I don't think there is a lot of value from the perspective of decision makers to simply say climate changes impacted the risk of an extreme event,” Herring said. “But there’s a real opportunity to be able to deliver heat information in a more timely fashion.”


Wednesday, 22 July 2015

The growing el-Nino keeps pushing heat records

NOAA Shows June of 2015 Smashed All Prior Heat Records; El Nino Keeps Strengthening; Hothouse Mass Casualties Strike Europe, Japan
Under an oppressive human fossil fuel emission, the world just keeps getting hotter and hotter, the 2015-2016 El Nino just keeps looking ever more monstrous, and reports of tragic, heat-related, mass casualty events just keep rolling in.’


21 July, 2015


*   *   *   *
JULY 21, 2015: All the major climate monitors have now chimed in — NASA, Japan’s Meteorological Agency, NOAA. And June of 2015 is now marked as the hottest recorded in every single one. But of these, the NOAA measure, which provided its Global Analysis report yesterday, clearly is the starkest.

Showing extraordinary warming, June of 2015, according to NOAA, hit +0.88 C above the 20th Century average. That’s an excessive leap of +0.12 C over last year’s previous record June measure showing a +0.76 C global temperature departure and just 0.02 C behind the all-time monthly record values for any month hit just this year during February and March (+0.90 C).  When compared to 1880s averages, June was fully 1.08 C hotter. That’s more than halfway to the (not safe) 2 C threshold which IPCC has marked off as the point where catastrophic impacts from human caused climate change really start to hit high gear.


(On the up ramp to a hothouse. The NOAA global climate record for land and ocean temperatures over the last 136 years in which June of 2015 is now the all-time hottest. Image source: NOAA.)

We can clearly see the progress of rapid warming over the past 136 years in the above graph. Particularly since 1980 — when global temperatures really started to hit a rapid ramp up. Note that the mythological pause is not at all evident in the above graph. Global temperatures through June measures just kept driving on — higher and higher.

Back to Back Record Years on the Way — The Human Warming Escalator and The El Nino Jump

With all the June measures coming in so strongly on the hot side, and with the first half of this year already substantially warmer than the previous record warm year of 2014, it appears that we are locking in for back-to-back years of record heat. These new records are occurring in the context both of the larger, human-forced warming trend and as we hit the warm end of the global natural variability scale — El Nino.

It’s important to remember that the driver of these new records is the underlying accumulation of greenhouse gasses in the atmosphere. Deke Arndt, chief of the monitoring branch of NOAA’s National Centers for Environmental Information (NCEI), noted at a press conference last month:

Climate change is a long-term driver, so that’s like standing on an escalator as it goes up. So, the longer that we go into history, we’re riding up the escalator. And now that we’re getting an El Niño event, we happen to be jumping up at the same time, and so they play together to produce outcomes like what is likely to be the warmest year on record.”

And propelled by that human warming escalator, the current El Nino jump is starting to look absolutely savage.

El Nino Just Keeps Growing Stronger

For today’s Australia Bureau of Meteorology (BoM) report showed the current El Nino striking down yet another 1997 record. According to BoM findings, all key Nino ocean zones have shown surface temperatures in excess of 1 C above average for 10 successive weeks. This shatters the previous record duration for such an event — occurring in 1997 at 8 weeks in length. Notably, the current record heat build for Nino zones is still ongoing. So the new, 2015 record could extend further.

Overall, BoM shows the entire Eastern Equatorial Pacific now at +2 C. To get an idea what this looks like, we can take a peek at the Earth Nullschool sea surface temperature anomaly measure:


(The entire Northern, Eastern and Equatorial Pacific is exceedingly hot — showing anomalies in the +1 to +4 C range practically everywhere. Meanwhile, temperatures in the Central Pacific are starting to approach Super El Nino ranges. Image source: Earth Nullschool.)

Taking in this shot, it’s worth pausing for a moment to appreciate the fact that not only is the Equatorial Pacific outrageously hot, the entire Northern and Eastern Pacific from the Arctic on south is just off-the-charts hot. If you ever wondered what the emerging face of a Godzilla El Nino looks like, well, just remember this shot.

NOAA, meanwhile, shows El Nino continuing to extend its foray into strong event range. The critical Nino 3.4 measure of Central Pacific Ocean temperatures jumped again in the July 20 weekly report — hitting a +1.7 C anomaly. This is jump up from last week’s +1.5 C measure and is now knocking on the door to a super El Nino threshold of +1.8 C. NOAA’s three weekly reports for July now average +1.53 C for the Central Pacific — solidly in strong El Nino range for the month.

NOAA also began to track a third warm Kelvin Wave running across the Pacific. This Kelvin Wave is propagating eastward as a result of a strong West Wind Backburst that has blown over the Western Pacific throughout much of July. These winds are pushing warm surface waters down and under the Equatorial region. Ocean heat that will resurface off South American. Recharging already hot waters with a new hot influx and further strengthening an already strong El Nino.

The signal of this new warm water flood is now really starting to show up in the model runs. Corrected seasonal models now show an event in the range of 1997-1998. Uncorrected runs, including the Euro ensemble, continue to show potentials for an event that would make the 1997 Super El Nino look tiny by comparison.


(NOAA’s CFSv2 models still picking up a heat impact murmur of a monster El Nino in our near future. Image source: NOAA.)

Typically, El Nino reaches peak strength during Northern Hemisphere Fall and Winter. So we’re in a ramp-up phase that could last through October and November and we are already starting to hit strong event values in July. The current El Nino is predicted to remain a feature until late Winter or early Spring of 2016. Strongest global temperature heightening impacts come during and slightly after peak ocean warming due to El Nino. So the temperature records we’ve seen so far in 2014 and 2015 may just be prelude to the main event.

Heat Related Mass Casualties in Europe and Japan

It really is the kind of global heat spike that you don’t want to see. The kind that enables heatwaves to put droves of people into hospitals with life-threatening heat ailments. Earlier this summer, both India and Pakistan suffered mass casualty heatwave events. Instances that filled hospitals with tens of thousands of patients. In India, 2,500 souls were lost. In Pakistan, the number hit 1,242. These represent the 5th and 8th most deadly heatwaves on record, respectively.

Now, reports are starting to trickle in that Europe and Japan are suffering similar, although still somewhat less acute mass casualty events due to record heat. According to Dr. Jeff Masters, excess mortality due to heat had claimed more than 1,200 lives across Western Europe through early July. Meanwhile, reports are also starting to trickle in from Japan of heat related mass casualties. A report last week from Japan’s Fire and Disaster Management Agency found that 3,000 people had been admitted for heat stroke to hospitals across the island nation during the period of July 6 through 12.

Over the next few days, record-breaking heat is again expected to invade parts of southern Europe, setting the stage for more potential heat casualties.

Conditions in Context — Heat Breaking New Records Means More Extreme Weather

All time record high global temperatures for 2015 and likely at least a decent period during 2016 means we are also likely to continue to experience odd and severe weather conditions over many regions of the globe. A fact that was punctuated in Southern California earlier this week as the remnants of a tropical cyclone dumped 1.69 inches of rain — or more than ten times the amount of rainfall typical for July — over parts of San Diego through Monday. Possibly a taste of what’s to come for California should the currently building Godzilla-type El Nino — pumped up by a catastrophic rate of human greenhouse gas emission — crush the West Coast blocking pattern and hurl a barrage of powerful storms at the drought-parched state. A situation many may be hoping for at this time, but which they could easily come to regret as the extreme intensity of weather switches in the new climate age of 1 C warming start to become evident.

Links:

Hat Tip to Colorado Bob and Ryan in New England
Hat Tip to Andy in San Diego (How about that rain?)
Hat Tip to Matt


Thursday, 18 June 2015

Massive algal blooms

Hot Pacific Ocean Runs Bloody — Blob Now Features Record Red Tide

Red Tide. It’s what happens when massive algae blooms cover vast regions of ocean.
17 June, 2015

The biological density of the blooms is so great that they can paint the waters affected a shade of brown or red. A bloody color indicative of clouds of dangerous microbes just beneath the surface. And today, a massive Red Tide — perhaps the largest ever recorded — now stretches from California to Alaska along a vast stretch of the North American West Coast already reeling under the ongoing and dangerous impact of a massive ocean heating event that researchers have called ‘The Blob.’

Red Tide
(A Red Tide can paint the ocean in bloody shades as seen in the image above. It’s also bad news for many marine species — first due to production of deadly biotoxins and second due to its ability to rob ocean waters of oxygen as the bloom dies off and decays. Image source:Wind’s Sustainability Blog.)

A Red Tide has numerous impacts to both marine life and human industry. Microbes within the tide produce biotoxins that are deadly to marine species. Domoic acid, PSP and DSP are all toxins that have been identified during the current Red Tide event. The toxins primarily affect fish and marine mammals — risking mass fish and dolphin, sea lion, seal, otter, and whale deaths during widespread blooms. The toxins concentrate as they move up the food chain, making them most dangerous to top predators. Primary effects of the most lethal toxins are convulsions and paralysis. Other toxins cause nausea, cramps and diarrhea.
Human beings are also at risk and for this reason crab and shellfish fisheries all up and down the US West Coast are being closed. Impacts are so widespread marine ecologists like Vera Trainer, manager of the Marine Microbes and Toxins Programs at the Northwest Fisheries Science Center in Seattle, are calling the event unpredented:
The fact that we’re seeing multiple toxins at the same time, we’re seeing high levels of domoic acid, and we’re seeing a coastwide bloom — those are indications that this is unprecedented.”
Global Warming, Hot Blob — Prime Suspects

Scientists currently suspect extreme Northeastern Pacific Ocean heat led to the sudden appearance of Red Tide this week — a combination of warm and nutrient rich waters are well known to be the key ingredients for Red Tide formation. Ingredients that are increasingly prevalent due to human fossil fuel burning. Ingredients that are increasingly evident in the Northeastern Pacific. In short the burning of fossil fuels both warms the atmosphere and ocean even as it seeds the surface water with nitrogen. The warm water is a preferred environment for the microbes that form the Red Tide and the nitrogen — both as a constant rain from the sky due to fossil fuel emission and as effluent from streams due to farm runoff — essentially fertilizes the bloom.

image
(The Northeastern Pacific hot Blob now features a dangerous Red Tide — perhaps the largest and most toxin laden Red Tide ever seen. Image source: Earth Nullschool.)

Warming the world ocean through human carbon emissions is thus a very dangerous consequence. Now, more and more regions are featuring hot zones that are increasingly deadly to sea life. This region of the Northeast Pacific in particular has seen a number of instances of mass ocean creature death due to impacts associated with warming waters. The recent Red Tide being the last of a long chain including a mass starfish die-off, fish kills, bird kills, and marine mammal deaths and disruption — including a winter and spring emergence of crowds of starving sea lion pups along California beaches.

Next Step — Anoxia, Possible Hydrogen Sulfide Issue

This particular Red Tide is still in its early stages. It could last for weeks. But as it reaches its last days, the mass production of microbial life will rob the ocean surface of the nutrients necessary to sustain it. As this happens, the microbes will experience a sudden die-off. The mass of dead microbes will then sink and decay. This decay will further rob already de-oxygenated waters, particularly off Washington and Seattle, of still more oxygen. So the final act of this particular Red Tide will be to make a bad ocean water oxygen situation in many of the affected regions even worse (in the worst case potentially setting some zones up for an ugly deep water hydrogen sulfide production).

Links:
Hat Tip to Andy in San Diego


Saturday, 13 June 2015

Robertscribbler writes on the growing el-Nino

2014-2015 El Nino Already Most Intense Since 1997-1998, Long Range Model Guidance Shows Strong-to-Monstrous Potential


12 June, 2015
It all started with a powerful Springtime Kelvin Wave. A trans-ocean telegraphing of heat that signaled the ramp-up toward El Nino during 2014. Heat spread out over the ocean surface and just beneath, but a failure of the atmosphere to respond to this forcing meant only the emergence of a weak El Nino by early 2015. At that time, it looked as if the El Nino could fade, adding to a long list of other weak-to-moderate events since the record-shattering years of 1997-1998.
But extraordinary westerly winds developed over the Western Pacific during late Winter and re-emerged through Spring. As a result, warm waters again gathered in an eastward surge across the Pacific — a Kelvin Wave more powerful than even the intense 2014 event.
Monster Kelvin Wave 2015
(The Spring Kelvin Wave remains very hot into early June, showing some reinvigoration due to atmospheric feedbacks. Image source: NOAA’s Climate Prediction Center.)

By April and May it had flooded into a warm pool off the West Coast of South America, pushing surface waters into the peak values of 3-4 Celsius above average temperatures, while 5-6 C + above average temperatures lurked just below the surface.
By June, the Kelvin Wave had re-intensified even as it rebounded a bit off South America. Meanwhile, ocean surface heating continued to ramp up. By June 8, temperatures in the Central Pacific Nino 3.4 zone had hit a +1.2 C anomaly — already entering moderate El Nino range. Meanwhile, NOAA’s multivariate ENSO index showed that by June 4 the 2014-2015 El Nino was now stronger than any event since 1997-1998 with overall departures now exceeding the +1.5 C range. Such a departure marks a foray into strong El Nino territory:
Multivariate ENSO Index
(2014-2015 El Nino creeps into strong range exceeding all previous Equatorial Pacific warming events since 1997-1998. Image source: NOAA’s Earth Systems Research Lab.)

It’s important to note that models have very high uncertainty during the Spring due to a tendency of summer patterns to tamp down El Nino intensification. However, cloudiness has built and persisted over a broad band of the Equatorial Pacific — a factor spurring the most intense early season tropical cyclone development the Northern Hemisphere has ever seen. In addition, atmospheric wind patterns have continued to support El Nino strengthening. This continued pattern yesterday led WeatherUnderground blogger Bob Henson to this summation:
This time, the atmosphere and ocean are much more in sync, so we can put more trust in the current model outlooks—especially now that we’re past the spring predictability barrier” that makes early-year forecasts of El Niño so tough. In today’s update, NOAA is calling for a greater than 90% chance that El Niño will continue through the northern fall of 2015, and around an 85% chance it will last through the winter of 2015-16.

Should El Nino start to peter out now, we’d be looking at something perhaps a bit stronger than the 2009-2010 event. But given the above trends, El Nino is still strengthening. A fact confirmed by forecast model runs that continue to show potential for a strong to potentially record-shattering event come Fall of 2015.
enso-outlook-bom-may15
(Australian Bureau of Meteorology shows model runs predicting a strong to record shattering El Nino by October of 2015. Image source: BOM.)

All long range models now show Nino 3.4 sea surface temperatures predicted to hit between 1.5 and 3.0 C above base-line levels by October. Model averages now show a 2.4 C departure for all the major runs. Such an event would be extraordinary — equaling or exceeding the 1997-1998 El Nino (which topped off at 2.2 C above average in the three month measure).
All this information generates a clear picture of a still intensifying El Niño. One that has an increasing potential to develop into a real beast come Fall. As a result, we can expect continued global record hot temperatures to continue, as El Nino combines with an egregious human fossil fuel burning to shove global temperatures into ever-more-dangerous ranges. In addition, storm track intensification come Fall could be quite extreme when one considers both the possible strength of El Nino and the powerful atmospheric moisture loading due to a ramp up of temperatures into the range of +0.95 C above 1880s averages.
Links:
Hat Tip to Colorado Bob

(Please support the public climate tracking efforts of NOAA and BOM, without which many of these reports would not be possible)


Whilst I cannot fault his climate science I cannot go along with the contention that the die-off of life in the Pacific is solely due to the warming ocean, and not due to Fukushima. Similarly, I cannot hold with the few that it is due to radiation and not climate change. 


This is a perfect storm. With the coming together of factors we can safely say the Pacific is dead.

Climate Change’s ‘Blob’ Heats Up In Northeast Pacific


11 June, 2015
They call it The Blob. No, it’s not some campy 1950s horror flick featuring a gelatinous monstrosity from space aimed at devouring all life in its path. This Blob is a pool of much hotter than normal water that has become increasingly entrenched in the North-East Pacific. A surface zone of record ocean warmth that has persisted and intensified in the same region for the better part of two years.
Though it’s not the sci-fi movie Blob, this particular climate change monstrosity could well be described as stranger than fiction. It’s an ocean feature of the Ridiculously Resilient Ridge which has warded storms off the North American West Coast over the past couple of years. A likely upshot of an ongoing Arctic heating — setting off weather conditions that sparked both this year’s massive Northwest Territory Wildfires and the worst drought the California region has seen in at least 1,000 years. And like the sci-fi movie space monster of yore, the Northeast Pacific heat Blob has a nasty penchant for devouring ocean life of all kinds.
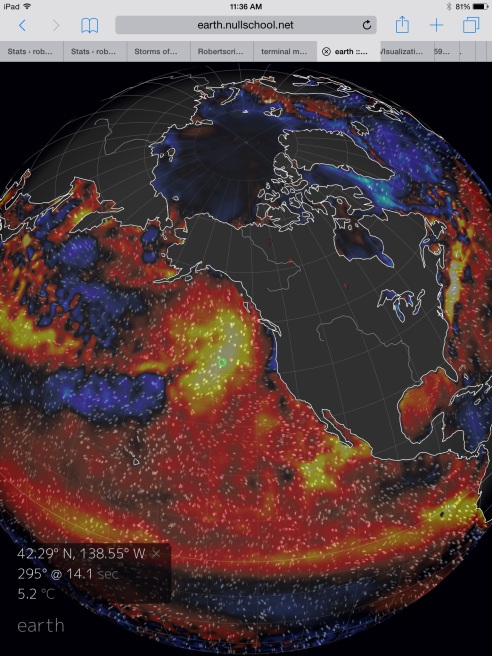
image
(Under an ongoing El Nino, the Equatorial Pacific is getting pretty hot with temperature spikes ranging from +2.5 C above normal temperatures at mid-ocean to +4 C above average off the West Coast of South America. But these rather warm temperature anomalies are nothing compared to The Blob [at center frame above] which now features temperatures in the range of +5 C above average. Image source: Earth Nullschool.)

The news about The Blob today comes in two forms — bad and worse. The bad news is that it’s still there. Still influencing our weather, still threatening sea life and fisheries. And the worse news is that it appears to be heating up. Today’s readings put much of The Blob in the 3.5 to 5.5 C above average temperature range, which is 1.5 to 2 degrees Celsius warmer than we’ve seen in this zone since its first heat intensification during the spring of 2014.
Wonky Weather

Back in April, a study published in Geophysical Research Letters and reported in LiveScience found that temperatures over a broad region of Northeast Pacific surface waters had averaged between 1-4 C (2 to 7 F) above normal temperatures.  It covered an area roughly 1,000 miles in diameter and extended about 300 feet below surface waters.

Nick Bond, one of the study’s co-authors (and coiner of the term ‘Blob’), had this statement for the American Geophysical Union:
In the fall of 2013 and early 2014 we started to notice a big, almost circular mass of water that just didn’t cool off as much as it usually did, so by spring of 2014 it was warmer than we had ever seen it for that time of year.”
WarmBlob_April2014_NOAA-2
(Warm Blob T anomalies for April of 2014 as provided by NOAA and AGU. Note that today’s anomalies are well in excess of April 2014 readings.)

The Blob’s large size combined with its failure to cool in spring to set off some rather strange weather impacts, according to the report’s findings. Winds blowing over high heat content ocean waters ran inland over the US and Canadian West Coasts. This invasion pushed warm air over lands and mountains. Snowpacks melted, lands warmed and dried out. Massive wildfires erupted thoughout both the US and Canada.
The hot air mass over the warm water blob has acted as a brutish atmospheric feature since this time. Like a towering wall of air it has consistently deflected oncoming storms that typically charge across the Pacific During Winter and Spring — reinforcing a weird extreme weather regime.
Threat to Sea Life

The AGU report also cited recent severe impacts to sea life as found in a March 17 study by NOAA. Highlights of the NOAA study showed substantial ocean life impacts including weaker copopod production in the warming waters, likely less vital salmon fisheries, bird deaths, marine mammal deaths and starving sea lions due to scarcity of food sources. In addition, the warm temperatures have been linked to a starfish wasting sickness that has killed off millions of sea stars up and down the North American West Coast.

What the NOAA report did not include was growing evidence that warming waters off the US West Coast have (when combined with eutriphication due to atmospheric nitrogen seeding through fossil fuel burning and farm nutrient runoff), since the early 2000s, resulted in increasingly dangerous low ocean oxygen levels (see Starving Sea Lion Pups and Liquified Starfish). It’s a one-two warming and oxygen loss that is pretty amazingly dangerous to ocean life.

The NOAA study further noted that the high sea surface temperatures spurring these impacts were at or near unprecedented levels, a confirmation of the AGU report findings:
We are in some ways entering a situation we haven’t seen before,” said Cisco Werner, Director of the Southwest Fisheries Science Center in La Jolla, Calif. “That makes it all the more important to look at how these conditions affect the entire ecosystem because different components and different species may be affected differently.”

PDO and Climate Change Not Helping

The current unprecedented warm temperatures in The Blob are, in part, an upshot of a warmer sea surface state now in effect called positive Pacific Decadal Oscillation (PDO). During these times, Pacific Ocean waters tend to be warmer — especially in the region where the Blob has recently emerged. During December of 2014, PDO hit new all-time record high values — an extreme likely pushed over the top by added atmospheric and ocean heating through human greenhouse gas emissions.
During positive PDO periods, El Nino events both tend to be more prevalent and show higher intensity. And during spring and summer El Ninos, we tend to see increased warming of the Pacific region now dominated by The Blob.
image
(A powerful blocking pattern associated with The Blob remains in place today. Image source:Earth Nullschool.)

All these PDO based fluxes are natural variability related. But the real kicker, the icing on the cake of this extreme event is almost certainly climate change. Specifically for the hot Blob zone, general greenhouse gas warming of the adjacent Arctic called Polar Amplification has tended to generate a weakness in the Jet Stream directly over the region. This weakness has tended to aid in Ridiculously Resilient Ridge development and the month on month, year on year heatwaves that have pushed ocean temperatures in this zone into ever more extreme hot values (see Dr. Francis’s “Weird Weather Plot Thickens As Arctic Swiftly Warms“). And though overall global warming now in the range of +0.95 C above 1880s values has also likely contributed in a broader sense, the direct impact to the Arctic has likely aided in the development of a high anomaly heat spike for this particular ocean one.

So, in total, we have a number of factors pushing record ocean warmth in this region, setting the stage for sea creature death and wrecked North American weather alike. But the primary contributor to these unsettling events is almost certainly climate change. For its influences have made possible the new levels of extreme conditions which we are now experiencing.
Links: