

May 2018 was the 3rd warmest on record globally - @CopernicusECMWF analysis (ERA-Interim). Temperatures in Europe were the warmest on record! Cooler conditions particularly found from the Hudson Bay to Greenland.
For more information: http://climate.copernicus.eu/resources/data-analysis/average-surface-air-temperature-analysis/monthly-maps/surface-air-8 …
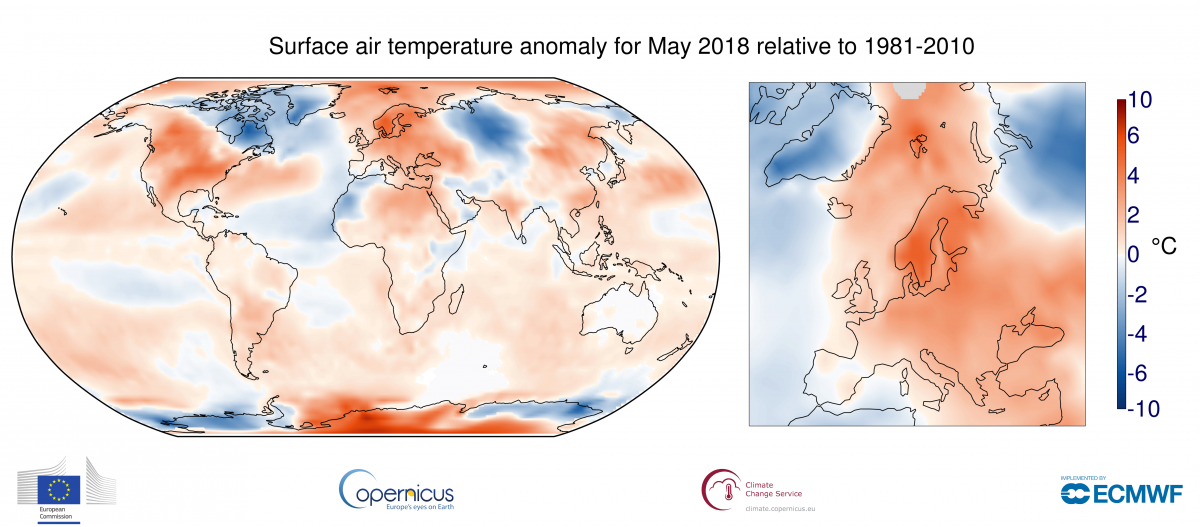
Surface air temperature for May 2018

5
June, 2018
May
2018 was warmer than the 1981-2010 average over most of Europe. It
was particularly warm in the north of the continent, especially in
Norway and Sweden. The 16.1 °C monthly average of temperatures
measured in Oslo was the highest ever recorded for a Norwegian
weather station in May, and 5.3°C higher than the 1961-1990 average
for the station. The maximum temperature of 31.1°C recorded in
Gothenburg on 30 May is the highest May value in the station record,
which dates back to 1859. It is also the warmest May temperature
recorded in Sweden in more than 100 years. Neighbouring countries
also experienced record warm temperatures. Only the Iberian Peninsula
(with Corsica and Sardinia) and eastern European Russia had
temperatures around or below normal.
Temperatures
were also well above the 1981-2010 average over much of western
Canada and the USA, and parts of Antarctica. Most of the Arctic Ocean
was also warmer than average: May was not as anomalously warm as
April in the vicinity of the Bering Strait, but temperatures reverted
from below- to above-average in the European sector. The month was
also unusually warm over north-eastern Africa, parts of southern and
eastern Asia, and over the southern half of South America.
Conversely,
May 2018 was considerably colder than average over north-eastern
Canada, Greenland, western Russia, north-western Africa and parts of
Antarctica.
Marine
air temperatures were close to normal over the eastern tropical
Pacific, following relatively cool La Niña conditions in preceding
months. It was predominantly warmer than average over the
extratropical Pacific Ocean to the north and south, and much above
average over the Pacific and Atlantic Oceans to the east of Japan and
the USA respectively. It was mainly warmer than average over the
South Atlantic and Indian Oceans. Temperatures were distinctly below
average over other parts of the Atlantic, and a little below average
over a number of other oceanic areas.

Surface
air temperature anomaly averaged from June 2017 to May 2018 relative
to the average for 1981-2010. Source: ERA-Interim. (Credit: ECMWF,
Copernicus Climate Change Service)
Average
temperatures for the twelve-month period from June 2017 to May 2018
were:
- most above the 1981-2010 average in the Arctic;
- above average over most of Europe, but below average over Ireland, Scotland and parts of Norway and Sweden;
- well above average over the Middle East;
- predominantly above average over other areas of land and ocean;
- below average over a few land and oceanic areas, including the equatorial eastern Pacific Ocean, where La Niña conditions predominated, and parts of the Antarctic.

Monthly
global-mean and European-mean surface air temperature anomalies
relative to 1981-2010, from January 1979 to May 2018. The darker
coloured bars denote the May values. Source: ERA-Interim. (Credit:
ECMWF, Copernicus Climate Change Service)
The
global temperature for May 2018 was well above average. Although not
as exceptional as the values for May 2016 and May 2017, it was in
line with the upward trend of 0.18°C per decade seen in global
temperature data from 1979 onwards. May in 2018 was:
- 0.4°C warmer than the average May from 1981-2010;
- the third warmest May on record, though only a little warmer than May 2010;
- about 0.2°C cooler than the warmest May, which occurred in 2016.
- The warmest and second-warmest instances of each month of the year occur between October 2015 and December 2017.
The
largest anomalies in European-average temperatures occur in
wintertime, when values can vary substantially from month to month.
Following below-average European temperatures in February and March,
April 2018 became by a clear margin the warmest April on record. May
2018 has likewise become by far the warmest May on record. The
European-average anomaly is 2.5°C for May 2018; this compares with
1.6°C for May 2003, the second warmest May on record.

Running
twelve-month averages of global-mean and European-mean surface air
temperature anomalies relative to 1981-2010, based on monthly values
from January 1979 to May 2018. The darker coloured bars are the
averages for each of the calendar years from 1979 to 2017. Source:
ERA-Interim. (Credit: ECMWF, Copernicus Climate Change Service)
Averaging
over twelve-month periods smooths out the shorter-term variations.
Globally, the twelve-month period from June 2017 to May 2018 was
0.46°C warmer than the 1981-2010 average. The warmest twelve-month
period was from October 2015 to September 2016, with a temperature
0.64°C above average. 2016 is the warmest calendar year on record,
with a global temperature 0.62°C above that for 1981-2010. The
second warmest calendar year, 2017, had a temperature 0.53°C above
average.
The
spread in the global averages from various temperature datasets has
been unusually large over the past two years or so. This is due
partly to differences in the extent to which datasets represent the
relatively warm conditions that have predominated over the Arctic and
the seas around Antarctica. Differences in estimates of sea-surface
temperature elsewhere have been a further factor. Spread is also
large for the years 2005 and 2006, for which the values shown here
are relatively high and expected to be reduced when production of an
updated dataset has been completed. Nevertheless, there is general
agreement between datasets regarding:
- the exceptional warmth of 2016, and to a lesser extent 2017 and 2015
- the overall rate of warming since the late 1970s;
- the sustained period of above-average temperatures from 2001 onwards.
There
is more variability in average European temperatures, but values are
less uncertain because observational coverage of the continent is
relatively dense. Twelve-month averages for Europe were at a high
level from 2014 to 2016. They then fell, but have remained 0.5°C or
more above the 1981-2010 average. The average from June 2017 to May
2018 exceeded the 1981-2010 average by 0.9°C. The warmest
twelve-month period occurred from July 2006 to June 2007, when the
average temperature was about 1.5°C above that for 1981-2010.
The
average surface air temperature analysis homepage explains
more about the production and reliability of the values presented
here.
No comments:
Post a Comment
Note: only a member of this blog may post a comment.