https://www.theguardian.com/environment/2019/nov/27/climate-emergency-world-may-have-crossed-tipping-points
Climate tipping points
— too risky to bet
against
The growing threat of abrupt and irreversible climate changes must compel political and economic action on emissions.Timothy M. Lenton,
Johan Rockström,
Owen Gaffney,
Stefan Rahmstorf,
Katherine Richardson,
Will Steffen &
Hans Joachim Schellnhuber

27
November, 2019
Politicians,
economists and even some natural scientists have tended to assume
that tipping points1 in the Earth system — such as the loss of the
Amazon rainforest or the West Antarctic ice sheet — are of low
probability and little understood. Yet evidence is mounting that
these events could be more likely than was thought, have high impacts
and are interconnected across different biophysical systems,
potentially committing the world to long-term irreversible changes.
Here
we summarize evidence on the threat of exceeding tipping points,
identify knowledge gaps and suggest how these should be plugged. We
explore the effects of such large-scale changes, how quickly they
might unfold and whether we still have any control over them.
In
our view, the consideration of tipping points helps to define that we
are in a climate emergency and strengthens this year’s chorus of
calls for urgent climate action — from schoolchildren to
scientists, cities and countries.
The
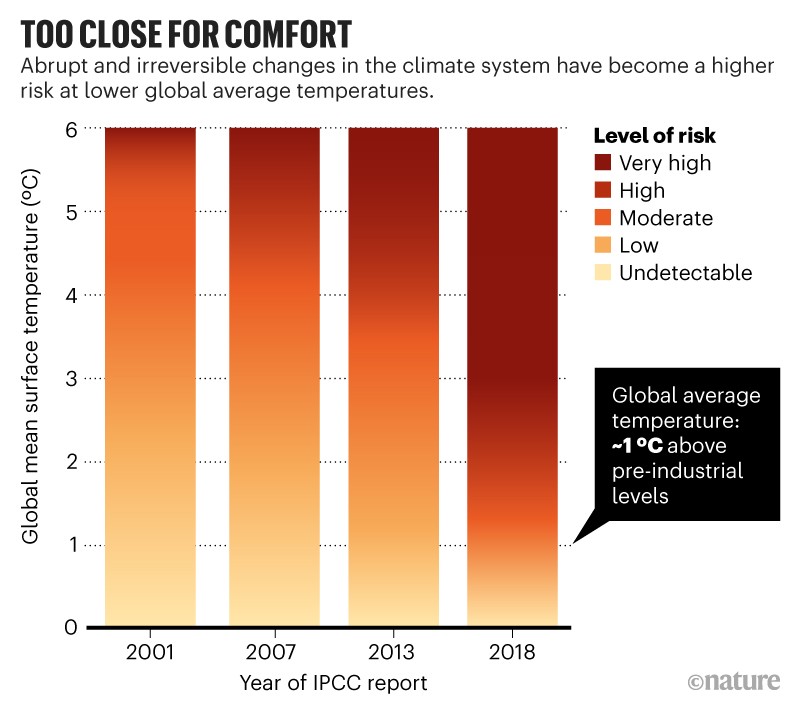
Intergovernmental Panel on Climate Change (IPCC) introduced the idea
of tipping points two decades ago. At that time, these ‘large-scale
discontinuities’ in the climate system were considered likely only
if global warming exceeded 5 °C above pre-industrial levels.
Information summarized in the two most recent IPCC Special Reports
(published in 2018 and in September this year)2,3 suggests that
tipping points could be exceeded even between 1 and 2 °C of
warming (see ‘Too close for comfort’).

Source:
IPCC
If
current national pledges to reduce greenhouse-gas emissions are
implemented — and that’s a big ‘if’ — they are likely to
result in at least 3 °C of global warming. This is despite the
goal of the 2015 Paris agreement to limit warming to well below 2 °C.
Some economists, assuming that climate tipping points are of very low
probability (even if they would be catastrophic), have suggested that
3 °C warming is optimal from a cost–benefit perspective.
However, if tipping points are looking more likely, then the ‘optimal
policy’ recommendation of simple cost–benefit climate-economy
models4 aligns with those of the recent IPCC report2. In other words,
warming must be limited to 1.5 °C. This requires an emergency
response.
Ice
collapse
We
think that several cryosphere tipping points are dangerously close,
but mitigating greenhouse-gas emissions could still slow down the
inevitable accumulation of impacts and help us to adapt.
Research
in the past decade has shown that the Amundsen Sea embayment of West
Antarctica might have passed a tipping point3: the ‘grounding line’
where ice, ocean and bedrock meet is retreating irreversibly. A model
study shows5 that when this sector collapses, it could destabilize
the rest of the West Antarctic ice sheet like toppling dominoes —
leading to about 3 metres of sea-level rise on a timescale of
centuries to millennia. Palaeo-evidence shows that such widespread
collapse of the West Antarctic ice sheet has occurred repeatedly in
the past.
The
latest data show that part of the East Antarctic ice sheet — the
Wilkes Basin — might be similarly unstable3. Modelling work
suggests that it could add another 3–4 m to sea level on
timescales beyond a century.
The
Greenland ice sheet is melting at an accelerating rate3. It could add
a further 7 m to sea level over thousands of years if it passes a
particular threshold. Beyond that, as the elevation of the ice sheet
lowers, it melts further, exposing the surface to ever-warmer air.
Models suggest that the Greenland ice sheet could be doomed at 1.5 °C
of warming3, which could happen as soon as 2030.
Thus,
we might already have committed future generations to living with
sea-level rises of around 10 m over thousands of years3. But that
timescale is still under our control. The rate of melting depends on
the magnitude of warming above the tipping point. At 1.5 °C, it
could take 10,000 years to unfold3; above 2 °C it could take less
than 1,000 years6. Researchers need more observational data to
establish whether ice sheets are reaching a tipping point, and
require better models constrained by past and present data to resolve
how soon and how fast the ice sheets could collapse.
Whatever
those data show, action must be taken to slow sea-level rise. This
will aid adaptation, including the eventual resettling of large,
low-lying population centres.
A
further key impetus to limit warming to 1.5 °C is that other
tipping points could be triggered at low levels of global warming.
The latest IPCC models projected a cluster of abrupt shifts7 between
1.5 °C and 2 °C, several of which involve sea ice. This ice is
already shrinking rapidly in the Arctic, indicating that, at 2 °C
of warming, the region has a 10–35% chance3 of becoming largely
ice-free in summer.
Biosphere
boundaries
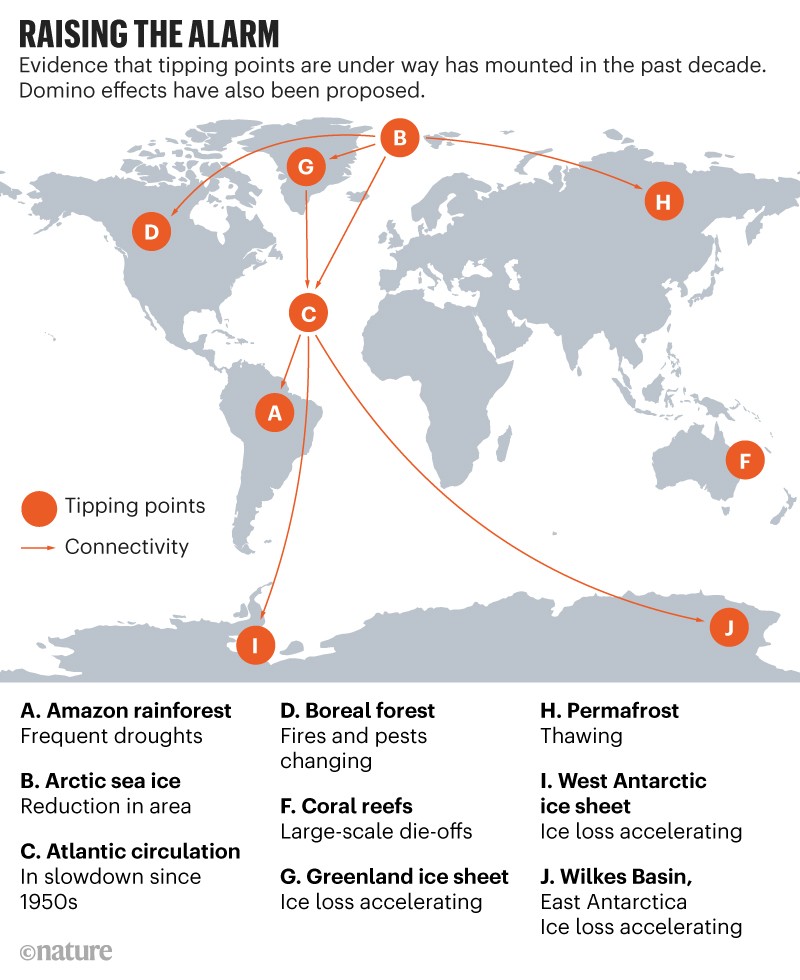
Climate
change and other human activities risk triggering biosphere tipping
points across a range of ecosystems and scales (see ‘Raising the
alarm’).

Source:
T. M. Lenton et al.
Ocean
heatwaves have led to mass coral bleaching and to the loss of half of
the shallow-water corals on Australia’s Great Barrier Reef. A
staggering 99% of tropical corals are projected2 to be lost if global
average temperature rises by 2 °C, owing to interactions between
warming, ocean acidification and pollution. This would represent a
profound loss of marine biodiversity and human livelihoods.
As
well as undermining our life-support system, biosphere tipping points
can trigger abrupt carbon release back to the atmosphere. This can
amplify climate change and reduce remaining emission budgets.
Deforestation
and climate change are destabilizing the Amazon — the world’s
largest rainforest, which is home to one in ten known species.
Estimates of where an Amazon tipping point could lie range from 40%
deforestation to just 20% forest-cover loss8. About 17% has been lost
since 1970. The rate of deforestation varies with changes in policy.
Finding the tipping point requires models that include deforestation
and climate change as interacting drivers, and that incorporate fire
and climate feedbacks as interacting tipping mechanisms across
scales.
With
the Arctic warming at least twice as quickly as the global average,
the boreal forest in the subarctic is increasingly vulnerable.
Already, warming has triggered large-scale insect disturbances and an
increase in fires that have led to dieback of North American boreal
forests, potentially turning some regions from a carbon sink to a
carbon source9. Permafrost across the Arctic is beginning to
irreversibly thaw and release carbon dioxide and methane — a
greenhouse gas that is around 30 times more potent than CO2 over a
100-year period.
Researchers
need to improve their understanding of these observed changes in
major ecosystems, as well as where future tipping points might lie.
Existing carbon stores and potential releases of CO2 and methane need
better quantification.
The
world’s remaining emissions budget for a 50:50 chance of staying
within 1.5 °C of warming is only about 500 gigatonnes (Gt) of
CO2. Permafrost emissions could take an estimated 20% (100 Gt CO2)
off this budget10, and that’s without including methane from deep
permafrost or undersea hydrates. If forests are close to tipping
points, Amazon dieback could release another 90 Gt CO2 and boreal
forests a further 110 Gt CO211. With global total CO2 emissions
still at more than 40 Gt per year, the remaining budget could be
all but erased already.

A
diver observes major bleaching on the coral reefs of Society Islands,
French Polynesia.
Global
cascade
In
our view, the clearest emergency would be if we were approaching a
global cascade of tipping points that led to a new, less habitable,
‘hothouse’ climate state11. Interactions could happen through
ocean and atmospheric circulation or through feedbacks that increase
greenhouse-gas levels and global temperature. Alternatively, strong
cloud feedbacks could cause a global tipping point12,13.
We
argue that cascading effects might be common. Research last year14
analysed 30 types of regime shift spanning physical climate and
ecological systems, from collapse of the West Antarctic ice sheet to
a switch from rainforest to savanna. This indicated that exceeding
tipping points in one system can increase the risk of crossing them
in others. Such links were found for 45% of possible interactions14.
In
our view, examples are starting to be observed. For example, Arctic
sea-ice loss is amplifying regional warming, and Arctic warming and
Greenland melting are driving an influx of fresh water into the North
Atlantic. This could have contributed to a 15% slowdown15 since the
mid-twentieth century of the Atlantic Meridional Overturning
Circulation (AMOC) , a key part of global heat and salt transport by
the ocean3. Rapid melting of the Greenland ice sheet and further
slowdown of the AMOC could destabilize the West African monsoon,
triggering drought in Africa’s Sahel region. A slowdown in the AMOC
could also dry the Amazon, disrupt the East Asian monsoon and cause
heat to build up in the Southern Ocean, which could accelerate
Antarctic ice loss.
The
palaeo-record shows global tipping, such as the entry into ice-age
cycles 2.6 million years ago and their switch in amplitude and
frequency around one million years ago, which models are only just
capable of simulating. Regional tipping occurred repeatedly within
and at the end of the last ice age, between 80,000 and 10,000 years
ago (the Dansgaard–Oeschger and Heinrich events). Although this is
not directly applicable to the present interglacial period, it
highlights that the Earth system has been unstable across multiple
timescales before, under relatively weak forcing caused by changes in
Earth’s orbit. Now we are strongly forcing the system, with
atmospheric CO2 concentration and global temperature increasing at
rates that are an order of magnitude higher than those during the
most recent deglaciation.
Atmospheric
CO2 is already at levels last seen around four million years ago, in
the Pliocene epoch. It is rapidly heading towards levels last seen
some 50 million years ago — in the Eocene — when temperatures
were up to 14 °C higher than they were in pre-industrial times. It
is challenging for climate models to simulate such past ‘hothouse’
Earth states. One possible explanation is that the models have been
missing a key tipping point: a cloud-resolving model published this
year suggests that the abrupt break-up of stratocumulus cloud above
about 1,200 parts per million of CO2 could have resulted in roughly
8 °C of global warming12.
Some
early results from the latest climate models — run for the IPCC’s
sixth assessment report, due in 2021 — indicate a much larger
climate sensitivity (defined as the temperature response to doubling
of atmospheric CO2) than in previous models. Many more results are
pending and further investigation is required, but to us, these
preliminary results hint that a global tipping point is possible.
To
address these issues, we need models that capture a richer suite of
couplings and feedbacks in the Earth system, and we need more data —
present and past — and better ways to use them. Improving the
ability of models to capture known past abrupt climate changes and
‘hothouse’ climate states should increase confidence in their
ability to forecast these.
Some
scientists counter that the possibility of global tipping remains
highly speculative. It is our position that, given its huge impact
and irreversible nature, any serious risk assessment must consider
the evidence, however limited our understanding might still be. To
err on the side of danger is not a responsible option.
If
damaging tipping cascades can occur and a global tipping point cannot
be ruled out, then this is an existential threat to civilization. No
amount of economic cost–benefit analysis is going to help us. We
need to change our approach to the climate problem.
Act
now
In
our view, the evidence from tipping points alone suggests that we are
in a state of planetary emergency: both the risk and urgency of the
situation are acute (see ‘Emergency: do the maths’).
EMERGENCY:
DO THE MATHS
We
define emergency (E) as the product of risk and urgency. Risk (R) is
defined by insurers as probability (p) multiplied by damage (D).
Urgency (U) is defined in emergency situations as reaction time to an
alert (τ) divided by the intervention time left to avoid a bad
outcome (T). Thus:
E
= R × U = p × D × τ / T
The
situation is an emergency if both risk and urgency are high. If
reaction time is longer than the intervention time left (τ / T > 1),
we have lost control.
We
argue that the intervention time left to prevent tipping could
already have shrunk towards zero, whereas the reaction time to
achieve net zero emissions is 30 years at best. Hence we might
already have lost control of whether tipping happens. A saving grace
is that the rate at which damage accumulates from tipping — and
hence the risk posed — could still be under our control to some
extent.
The
stability and resilience of our planet is in peril. International
action — not just words — must reflect this.
Nature
575, 592-595 (2019)
doi:
10.1038/d41586-019-03595-0
References
Lenton,
T. M. et al. Proc. Natl Acad. Sci. USA 105, 1786–1793 (2008).
IPCC.
Global Warming of 1.5°C (IPCC, 2018).
IPCC.
IPCC Special Report on the Ocean and Cryosphere in a Changing Climate
(IPCC, 2019).
Cai,
Y., Lenton, T. M., & Lontzek, T. S. Nature Clim. Change 6,
520–525 (2016).
Feldmann,
J. & Levermann, A. Proc. Natl Acad. Sci. USA 112, 14191–14196
(2015).
.
Aschwanden,
A. et al. Sci. Adv. 5, eaav9396 (2019).
Drijfhout,
S. et al. Proc. Natl Acad. Sci. USA 112, E5777–E5786 (2015).
Lovejoy,
T. E. & Nobre, C. Sci. Adv. 4, eaat2340 (2018).
Walker,
X. J. et al. Nature 572, 520–523 (2019).
Rogelj,
J., Forster, P. M., Kriegler, E., Smith, C. J. & Séférian, R.
Nature 571, 335–342 (2019).
.
Steffen,
W. et al. Proc. Natl Acad. Sci. USA 115, 8252–8259 (2018).
Schneider,
T., Kaul, C. M. & Pressel, K. G. Nature Geosci. 12, 163–167
(2019).
.
Tan,
I., Storelvmo, T. & Zelinka, M. D. Science 352, 224–227 (2016).
Rocha,
J. C., Peterson, G., Bodin, Ö. & Levin, S. Science 362,
1379–1383 (2018).
Caesar,
L., Rahmstorf, S., Robinson, A., Feulner, G. & Saba, V. Nature
556, 191–196 (2018).


No comments:
Post a Comment
Note: only a member of this blog may post a comment.