

This paper has just
come out from Andrew Glikson who recently appeared on Nature Bats
Last with Kevin Hester
Onset
Of Climate Tipping Points
Andrew
Glikson,
Earth and paleoclimate scientist,
Australian National University
Countercurrents,
1 March, 2018
1 March, 2018
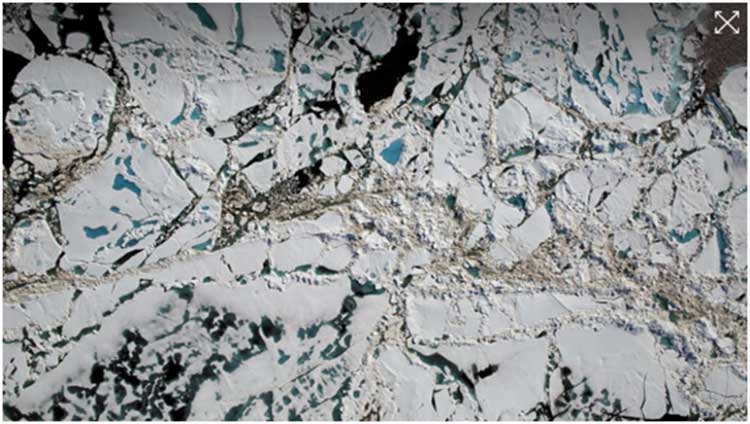
Arctic
ice breakdown
As
is well known to students of the history of the climate, once a
temperature threshold is breached, abrupt events follow due to
amplifying feedbacks, even within a few years, examples being (1)
stadial[i] freeze
events which followed temperature peaks during past interglacial
peaks due to influx of cold ice-melt water into the north Atlantic
Ocean[ii];
(2) the Dansgaard–Oeschger warming events[iii] during
the last glacial period; (3) the Younger dryas stadial freeze
(12,800–11,600 years- ago[iv])
and the Laurentian stadial freeze[v] (8200
years-ago). In some instances it only took a temperature rise of
about 1-2 degrees Celsius to trigger extensive ice melt, a flow of
cold melt water into the oceans and thereby a regional to global
freeze event, over periods ranging from a millennium to a few
centuries. The abrupt transitions into and from stadial conditions
could occur over a few decades and even few years[vi]
Lenton
(2012) in an article titled “Arctic
climate tipping points“[vii] wrote
“There is widespread concern that anthropogenic global warming will
trigger Arctic climate tipping points. The Arctic has a long history
of natural, abrupt climate changes, which together with current
observations and model projections, can help us to identify which
parts of the Arctic climate system might pass future tipping points …
Looking ahead, a range of potential tipping phenomena are described.”
The
last significant Arctic ice loss occurred in the Eemian interglacial
around 125 thousand years ago when summer insolation in the Arctic
climate increased by 11–13% causing a seasonal loss of Arctic
sea-ice, northward advance of tree lines on land, and a substantial
of the Greenland ice sheet (Brigham-Grette 2009[viii]).
Arctic
climate tipping points are manifest, as indicated below
- As temperature rise has exceeded 1.2 degrees Celsius above 1880 temperatures (Figure 1), sharp reductions of Arctic sea ice occur (Figures 2 and 3);
- As the ice melts near-total reflection of solar radiation by ice is in replaced by absorption of infrared radiation by open water;
- The flow of ice-melt water from the Greenland glaciers creates a large pool of cold water in the North Atlantic Ocean (Figure 4); a similar effect takes place in West Antarctica.
- The cold water region south of Greenland aborts northward flow of the thermohaline Atlantic Meridional Ocean Circulation (AMOC), leading to cooling of the North Atlantic and adjacent North America and Europe;
- Increased evaporation over the warming Arctic Ocean results in build-up of masses of cold and moist air;
- Winter cold extremes linked to high-altitude polar vortex weaken the boundary between the polar stratosphere and mid-latitude stratosphere atmosphere,allowing penetration of cold fronts southward into Siberia and North America[ix]. These weak states have increased over the past four decades, ensuing in cold winters in Russia and Europe.
- These transient and regional cooling to freezing events, which severely damage agriculture over large regions of Europe[x] and North America, may become more frequent with time, heralding a longer regional freeze events, while the continuing accumulation of CO2 in the atmosphere warms other parts of the Earth.
- The abortion of northward flow of warm water pools which form in tropical regions, such as the Gulf of Mexico, results in their further warming, producing temperature polarities between north cold fronts and tropical warm regions, ensuing in storms and hurricanes in regions such as the Caribbean islands and the southwest Pacific Ocean.
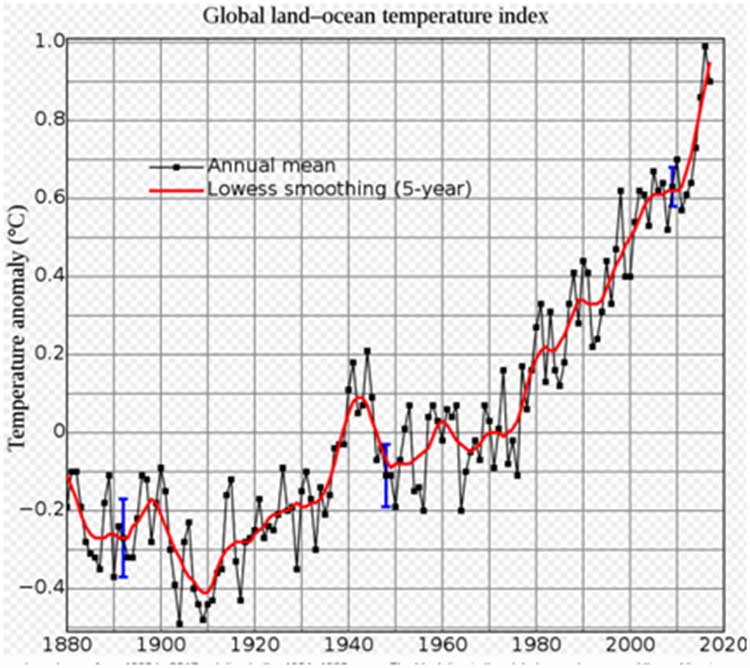
Figure
1. 1880-2018
annual mean temperatures and 5-years
smoothing. https://data.giss.nasa.gov/gistemp/graphs/customize.html
Hudson
(2011)[xi] estimates
the increase in absorbed radiation due to total removal of Arctic
summer sea ice as 0.7 Watt/m2(~1.05oCelsius), which means the global
effect of Arctic melting, which in itself constitutes a consequence
of global warming, is close to that of the total rise in
atmospheric CO2.
The
warming of large parts of the permafrost of the Siberian and Canadian
Tundra results in the release of large amounts of methane from stored
organic matter residues. This has already led to a rise of methane
levels from 1817 ppb in 2014 to 1860.1 ppb in November 2017[xii].
As methane is released from the permafrost the atmospheric greenhouse
level and temperatures rise, with further ice and permafrost melt
acting as amplifying feedback loops. Already the bubbling of methane
from thawing permafrost is manifest through much of Siberia, northern
Scandinavia and Canada[xiii],
locally leading to collapse and cratering (Figure 6)[xiv].
Along
with thawing and breakdown of Arctic Sea ice the Greenland ice sheet
has been melting at an accelerating rate[xv].
In 2006, the Greenland and Antarctic ice sheets experienced a
combined mass loss of 475±158 Gt/yr (billion ton/yr), equivalent to
1.3±0.4 mm/yr sea level rise. The acceleration in ice sheet loss
over the last 18 years was 21.9±1 Gt/yr2 for Greenland and 14.5
± 2 Gt/yr2 for Antarctica, for a combined total of 36.3±2
Gt/yr2. This acceleration is 3 times larger than for mountain
glaciers and ice caps (12 ± 6 Gt/yr2). If this trend continues, ice
sheets will be the dominant contributor to sea level rise in the 21st
century.
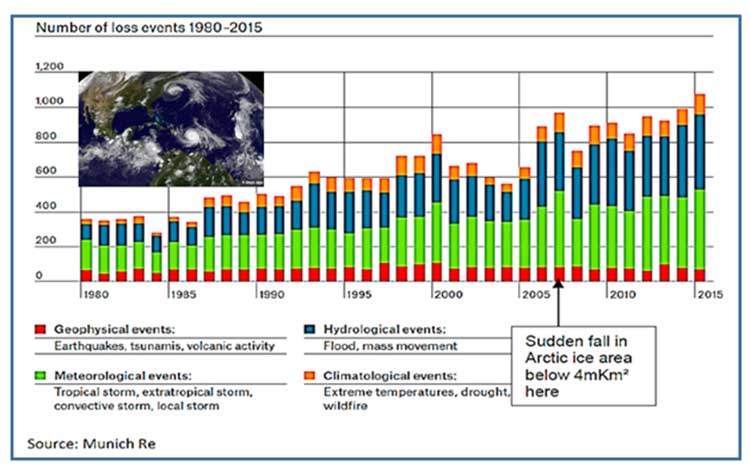
The
warming of Earth, manifest in the Arctic Sea, polar ice sheets,
injection of cold storms into mid-latitudes, permafrost thaw,
hurricanes and wildfires, and the total rise in extreme weather
events (Figure 7). The willful ignorance of the powers to be in
promoting carbon emissions and allowing the devastation of large
parts of the habitable biosphere will be remembered by future
generations of those who survive the currently ongoing calamity.
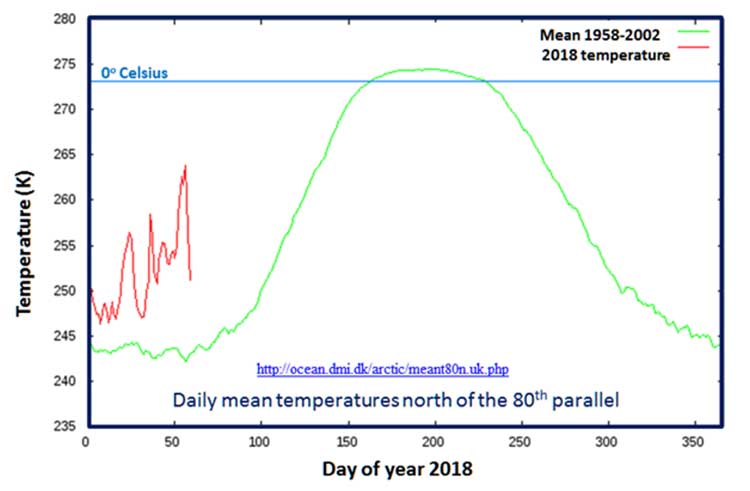
Figure
2. Average
daily temperature north of the 80th parallel in 2018
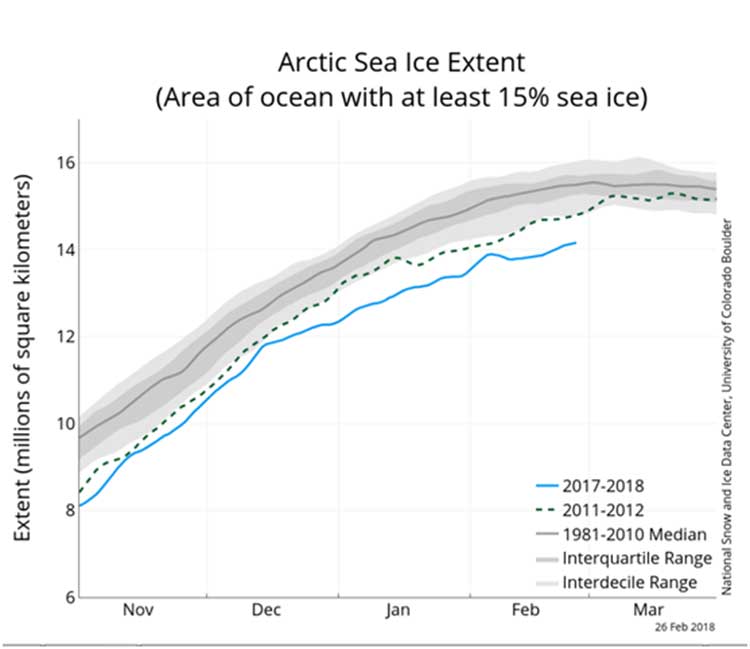
Figure
3. Arctic
Sea ice extent between November 2017 and March 2018 (areas of ocean
have at least 15% ice) http://nsidc.org/arcticseaicenews/
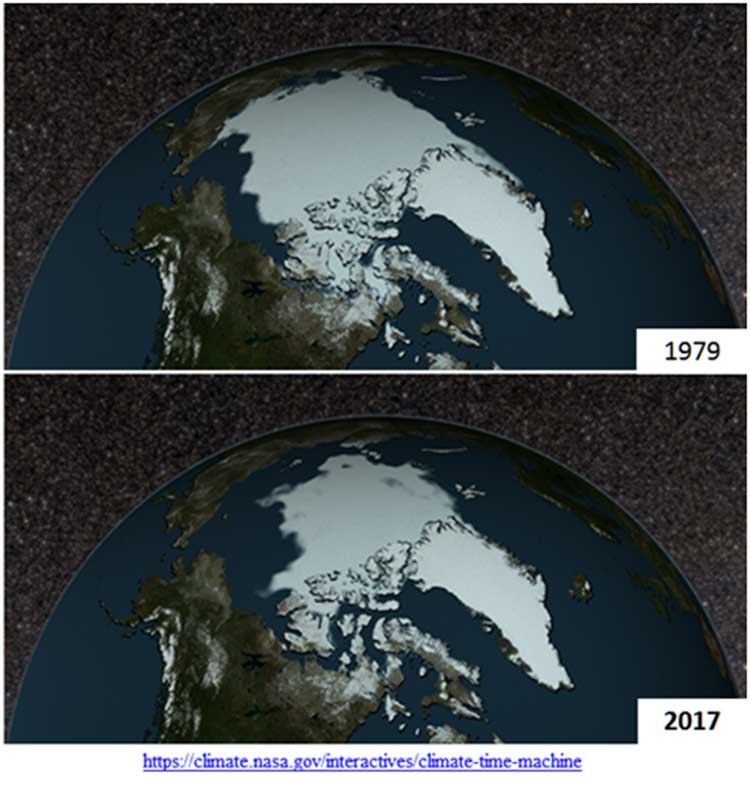
Figure
4.The
decline in the extent of Arctic Sea ice cover between 1979 and 2017.
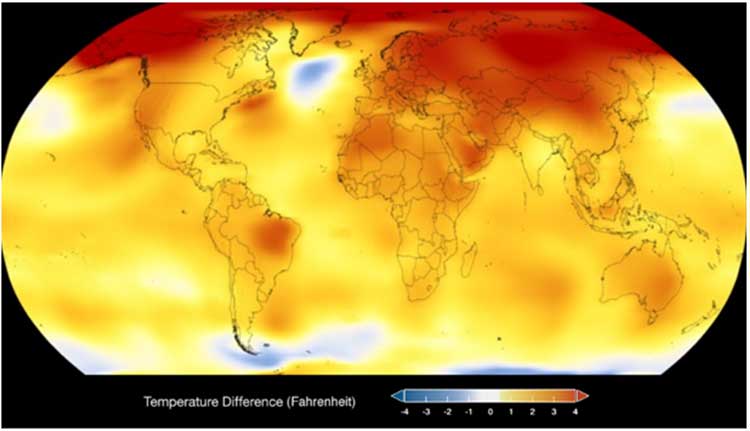
Figure
5. 2017
temperatures (in Fahrenheit) relative to 1884
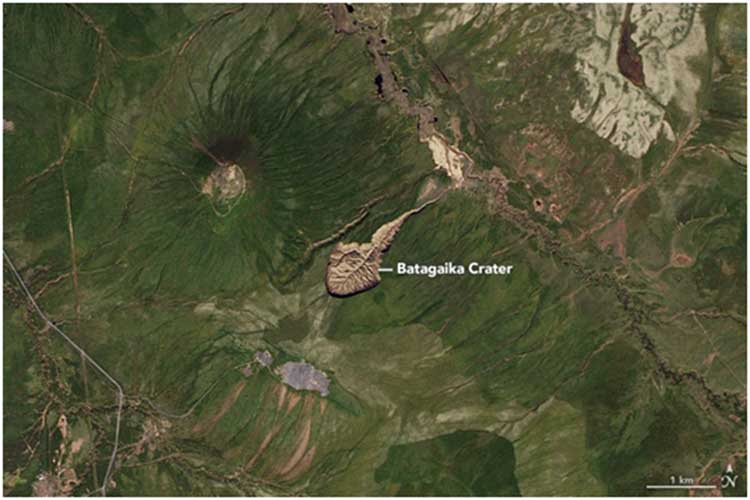
Figure
6.
Batagaika Crater, northeast Siberia, formed by melting of permafrost.
NASA https://earthobservatory.nasa.gov/IOTD/view.php?id=90104
[iii]https://www.ncdc.noaa.gov/abrupt-climate-change/Heinrich%20and%20Dansgaard%E2%80%93Oeschger%20Events
[x]https://www.reuters.com/article/us-europe-weather-italy/freeze-engulfs-europe-rare-rome-snow-disrupts-flights-idUSKCN1GA1KL
[xiii]https://insideclimatenews.org/news/18072017/arctic-permafrost-melting-methane-emissions-geologic-sources-study
[xiv]http://www.bbc.com/earth/story/20170223-in-siberia-there-is-a-huge-crater-and-it-is-getting-bigger
Andrew
Glikson,
Earth and paleoclimate scientist, Australian National University
Here is Kevin Hester's interview with Andrew Glisson
Feb 13, 2018: The judge dismissed all charges in the lawsuit brought against Tim by BC Green Party leader Andrew Weaver. It is a great victory for free speech.
ReplyDelete‘The Deliberate Corruption of Climate Science’.
https://www.youtube.com/watch?v=tPzpPXuASY8
My website is
“Human Caused Global Warming”, 'The Biggest Deception in History’.
https://www.youtube.com/watch?v=tPzpPXuASY8
https://www.youtube.com/watch?v=sO08Hhjes_0
www.drtimball.com