Showing posts with label Dr.Andrew Glikson. Show all posts

Wednesday, 24 February 2021

The Breach of the Arctic Vortex and the Effects of Ice Meltwater on the Oceans

 Snowstorms, the Breach of the Arctic Vortex and the Effects of Ice Meltwater on the Oceans

By Dr. Andrew Glikson


Global Research,

23 February, 2021


All Global Research articles can be read in 27 languages by activating the “Translate Website” drop down menu on the top banner of our home page (Desktop version).

***

Warnings by leading climate scientists regarding the high sensitivity of the atmosphere in response to abrupt compositional changes, such as near-doubling of greenhouse gas concentrations, are now manifest: According to Wallace Broecker, (the “father” of climate science) “The paleoclimate record shouts out to us that, far from being self-stabilizing, the Earth’s climate system is an ornery beast which overreacts to even small nudges, and humans have already given the climate a substantial nudge”. As stated by James Zachos, “The Paleocene hot spell should serve as a reminder of the unpredictable nature of climate”.

As snowstorms the Beast from the East (2018) and Storm Darcy (2021) sweep the northern continents, reaching Britain and as far south as Texas and Greece, those who still question the reality and consequences of global climate change, including in governments, may rejoice as if they have a new argument to question global warming.

However, as indicated by the science, these fronts result from a weakened circum-Arctic jet stream boundary due to decreased temperature polarity between the Arctic Circle and high latitude zones in Europe, Russia and North America. The reduced contrast allows migration of masses of cold Arctic air southward and of tropical air northward across the weakened jet stream boundary, indicating a fundamental shift in the global climate pattern (Figure 1).
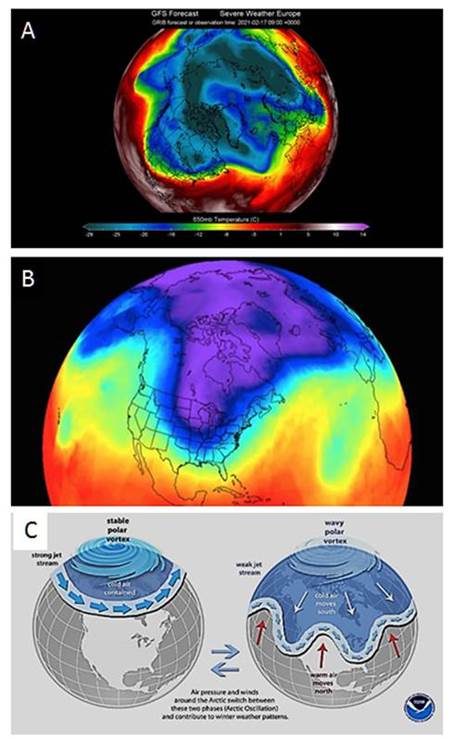
Figure 1. (A and B) Extensions from the Arctic polar zone into North America and Eutope; (C) weakening of the Arctic jet stream boundary (NOAA)

The weakening of the Arctic boundary is a part of the overall shift of climate zones toward the poles in both hemispheres, documented in detail in Europe (Figure 2). Transient cooling pauses are projected as a result of the flow of cold ice meltwater from Greenland and Antarctica into the oceans, leading to stadial cooling intervals.
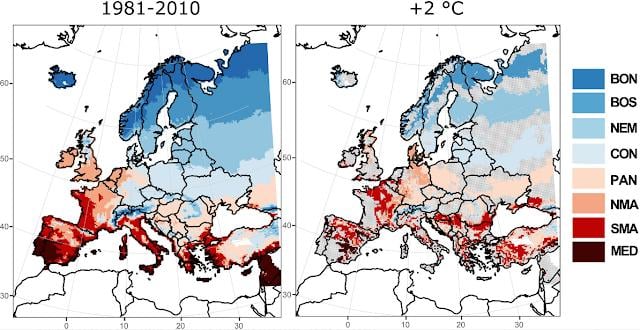
Figure 2. Migration of climate zones in Europe during 1981-2010 and under +2°C. Faint pink areas represent advanced warming. (A, left) Agro‐climate zonation of Europe based on growing season length (GSL) and active temperature sum (ATS) obtained as an ensemble median from five different climate model simulations during the baseline period (1981–2010). (B, right) Ensemble median spatial patterns of agro-climate zones migration under 2°C global surface warming according to model RCP8.5. Gray areas represent regions where no change with respect to the baseline period is simulated.

A combination of ice sheet melting and the flow of melt water into the oceans on the one hand, and ongoing warming of tropical continental zones on the other hand, are likely to lead to the following:

  • Storminess due to collisions of cold and warm air masses;
  • As the ice sheets continue to melt, the cold meltwater enhances lower temperatures at shallow ocean levels, as modelled by Hansen et al. (2016) and Bonselaer et al (2018) (Figure 3A), as contrasted with warming at deeper ocean levels over large parts of the oceans. This transiently counterbalances the effects of global warming over the continents arising from the greenhouse effect;
  • The above processes herald chaotic climate effects, in particular along continental margins and island chains.
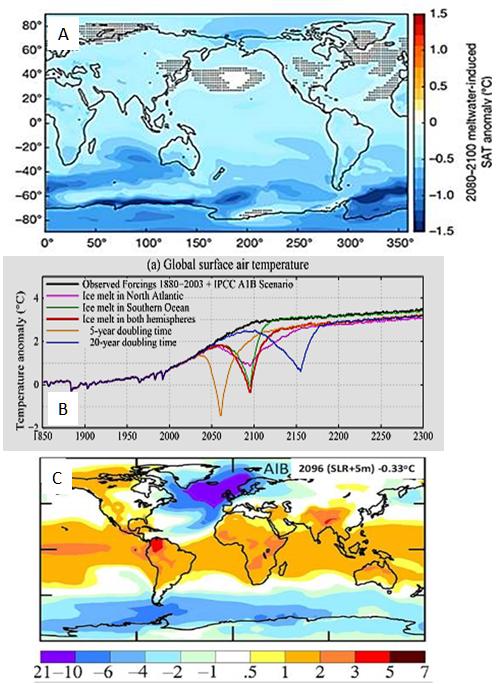
Figure 3. A. 2080–2100 meltwater-induced sea-air temperature anomalies relative to the standard RCP8.5 ensemble (Bronselaer et al., 2018), indicating marked cooling of parts of the southern oceans. Hatching indicates where the anomalies are not significant at the 95% level; B. Negative temperature anomalies through the 21st-22nd centuries signifying stadial cooling intervals (Hansen et al., 2016); C. A model of Global warming for 2096, where cold ice melt water occupies large parts of the North Atlantic and circum-Antarctica, raises sea level by about 5 meters and decreases global temperature by -0.33°C (Hansen et al., 2016).

The extreme rate at which the global warming and the shift of climate zones are taking place virtually within a period less than one generation-long, faster than major past warming events such as at the Paleocene-Eocene boundary 56 million years ago, renders the term “climate change” hardly appropriate, since what we are looking at is a sudden and abrupt event.

According to Giger (2021)

“Tipping points could fundamentally disrupt the planet and produce abrupt change in the climate. A mass methane release could put us on an irreversible path to full land-ice melt, causing sea levels to rise by up to 30 meters. We must take immediate action to reduce global warming and build resilience with these tipping points in mind.”

Computer modelling does not always capture the sensitivity, complexity and feedbacks of the atmosphere-ocean-land system as observed from paleoclimate studies. Many models portray gradual or linear responses of the atmosphere to compositional variations, overlooking self-amplifying effects and transient reversals associated with melting of the ice sheets and cooling of the oceans by the flow of ice melt.

According to Bonselaer et al. (2018)

“The climate metrics that we consider lead to substantially different future climate projections when accounting for the effects of meltwater from the Antarctic Ice Sheet. These differences have consequences for climate policy and should be taken into account in future IPCC reports, given recent observational evidence of increasing mass loss from Antarctica” and “However, the effect on climate is not included (by the IPCC) and will not be in the upcoming CMIP6 experimental design. Similarly, the effects of meltwater from the Greenland Ice Sheet have so far not been considered, and could lead to further changes in simulated future climate”. Depending on future warming the effect of Antarctic ice meltwater may extend further, possibly becoming global.

By contrast to ocean cooling, further to NASA’s reported mean land-ocean temperature rise of +1.18°C in March 2020 above pre-industrial temperatures, relative to the 1951-1980 baseline, large parts of the continents, including central Asia, west Africa eastern South America and Australia are warming toward mean temperatures of +2°C and higher. The contrast between cooling of extensive ocean regions and warming of the continental tropics is likely to lead to extreme storminess, in particular along continent-ocean interfaces.

The late 20th century to early 21st century global greenhouse gas levels and regional warming rates have reached a large factor to an order of magnitude faster than warming events of past geological and mass extinction events, with major implications for the nature and speed of extreme weather events.

For these reasons the term “climate change” for the current extreme warming, which is reaching +1.5°C over the continents and more than +3°C over the Arctic over a period shorter than one century, no longer applies.

The world is looking at an extremely rapid shift in the climatic conditions that have allowed civilization to emerge.

*

Note to readers: please click the share buttons above or below. Forward this article to your email lists. Crosspost on your blog site, internet forums. etc.

Dr Andrew Glikson is an Earth and Paleo-climate scientist, Canberra, Australia.

Featured image is from Barbara Nimri Aziz

Friday, 15 November 2019

Andrew Glikson on Portents of continental-scale fires as the Earth warms


Portents of continental-scale 
fires as the Earth warms
Andrew Glikson
Earth and climate scientist
Australian National University
15.11.2019

Arctic News,
14 November, 2019

The effects of encroaching deserts and of fire storms on terrestrial forests originally developed under moderate conditions distinct from those emerging under rapid global warming and extreme weather events may have been underestimated. Average global temperatures do not tell the story — it is the increasingly frequent weather anomalies which do. Powerful psychological factors prevent many scientists from expressing their worst fears, a phenomenon dubbed as “scientific reticence”.

As the tropical climate zones expand toward the poles, moderate climate zones shift polar-ward and are contracting where they clash with polar-derived cold air and ice melt water flow through weakened jet stream boundaries. As climate zones are shifting at a rate of 56-111 km per decade and ecosystems have only a short time to adapt, arid zones expand and draughts of fires consume the moderate-climate forests and formerly fertile habitats. Allen et al. (2012) suggest the increase in black carbon aerosols and tropospheric ozone constitute significant factors generating a polar-ward shift of moderate climate zones.

Global fire maps by NASA document the progression of wildfires since about 2000, including major fires in Siberia, northwest Europe, southern Europe, Russia, Southeast Asia, Australia, central and southern America, California and elsewhere (Fig. 1).
Figure 1. The Moderate Resolution Imaging Spectro-radiometer (MODIS) on NASA's Terra satellite showing fires around the world. Credit: NASA
Some of the global patterns that appear in the fire maps are the result of natural cycles of rainfall, dryness, and lightning. For example, naturally-occurring fires are common in the boreal forests of Canada in the summer. In other parts of the world, the patterns are the result of human activity. For example, the intense burning in the heart of South America from August-October is a result of human-triggered fires, both intentional and accidental.

Many scientists and the IPCC have underestimated the scale and rate of global warming and its consequences. With exceptions, the need for excessive caution and absolute certainty in science is often manifested in reticence from the mainstream science (‘Down to Earth’ 2019). However, the available evidence suggests that scientists have in fact been conservative in their projections of the impacts of climate change and at least some of the key attributes of global warming from increased atmospheric greenhouse gases have been underpredicted, particularly in IPCC assessments of the physical science by Working Group I.

By contrast, at a speed hardly anticipated about 20 years ago, wildfires have been spreading around the globe over large parts of the continents.

Nor do average global land-ocean temperatures tell the whole story. It is the increasingly frequent anomalies which underlie extreme weather events (Fig. 2), including rapid Arctic melt, heatwaves, fires, storms and cyclones, which underpin the fundamental shift in the state of the terrestrial climate.
Figure 2. Temperature anomaly distribution: The frequency of occurrence (vertical axis) of local temperature anomalies (relative to 1951-1980 mean) in units of local standard deviation (horizontal axis). Area under each curve is unity. Image credit: NASA/GISS.
It has been stated “What happens in the Arctic doesn't stay in the Arctic”. Temperatures in the Arctic have reached 34°C in July 2019, affecting melting over 700,000 km² in Greenland late May 2019. The weakening of the circum-Arctic jet stream ensues in its undulation and intersection by warm air masses moving north and by cold air masses moving south, along with ice melt from the Greenland ice sheet forming cold regions in the North Atlantic Ocean.
Figure 3. Weather systems driven by the 
strong westerly winds of the Antarctic 
polar vortex curl over the southern 
continents (NASA, Galileo).
According to the Australian Climate Council, climate change has contributed to a southward shift in weather systems that typically bring cool season rainfall to southern Australia. As the cold humid spirals of the Antarctic vortex (Fig. 3) recede to the south, since the 1970s late autumn and early winter rainfall has decreased by 15% in southeast Australia, and Western Australia’s southwest region. Current drought conditions come after a 2016/2017 and 2018 Summer characterized by record-breaking temperatures, followed by a record dry winter. Rainfall over southern Australia during autumn 2018 was the second lowest on record (Fig. 4). The drought has reached extreme level, accompanied by wildfires. Australia, like other parts of the world, is paying the price of climate change in terms of growing damage to its agriculture, communities and way of life.
Figure 4. Australia: Current effects of global warming. 
A. 2018 annual mean temperatures compared to historical temperature observations. 
B. 2018 annual rainfall compared to historical rainfall observations.
The global rise rate in CO₂ has reached 2 to 3 ppm/year, the fastest rate since 66 million years ago, and a level of CO₂-equivalent (a value including the radiative forcing of methane and nitrous oxide) near 500 ppm. According to the IMF (2017), the world is subsidizing fossil fuels by $5.2 trillion, equal to roughly 6.5% of global GDP. By contrast, the loss of wealth due to reduced agricultural productivity due to climate change is projected to exceed $19 billion by 2030, $211 billion by 2050 and a projected $4 trillion by 2100.
Figure 5. Fires in Australia, November 8, 2019, NASA Worldview 
As stated by Hansen et al. (2012): “Burning all fossil fuels would create a different planet than the one that humanity knows. The palaeoclimate record and ongoing climate change make it clear that the climate system would be pushed beyond tipping points, setting in motion irreversible changes, including ice sheet disintegration with a continually adjusting shoreline, extermination of a substantial fraction of species on the planet, and increasingly devastating regional climate extremes”.

Andrew Glikson
Dr Andrew Glikson
Earth and climate scientist
Australian National University


Books:
The Archaean: Geological and Geochemical Windows into the Early Earth
The Asteroid Impact Connection of Planetary Evolution
The Plutocene: Blueprints for a Post-Anthropocene Greenhouse Earth
Evolution of the Atmosphere, Fire and the Anthropocene Climate Event Horizon
Asteroids Impacts, Crustal Evolution and Related Mineral Systems with Special Reference to Australia
Climate, Fire and Human Evolution: The Deep Time Dimensions of the Anthropocene
From Stars to Brains: Milestones in the Planetary Evolution of Life and Intelligence


Wednesday, 14 August 2019

Dr.Andrew Glikson on climate change and the changing face of the planet


The changing face of planet Earth

Andrew Glikson
Earth and Climate scientist

Australian National University


12 August, 2019

Preamble

The inhabitants of planet Earth are in the process of destroying the habitability of their world through the perpetration of the largest mass extinction of species since 66 million years ago, when a large asteroid impacted Earth, and 55 million years since the Paleocene-Eocene Thermal Maximum (PETM) reaching 5–8°C. The late Holocene-Anthropocene climate change represents an unprecedented event, triggering a fast shift in climate zones and a series of extreme weather events, with consequences for much of nature and civilization. The changes are manifest where green forests are blackened by fire, droughts are turning grassy planes to brown semi-deserts, brilliant white snow and ice caps are melting into pale blue water and clear blue skies turn grey due to aerosols and jet contrails, most particularly in the northern hemisphere. Unless effective efforts are undertaken at CO₂ drawdown, the consequence would include demise of much of nature and a collapse of human civilization.

1. The scorched Earth

The transfer of hundreds of billions of tonnes of carbon from the Earth crust, the residues of ancient biospheres, to the atmosphere and oceans, condemning the bulk of life through the most extreme shift in the composition of the atmosphere and ocean Earth has experienced since 55 million years ago, with changes taking place in front of our eyes. Since the industrial revolution, about 375 billion tonnes of carbon (or 1,374 billion tonnes CO₂) have been emitted by humans into the atmosphere. The consequences are everywhere, from mega-droughts, to heat waves, fires, storms and floods. With atmospheric CO₂-equivalent rising above 500 ppm and mean temperatures by more than 1.5°C (Figure 1) look no further than the shift in climate zones, displayed for example on maps of the expanding wet tropical zones, drying sub-tropical latitudes and polar-ward migration of temperate climate zone. The ice sheets and sea ice are melting, huge fires overtake Siberia, the Sahara is shifting northward, large parts of southern Europe are suffering from droughts, heat waves and fires, the Kalahari Desert dunes are shifting and much of southern Australia is affected by warming and draughts. This is hardly compensated by a minor increase in precipitation and greening such as at the southern fringes of the Sahara Desert and parts of northern Australia.

Induced by anthropogenic carbon emissions reaching 37.1 billion tonnes CO₂ in 2018 and their amplifying feedbacks from land and oceans and, ranging from 16.5 tonnes CO₂ per capita per year from the US to 35.5 tonnes CO₂ per capita per year from Saudi Arabia and 44 tonnes CO₂ per capita per year from Australia, the inexorable link between these emissions and the unfolding disaster is hardly mentioned by mainstream political classes and the media.
Figure 1 (A) Growth of CO₂-equivalent level and the annual greenhouse gas Index (AGGI¹). Measurements of CO₂ to the 1950s are from (Keeling et al., 1958) and air trapped in ice and snow above glaciers. Pre-1978 changes are based on ongoing measurements of all greenhouse gases. Equivalent CO₂ amounts (in ppm) are derived from the relationship
between CO₂ concentrations and radiative forcing from all long lived gases(B) showing how much warmer each month of the GISTEMP data is than the annual global mean. For July (2019) temperatures rose by about +1.5°C. ¹The AGGI index uses 1990 as a baseline year with a value of 1. The index increased every year since 1979.

2. Migrating climate zones

As the globe warms, to date by a mean of near ~1.5 °C, or ~2.0°C when the masking effects of sulphur dioxide and other aerosols are considered, and by a mean of ~2.3°C in the polar regions, the expansion of warm tropical latitudes and the pole-ward migration of subtropical and temperate climate zones (Figure 2) ensue in large scale droughts such as parts of inland Australia and southern Africa. A similar trend is taking place in the northern hemisphere where the Sahara desert is expanding northward, with consequent heat waves across the Mediterranean and Europe.

In southern Africa “Widespread shifts in climate regimes are projected, of which the southern and eastern expansion of the hot desert and hot steppe zones is most prominent. From occupying 33.1 and 19.4 % of southern Africa under present-day climate, respectively, these regions are projected to occupy between 47.3 and 59.7 % (hot desert zone) and 24.9 and 29.9 % (hot steppe zone) of the region in a future world where the mean global temperature has increased by ~3°C.

Closely linked to the migration of climate zones is the southward drift of Antarctic- sourced cold moist fronts which sustain seasonal rain in south-west and southern Australia. A feedback loop has developed where deforestation and decline in vegetation in southern parts of the continent result in the rise of thermal plumes of dry air masses that deflect the western moist fronts further to the southeast.
Figure 2. Köppen-Geiger global Climate zones classification map

Since 1979 the planet’s tropics have been expanding pole-ward by 56 km to 111 km per decade in both hemispheres, leading one commentator to call this Earth’s bulging waistline. Future climate projections suggest this expansion is likely to continue, driven largely by human activities – most notably emissions of greenhouse gases and black carbon, as well as warming in the lower atmosphere and the oceans.”

An analysis of the origin of Australian droughts suggests, according to both observations and climate models, that at least part of this decline is associated with changes in large-scale atmospheric circulation, including shrinking polar ice and a pole-ward movement of polar-originated westerly wind spirals, as well as increasing atmospheric surface pressure and droughts over parts of southern Australia (Figure 3). Simulations of future climate with this model suggest amplified winter drying over most parts of southern Australia in the coming decades in response to changes in radiative forcing. The drying is most pronounced over southwest Australia, with total reductions in austral autumn and winter precipitation of approximately 40% by the late twenty-first century. Thus rainfall in southwestern Australia has declined sharply from about 1965 onward, concomitant with the sharp rise of global temperatures.
Figure 3 (A) Bureau of Meteorology (BOM) drought map, showing rainfall levels for the southern wet season from April 1 to July 31 in 2019; (B) NASA satellite image displaying a southward deflection of Antarctic-sourced moist cold fronts from southern Australia, a result of (1) southward migration of climate zones; (2) increasing aridity of southern and southwestern Australia due to deforestation; (3) rising hot plumes from warming arid land.

3. Extreme weather events

The consequences of the migration of climate zones are compounded by changes in flow patterns of major river systems around the world, for example in southern an southeastern Asia, including the Indus, Ganges, Brahmaputra and Mekong river basins, the home and bread basket for more than a billion people. With warming, as snow cover declines in the mountainous source regions of rivers, river flows are enhanced, with ensuing floods, in particular during the Monsoon. For example, in 2010 approximately one-fifth of Pakistan's total land area was affected by floods (Figure 4A), directly affecting about 20 million people, with a death toll close to 2,000. And about 700 people in cyclone Isai in Mozambique (Figure 4B, C). Such changes in climate and geography are enhanced once sea level rise increases from the scale of tens of centimeters, as at present, to meters, as predicted to take place later this and next century.

An increasing frequency and intensity of cyclones constitute an inevitable consequence of rising temperatures over warm low pressure cell tracks in tropical oceans, already affecting large populations in the Caribbean and west Pacific island chains, encroaching into continental coastal zones, Chinasoutheast USAsoutheast AfricaIndianorthern Australia, the Pacific islands. According to Sobel et al. (2016) “We thus expect tropical cyclone intensities to increase with warming, both on average and at the high end of the scale, so that the strongest future storms will exceed the strength of any in the past”. Likewise increasing temperatures, heat waves and droughts, compounded by deforestation over continents, constitute an inevitable consequence of heat waves and droughts. A prime example is the Siberian forest fires (Figure 5B), covering an area larger than Denmark and contributing significantly to climate change. Since the beginning of the year a total of 13.1 million hectares has burned. Total losses from natural catastrophes on 2018 stated as US$160 billion.
Figure 4 (A) Pakistan flooding, shows the 2010 Indus River spanning well over 10 kilometers, completely filling the river valley and spilling over onto nearby land. Floodwaters have created a lake almost as wide as the swollen Indus that inundates Jhatpat; (B) Before-and-after satellite imagery of Mozambique showing massive flood described as an "inland ocean" up to 30 miles wide following the landfall of Tropical Cyclone Idai, 2019.
Figure 5 (A) Global fire zones, NASA. The Earth data fire map accumulates the locations of fires detected by moderate-resolution imaging radiometer (MODIS) on board the Terra and Aqua satellites over a 10-day period. Each colored dot indicates a location where MODIS detected at least one fire during the compositing period.

Color ranges from red where the fire count is low to yellow where number of fires is large; (B) An ecological catastrophe in Russia: wildfires have created over 4 million square km smoke lid over central northern Asia.

Big Siberian cities are covered with toxic haze that had already reached Urals.

4. Shrinking Polar ice sheets

Last but not least, major changes in the Polar Regions are driving climate events in the rest of the globe. According to NOAA Arctic surface air temperatures continued to warm at twice the rate of the rest of the globe, leading to major thaw at the fringes of the Arctic (Figure 6A) and a loss of 95 percent of its oldest ice over the past three decades. Arctic air temperatures during 2014-18 since 1900 have exceeded all previous records and are driving broad changes in the environmental system both within the Arctic as well as through the weakening of the jet stream which separates the Arctic from warmer climate zones. The recent freezing storms in North America represent penetration of cold air masses through an increasingly undulating jet stream barrier, as well as allowing warm air masses to move northward, further warming the Arctic and driving further ice melting (Figure 6B).

According to Rignot et al. (2011) in 2006 the Greenland and Antarctic ice sheets experienced a combined mass loss of 475 ± 158 billion tons of ice per year. IPCC models of future climate change contain a number of departures from the paleoclimate evidence, including the major role of feedbacks from land and water, estimates of future ice melt, sea level rise rates, methane release rates, the role of fires in enhancing atmospheric CO₂, and the already observed onset of transient freeze events consequent on the flow of ice melt water into the oceans. Ice mass loss would raise sea level on the scale of meters and eventually tens of meters (Hansen et al. 2016). The development of large cold water pools south and east of Greenland (Rahmstorf et al. 2015) and at the fringe of West Antarctica, signify early stages in the development of a North Atlantic freeze, consistent with the decline in the Atlantic Meridional Ocean Circulation (AMOC). As the Earth warms the increase in temperature contrasts across the globe, in particular between warming continental regions and cooling ocean regions, leads to storminess and extreme weather events, which need to be taken into account when planning adaptation measures, including preparation of coastal defenses, construction of channel and pipelines from heavy precipitation zones to drought zones.
Figure 6 (A) Thawing at the fringes of Siberia and Canada. Scientists say 2019 could be another annus horribilis for the Arctic with record temperatures already registered in Greenland—a giant melting ice sheet that threatens to submerge the world's coastal areas one day; (B) Weakening and increasing undulation of the polar vortex, allowing penetration of cold fronts southward and of warm air masses northward.
Figure 7 (A) Surface air temperature (°C) change in 2055–2060 relative to 1880–1920 according to. A1B model + modified forcings and ice melt to 1 meter sea level rise; (B) Surface-air temperature change in 2096 relative to 1880–1920 according to IPCC model AIB adding Ice melt with 10-year doubling of ice melt leading to +5 meters sea level rise; (C) Surface air temperature (°C) relative to 1880–1920 for several scenarios taking added ice melt water into account (Hansen et al. 2016)

Postscript

None of the evidence and projections summarized above appears to form a priority consideration on the part of those in power—in parliaments, in corporations, among the wealthy elites and vested interests. Having to all intents and purposes given up on the habitability of large parts of the Earth and on the survival of numerous species and future generations—their actions and inactions constitute the ultimate crime against life on Earth.

Andrew Glikson

Dr Andrew Glikson
Earth and climate scientist
Australian National University
Canberra, Australian Territory, Australia
geospec@iinet.net.au

Books:

The Archaean: Geological and Geochemical Windows into the Early Earth
The Asteroid Impact Connection of Planetary Evolution
Asteroids Impacts, Crustal Evolution and Related Mineral Systems with Special Reference to Australia
Climate, Fire and Human Evolution: The Deep Time Dimensions of the Anthropocene
The Plutocene: Blueprints for a Post-Anthropocene Greenhouse Earth
Evolution of the Atmosphere, Fire and the Anthropocene Climate Event Horizon
From Stars to Brains: Milestones in the Planetary Evolution of Life and Intelligence

From Stars to Brains: Milestones in the Planetary Evolution of Life and Intelligence

The Plutocene: Blueprints for a Post-Anthropocene Greenhouse Earth