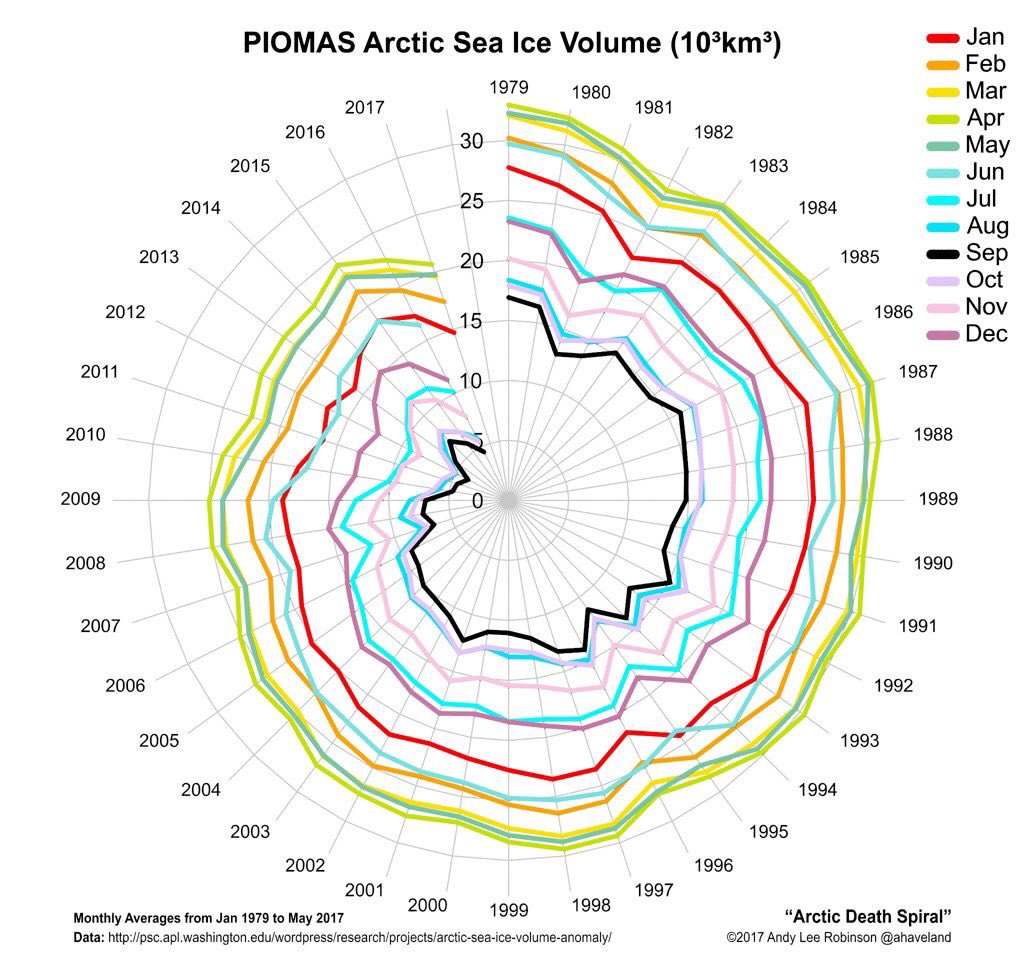
Arctic sea ice update - 06/03/2017
Neven of Arctic Sea Ice Blog is hedging his bets.
I shall ignore those that, glued to their computers, are predicting Arctic sea ice will disappear some time between 20140 and 2100,
I shall ignore those that, glued to their computers, are predicting Arctic sea ice will disappear some time between 20140 and 2100,
The #Arctic Sea-Ice Vortex Is Circling Oblivian - getting Flushed Down Toilet - Lowest ever for May this year.
#climate #climatechange #USA

From Torstein Viddal
BLANC:
This is another wild speculation for the summer of 2017 sea ice in
the Arctic.
Followers
of the ice will be familiar with the name "Laptev Bite",
which is the open ocean "bite" into the North Pole region
stemming from the Laptev Sea (which is up in this map). I'm tagging
that bite with an "L" in this speculative view of the
coming summer melt season.
But
the real speculative bit is the adding of 4 more "bites"
into the pole. And here I'm on really thin ice (I know, bad pun).
These are: Beaufort Bite, Atlantic Bite, Nares Bite & Chukchi
Bite. It will be a Massive Attack.
Magnitude 6.9 quake hits in Bering Sea, off Alaska: USGS
A
strong 6.9-magnitude earthquake struck in the Bering Sea, off the
coast of Alaska's Aleutian Islands on Friday, the U.S. Geological
Survey said, but it was not expected to cause a tsunami.
The
quake's epicenter was 127 miles (204 km) northwest of Attu Station,
part of the Aleutian Islands archipelago. The quake was very shallow,
at a depth of only 2.7 miles, the USGS said.
The
U.S. Pacific Tsunami Center said the quake was not expected to cause
a tsunami for the U.S. West Coast, British Columbia or Alaska.
PIOMAS June 2017
Another
month has passed and so here is the updated Arctic sea ice volume
graph as calculated by the Pan-Arctic Ice Ocean Modeling and
Assimilation System (PIOMAS) at the Polar
Science Center:
Finally
some good news, relatively speaking. The cold that crept over the
Arctic during the last week of April, lingered for two more weeks
into May, causing volume loss during that first half to be third
lowest since 2007. But then the weather flipped, causing volume loss
to pick up speed again and ending third (behind 2010 and 2012) for
the latter half of May. Overall volume loss was just below the
average since 2007.
And
so the gap with number two has now become somewhat smaller. At the
end of last
month 2017
was 1595 km3 lower than runner-up 2011. In the meantime 2016 has
become the runner-up, 1211 km3 behind 2017 at the end of May. The
difference with 2012 has also been slashed by almost 1000 km3.
Here's
how the differences with previous years have evolved from last month:
Wipneus' version
of the PIOMAS sea ice volume graph clearly shows that the gap has
become smaller, but 2017 is still well below all other years:
Of
course, with volume still being at a record low, according to PIOMAS,
there are various scenarios through which this melting season could
reach a record low volume minimum come September, as visualised by
this Jim
Pettit graph:
For
now, the trend line on the PIOMAS sea ice volume anomaly graph has
started to go down and has (already) entered two standard deviation
territory:
As
for average sea ice thickness (a crude calculation of PIOMAS volume
numbers divided by total JAXA sea ice extent, hence the name
PIJAMAS), 2017 continues to be extremely low:
Likewise
on the the Polar
Science Center thickness
plot:
The
reason that average thickness is so low, is that volume is lowest on
record, whereas it's 4th lowest for JAXA sea ice extent. I expect
extent losses to increase in the coming weeks, so average thickness
might actually fall in line. Unless volume also goes down
significantly. But that's something I don't want to think about.
Because
the forecasts don't look good right now. Here's what
the ECMWFforecast
model has in store for the coming 6 days:
This
is the worst kind of set-up imaginable, especially at this time of
year. All that high pressure over the Pacific side of the Arctic will
not only cause massive insolation on the MYI-less ice pack, but will
also kick the Beaufort Gyre into action, pushing even more ice out
through Fram Strait and Nares Strait.
You
can already see some of that movement during May in this animation
posted by ASIF member Ice Shieldz over on the Forum:
You
can clearly see a bulge of thick ice moving towards Fram Strait, with
some of the thickest ice moving towards a wide open Nares Strait.
This mostly happened during the second half of May, because of high
pressure on the American side of the Arctic:
So,
more of that for at least a week. I can't imagine a worse forecast at
this time of year. The past couple of melting seasons were marked by
relatively weak preconditioning and thus a lack of melting
momentum during
July and August.
Last year the Arctic clearly dodged a bullet because of it, but this year we may not be so lucky, given the record warm winter, record low sea ice volume and now open skies to cause plenty of melt ponding on that massive expanse of first-year ice.
Last year the Arctic clearly dodged a bullet because of it, but this year we may not be so lucky, given the record warm winter, record low sea ice volume and now open skies to cause plenty of melt ponding on that massive expanse of first-year ice.
Let's
see what happens.
Larsen
C likely to create largest Iceberg ever recorded


Thanks Robin, clear post. Fingers crossed for September.
ReplyDelete