Meanwhile, in New Zealand scientists at NIWA are still "debating" as to whether there is an el-Nino or not
No Pause — NASA Shows Human Hothouse Maintaining Record High Temperatures for 2015
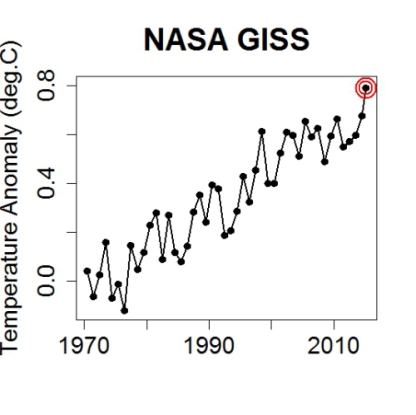
(What
2015 temperatures would look like on the annual graph if the +0.79 C
departure maintained throughout the present year. Problem is, there’s
at least some risk warming could intensify. Image
from Tamino’s recent blog post which,
justifiably, rips the fussy math of Anthony Watts and ‘friends’
into tiny little pieces.)
It’s
an El Nino year. It’s
a year in which global CO2 averages are hitting above 400 parts per
million for the first time in at least 3 million years.
And it’s a year in which CO2
equivalent values for all greenhouse gasses (including methane,
nitrogen compounds and other exotic heat trapping gasses) that humans
have emitted are nearing 485 parts per million.
Added
together — the equatorial Pacific Ocean taking a break in its
duties as atmospheric heat sink (El Nino) combined with the immense
volume of heat trapping gasses human beings have now loaded into the
atmosphere — it’s more than enough to force global temperatures
into territory likely not seen since the Eemian interglacial period
150,000 years ago.
Temperatures
Continue March into Eemian Ranges
And
NASA GISS, in
its monthly report,
is showing global temperatures that are edging into the Eemian range.
First, April of 2015 came in at 0.75 Celsius (C) hotter than the
global 20th Century average (0.95 C hotter than 1880). This
represents the second hottest value for April on record in the entire
135 year climate record, coming in just a bit cooler than the 0.83 C
departure for 2010. Meanwhile, hindsight adjustments have found that
the January-through-March period was warmer than earlier indicated —
with new departures hitting +0.76 (Jan), +0.80 (Feb), and +0.85
(Mar).
Combined,
the average of these first four months is +0.79 C above 20th Century
measures. Or about +0.99 C above 1880s values. This
puts us well outside the context of the 10,000 year period beginning
at the end of the last ice age (Holocene) and edges us into a range
more typical to the Eemian. A time when sea levels were between 6 and
8 meters (20-25 feet) higher than today.
Polar
Amplification and the Greenland Cool Pool
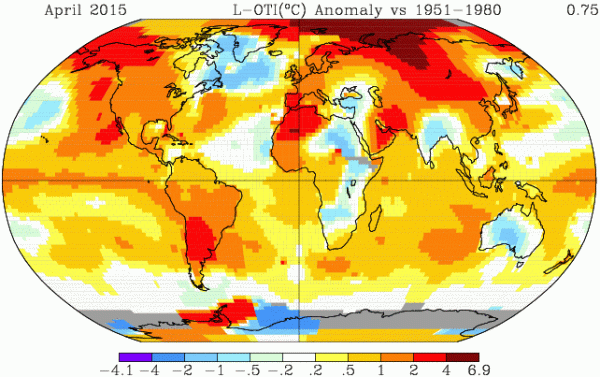
Looking
at the global temperature anomaly map provided by NASA, we can see
where much of this extra heat accumulated throughout April:
Here
we find that polar amplification for the upper Northern Hemisphere
latitudes was continuing to hit high marks. Broad south-to-north wind
flows over central Asia drove a powerful warming spanning up from
Lake Baikal in Russia, on through Central Siberia, up over the Yamal
region and into the High Arctic. Average temperatures for the month
in this zone ranged from 2 C to as high as 6.9 C above average.
Another zone of extreme warmth sprawled out over Western North
America and into the Beaufort and Chukchi Sea regions. There,
temperatures ranged between 1-4 C above 20th Century averages.
Other
notable warm regions included the Equatorial Pacific — showing a
band of 1-2 C departures in association with a developing El Nino —
and the West Antarctic Peninsula, which saw heating in the range of
2-4 degrees Celsius above average for most of the month.
Overall,
most of the globe showed above average readings with cool pools
relegated to isolated regions. In particular, the distribution of
cool temperatures near Greenland is somewhat disturbing. It’s an
indication of increased glacial melt outflows from Greenland ice
sheets into the North Atlantic. It’s
also a validation of climate model analysis of human-caused global
warming — which indicated cooling near Greenland due to a
combination of ice sheet and ocean responses to heating the
Earth-Ocean System.
The ocean response — a dangerous slowing of Atlantic thermo-haline
circulation —was
also identified in a recent paper by Rahmstorf.
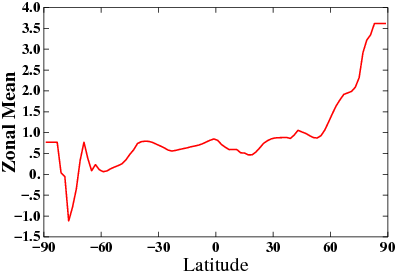
(NASA
Latitudinal temperature anomalies again shows strength of Northern
Hemisphere polar amplification. Image source: NASA.)
NASA
zonal anomalies also continue to validate climate model predictions
for human-caused warming. Here we find the predicted extreme polar
amplification — more rapid warming of the Northern Hemisphere polar
zone than the rest of the world — clearly indicated. There, in the
60-90 North Latitude zone we find temperatures ranging from 1-3.5
Celsius above the 20th Century global average. A rate of warming far
exceeding any other region.
All
other Latitudinal zones show about a +0.75 C above average
temperature departure. The first noted exception is the heat sink in
the Southern Ocean (at -0.5 to +0.5 C in this measure) which
continues to uptake atmospheric heat, transfer it to the middle ocean
and, by Ekman pumping through storm action, deliver it exactly where
it is least needed — along the basal regions of various melting
Antarctic ice shelves. The second is marked by a zone of March-April
storm intensification along the Antarctic Continent and Southern
Ocean boundary centering at 75 degrees South (-0.5 to -1 C).
Conditions
in Context
Overall,
temperatures at +0.99 degrees Celsius above 1880s averages for the
first four months of 2015 should be cause for concern. We
still have El Nino ramping up in the Pacific.
And with some models showing the event could be quite powerful, the
added boost to global heating we are seeing now could well ramp
higher later this year. In addition, we are entering an Arctic melt
season that is showing some risk of pushing Arctic sea ice into new
record lows — at least early in the melt season. Such an event
would further tilt the globe toward record heat by reducing ice-based
light and heat reflectivity in the Arctic at times of 24 hour
sunlight (May through July).
As
such, there is risk that already record warming seen since 2014 and
into 2015 could continue and, potentially, ramp higher through the
end of this year.
Links:
Catch
22 No 1


You really wrote an awaking blog that will aware to the world from the dangers of Global warming.
ReplyDeleteYour valuable blog aware us from the side effect of increasing the temperature.
Record Heat