Showing posts with label ice sheet. Show all posts

Wednesday, 24 August 2016

The collapsing West Antarctic Ice Sheet

The Melting Antarctic Ice Sheet Is Heading Towards Irreversible Collapse


2 August, 2016


Computer models suggest that the melting West Antarctic Ice Sheet (WAIS) is melting at a rapidly accelerating rate. A new computer simulation shows that at current melting rates, the ice sheet will hit a critical point in about 60 years, and could result in a sea level rise of as much as 10 feet over the next several centuries.

The results of this latest simulation, run by a pair of scientists from the Potsdam Institute for Climate Impact Research, just appeared in the latest edition of the Proceedings of the National Academy of Science.

The West Antarctic Ice Sheet (Credit: NASA)

Over the past decade, scientists have carefully watched the Amundsen Sea sector. This region of West Antarctica is currently suffering tremendous losses in ice volume, and its ongoing collapse is triggering downstream effects elsewhere on the continent. A recent NASA study suggests that the Antarctic ice sheet is adding more ice than it’s losing, but this won’t likely be the case for much longer. 
To get a sense of where this region is headed in the long-term, Johannes Feldmann and Anders Levermann ran their simulation to project the topographical conditions hundreds, and even thousands, of years from now —further in the future than any previous study.

The ultimate purpose was to determine whether or not the current Amundsen instability could lead to the entire ice sheet collapsing into the sea. The simulations suggest that this is in fact the case.

The models show that 60 more years of meltage at the current rate—a very reasonable estimate—will push the WAIS past a critical point-of-no-return.

 Beyond this threshold, a complete, long-term disintegration is predicted to occur. 

Feldmann and Levermann worry that the WAIS has already become critically unstable, and that this region has already passed the threshold point.
The study also predicts that, over the course of the next several centuries or millennia, the oceans will rise by as much as 10 feet (3 meters).

Our results show that if the Amundsen Sea sector is destabilized, then the entire marine ice sheet will discharge into the ocean, causing a global sea-level rise of about 3 m,” conclude the authors in the study. “We thus might be witnessing the beginning of a period of self-sustained ice discharge from West Antarctica that requires long-term global adaptation of coastal protection.” 

To get a sense of what some major city centers around the world would look like after a 10-foot rise in sea levels, go here and here.

Read the entire study at Proceedings of the National Academy of Sciences: “Collapse of the West Antarctic Ice Sheet after local destabilization of the Amundsen Basin”.


Thursday, 31 March 2016

New research indicates more rapid melting of Antarctic ice sheet

Another bit of modelling that fails to take into account positive feedbacks or the exponential function.

But it HAS made the news on Radio NZ.

Antarctic melt impact 'underestimated' - Global sea levels could rise by more than double the current best estimate, according to a new analysis of climate change in Antarctica.

Climate Model Predicts West Antarctic Ice Sheet Could Melt Rapidly


30 March, 2016


For half a century, climate scientists have seen the West Antarctic ice sheet, a remnant of the last ice age, as a sword of Damocles hanging over human civilization.

The great ice sheet, larger than Mexico, is thought to be potentially vulnerable to disintegration from a relatively small amount of global warming, and capable of raising the sea level by 12 feet or more should it break up. But researchers long assumed the worst effects would take hundreds — if not thousands — of years to occur.

Now, new research suggests the disaster scenario could play out much sooner.

Continued high emissions of heat-trapping gases could launch a disintegration of the ice sheet within decades, according to a study published Wednesday, heaving enough water into the ocean to raise the sea level as much as three feet by the end of this century.

With ice melting in other regions, too, the total rise of the sea could reach five or six feet by 2100, the researchers found. That is roughly twice the increase reported as a plausible worst-case scenario by a United Nations panel just three years ago, and so high it would likely provoke a profound crisis within the lifetimes of children being born today.


Under the Ice Sheet

The vast West Antarctic ice sheet sits on bedrock that dips thousands of feet below sea level. New computer simulations suggest that the warming atmosphere and ocean could attack the ice sheet from above and below, causing sea levels to rise much faster than previously thought.


The situation would grow far worse beyond 2100, the researchers found, with the rise of the sea exceeding a pace of a foot per decade by the middle of the 22nd century. Scientists had documented such rates of increase in the geologic past, when far larger ice sheets were collapsing, but most of them had long assumed it would be impossible to reach rates so extreme with the smaller ice sheets of today.

We are not saying this is definitely going to happen,” said David Pollard, a researcher at Pennsylvania State University and a co-author of the new paper. “But I think we are pointing out that there’s a danger, and it should receive a lot more attention.”

The long-term effect would likely be to drown the world’s coastlines, including many of its great cities.

New York City is nearly 400 years old; in the worst-case scenario conjured by the research, its chances of surviving another 400 years in anything like its present form would appear to be remote. Miami, New Orleans, London, Venice, Shanghai, Hong Kong and Sydney, Australia, are all just as vulnerable as New York, or more so.

In principle, coastal defenses could be built to protect the densest cities, but experts believe it will be impossible to do that along all 95,000 miles of the American coastline, meaning that immense areas will most likely have to be abandoned to the rising sea.

The new research, published by the journal Nature, is based on improvements in a computerized model of Antarctica and its complex landscape of rocks and glaciers, meant to capture factors newly recognized as imperiling the stability of the ice.

The new version of the model allowed the scientists, for the first time, to reproduce high sea levels of the past, such as a climatic period about 125,000 years ago when the seas rose to levels 20 to 30 feet higher than today.

That gave them greater confidence in the model’s ability to project the future sea level, though they acknowledged that they do not yet have an answer that could be called definitive.


You could think of all sorts of ways that we might duck this one,” said Richard B. Alley, a leading expert on glacial ice at Pennsylvania State University. “I’m hopeful that will happen. But given what we know, I don’t think we can tell people that we’re confident of that.”

Dr. Alley was not an author of the new paper, though it is based in part on his ideas about the stability of glacial ice. Several other scientists not involved in the paper described it as significant, with some of them characterizing it as a milestone.

But those same scientists emphasized that it was a single paper, and unlikely to be the last word on the fate of West Antarctica. The effort to include the newly recognized factors imperiling the ice is still crude, with years of work likely needed to improve the models.

Peter U. Clark of Oregon State University helped lead the last effort by a United Nations panel to assess the risks of sea level rise; he was not involved in the new paper. He emphasized that the research, like much previous work, highlighted the urgency of bringing emissions of carbon dioxide and other greenhouse gases under control.


It was his panel that had estimated an upper limit of three feet or so on the likely sea level rise in the 21st century, while specifically warning that a better understanding of the vulnerability of Antarctic ice could change that estimate.

The new research is the work of two scientists who have been at the forefront of ice-sheet modeling for years. They are Robert M. DeConto of the University of Massachusetts, Amherst, and Dr. Pollard, who is a colleague of Dr. Alley’s at Penn State.

In a lengthy interview on Monday, Dr. DeConto recounted years of frustration. The computer program he had built in a long-running collaboration with Dr. Pollard showed increasing sophistication in its ability to explain the behavior of ice sheets, but it had some trouble analyzing the past.

Unless global temperatures were raised to unrealistic levels, the model would not melt enough ice to reproduce the high sea levels known to have occurred in previous periods when either the atmosphere or the ocean was warmer. The ability to reproduce past events is considered a stringent test of the merits of any geological model.

We knew something was missing,” Dr. DeConto said.

The new idea came from Dr. Alley. He urged his colleagues to consider what would happen as a warming climate attacked huge shelves of floating ice that help to protect and buttress the West Antarctic ice sheet.

Smaller, nearby ice shelves have already started to disintegrate, most spectacularly in 2002, when an ice shelf the size of Rhode Island, the Larsen B shelf, broke apart in two weeks.

The West Antarctic ice sheet sits in a sort of deep bowl that extends far below sea level, and if it loses its protective fringes of floating ice, the result is likely to be the formation of vast, sheer cliffs of ice facing the sea. These will be so high they will become unstable in places, Dr. Alley said in an interview, and the warming atmosphere is likely to encourage melting on their surface in the summer that would weaken them further.

The result, Dr. Alley suspected, might be a rapid shrinkage as the unstable cliffs collapsed into the water. Something like this seems to be happening already at several glaciers, including at least two in Greenland, but on a far smaller scale than may be possible in West Antarctica.

When Dr. DeConto and Dr. Pollard, drawing on prior work by J. N. Bassis and C. C. Walker, devised some equations to capture this “ice-cliff instability,” their model produced striking results.

The obvious next step was to ask the model what might happen if human society continues to warm the planet by pouring huge amounts of greenhouse gases into the atmosphere.

The answer the scientists got is described in their paper in the dry language of science, but it could easily serve as the plot device of a Hollywood disaster movie. They found that West Antarctica, which is already showing disturbing signs of instability, would start to break apart by the 2050s.

Vulnerable parts of the higher, colder ice sheet of East Antarctica would eventually fall apart, too, and the result by the year 2500 would be 43 feet of sea level rise from Antarctica alone, with still more water coming from elsewhere, the computer estimated. In some areas, the shoreline would be likely to move inland by miles.

The paper published Wednesday does contain some good news. A far more stringent effort to limit emissions of greenhouse gases would stand a fairly good chance of saving West Antarctica from collapse, the scientists found. That aspect of their paper contrasts with other recent studies postulating that a gradual disintegration of West Antarctica may have already become unstoppable.

But the recent climate deal negotiated in Paris would not reduce emissions nearly enough to achieve that goal. That deal is to be formally signed by world leaders in a ceremony in New York next month, in a United Nations building that stands directly by the rising water.


Tuesday, 4 August 2015

The melting West Antarctoic ice sheet

West Antarctic Ice Sheet News


date?

You may have heard the news: two teams of scientists claiming that the West Antarctic Ice Sheet has been irreversibly destablized, leading to a slow-motion process that in some number of centuries will cause 3 meters of sea level rise.

Today we present observational evidence that a large section of the West Antarctic Ice Sheet has gone into irreversible retreat,” an author of one of the papers, Eric Rignot, a glaciologist at NASA’s Jet Propulsion Laboratory, said at a news conference recently. “It has passed the point of no return.”

A little context might help.


The West Antarctic Ice Sheet is the ice sheet that covers Antarctica on the Western Hemisphere side of the Transantarctic Mountains. The bed of this ice sheet lies well below sea level. The ice gradually flows into floating ice shelves such as the Ross Ice Shelf and Ronne Ice Shelf, and also glaciers that dump ice into the Amundsen Sea. Click on the map to make it bigger, so you can see all these features.


The West Antarctic Ice Sheet contains about 2.2 million cubic kilometers of ice, enough to raise the world’s oceans about 4.8 meters if it allmelted. To get a sense of how big it is, let’s visit a crack in one of its outlet glaciers.


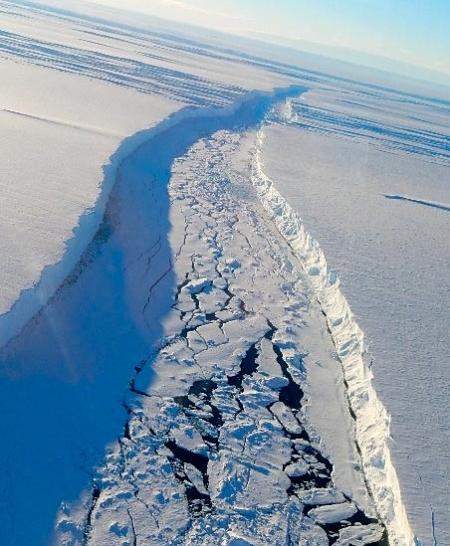
In 2011, scientists working in Antarctica discovered a massive crack across the Pine Island Glacier, a major glacier in the West Antarctic Ice Sheet. The crack was 30 kilometers long, 80 meters wide and 60 meters deep. The pictures above and below show this crack—the top one is from NASA, the bottom one was taken by an explorer named Forrest McCarthy.


By July 2013, the crack expanded to the point where a slab of ice 720 square kilometers in size broke off and moved into the Amundsen Sea.


However, this event is not the news! The news is about what’s happeningat the bottom of the glaciers of the West Antarctic Ice Sheet.


The West Antarctic Ice Sheet sits in a bowl-shaped depression in the earth, with the bottom of the ice below sea level. Warm ocean water is causing the ice sitting along the rim of the bowl to thin and retreat. As the edge of the ice moves away from the rim and enters deeper water, it can retreat faster.

So, there could be a kind of tipping point, where the West Antarctic Ice Sheet melts faster and faster as its bottom becomes exposed to more water. Scientists have been concerned about this for decades. But now two teams of scientists claim that tipping point has been passed.

Here’s a video that illustrates the process:


And here’s a long quote from a short ‘news and analysis’ article by Thomas Sumner in the 16 May 2014 issue of Science:
A disaster may be unfolding—in slow motion. Earlier this week, two teams of scientists reported that Thwaites Glacier, a keystone holding the massive West Antarctic Ice Sheet together, is starting to collapse. In the long run, they say, the entire ice sheet is doomed. Its meltwater would raise sea levels by more than 3 meters.

One team combined data on the recent retreat of the 182,000-square-kilometer Thwaites Glacier with a model of the glacier’s dynamics to forecast its future. In a paper on page 735, they report that in as few as 2 centuries Thwaites Glacier’s edge will recede past an underwater ridge now stalling its retreat. Their models suggest that the glacier will then cascade into rapid collapse. The second team, writing in Geophysical Research Letters, describes recent radar mapping of West Antarctica’s glaciers and confirms that the 600-meter-deep ridge is the final obstacle before the bedrock underlying the glacier dips into a deep basin.

Because inland basins connect Thwaites Glacier to other major glaciers in the region, both research teams say its collapse would flood West Antarctica with seawater, prompting a near-complete loss of ice in the area over hundreds of years.

The next stable state for the West Antarctic Ice Sheet might be no ice sheet at all,” says the Science paper’s lead author, glaciologist Ian Joughin of the University of Washington, Seattle. “Very crudely, we are now committed to global sea level rise equivalent to a permanent Hurricane Sandy storm surge,” says glaciologist Richard Alley of Pennsylvania State University, University Park, referring to the storm that ravaged the Caribbean and the U.S. East Coast in 2012. Alley was not involved in either study.

Where Thwaites Glacier meets the Amundsen Sea, deep warm water burrows under the ice sheet’s base, forming an ice shelf from which icebergs break off. When melt and iceberg creation outpace fresh snowfall farther inland, the glacier shrinks. According to the radar mapping released this week inGeophysical Research Letters from the European Remote Sensing satellite, from 1992 to 2011 Thwaites Glacier retreated 14 kilometers. “Nowhere else in Antarctica is changing this fast,” says University of Washington Seattle glaciologist Benjamin Smith, co-author of the Science paper.

To forecast Thwaites Glacier’s fate, the team plugged satellite and aircraft radar maps of the glacier’s ice and underlying bedrock into a computer model. In simulations that assumed various melting trends, the model accurately reproduced recent ice-loss measurements and churned out a disturbing result: In all but the most conservative melt scenarios, a glacial collapse has already started. In 200 to 500 years, once the glacier’s “grounding line”—the point at which the ice begins to float—retreats past the ridge, the glacier’s face will become taller and, like a tower of blocks, more prone to collapse. The retreat will then accelerate to more than 5 kilometers per year, the team says. “On a glacial timescale, 200 to 500 years is the blink of an eye,” Joughin says.

And once Thwaites is gone, the rest of West Antarctica would be at risk.

Eric Rignot, a climate scientist at the University of California, Irvine, and the lead author of the GRL study, is skeptical of Joughin’s timeline because the computer model used estimates of future melting rates instead of calculations based on physical processes such as changing sea temperatures. “These simulations ought to go to the next stage and include realistic ocean forcing,” he says. If they do, he says, they might predict an even more rapid retreat.


I haven’t had time to carefully read the relevant papers, which are these:
Eric Rignot, J. Mouginot, M. Morlighem, H. Seroussi and B. 


Ian Joughin, Benjamin E. Smith and Brooke Medley, Marine ice sheet collapse potentially underway for the Thwaites glacier basin, West Antarctica, Science344 (2014), 735–738.


I would like to say something more detailed about them someday.


The paper by Eric Rignot et al. is freely available—just click on the title. 

Unfortunately, you can’t read the other paper unless you have a journal subscription. Sumner’s article which I quoted is also not freely available. I wish scientists and the journal Science took more seriously their duty to make important research available to the public.


Here’s a video that shows Pine Island Glacier, Thwaites Glacier and some other nearby glaciers:


Wednesday, 29 July 2015

The disintegrating Arctic - 07/28/2015

Storms Over Arctic Ocean


28 July, 2015


The image below shows sea surface temperature anomalies over the Arctic on July 27, 2015.


The image below shows sea surface temperature anomalies on July 28, 2015.


There is a growing chance that the sea ice will collapse over the next few weeks, due to heavy melting and storms speeding up the flow of sea ice out of the Arctic Ocean into the Atlantic Ocean.

An example of such storms is shown on the animation below. This is a forecast for July 31, 2015, showing cyclonic winds at the center of the Arctic Ocean, with strong winds moving sea ice down 
Fram Strait


The above situation alone is not likely to trigger sea ice collapse. It is more likely to be short-lived. However, there is a growing possibility for such storms to emerge and drive the melting sea ice out of the Arctic Ocean into the Atlantic Ocean.

As the situation in the Arctic further deteriorates, feedbacks can be expected to kick in with growing strength.

One of these feedbacks is the growing amount of heat that will have to be absorbed by the Arctic Ocean as the sea ice disappears, and that will accelerate warming of the water of the Arctic Ocean.

Another feedback is a changing jet stream (as illustrated in above animation), that can be expected to causing increasingly intense storms over the Arctic to emerge. Such storms can mix down warm surface water all the way to the bottom of the seafloor, especially in the many places where the Arctic Ocean is very shallow. This can in turn cause destabilization of hydrates resulting in huge amounts of methane to be abruptly released from the seafloor.

Methane itself is yet another feedback that will accelerate warming in the Arctic, in turn threatening to trigger further methane releases in a spiral of self-reinforcing positive feedback loops.

The situation is dire and calls for comprehensive and effective action as discussed at the 
Climate Plan


Saturday, 11 April 2015

The rapidly-melting Arctic

At Start of 2015 Melt Season, Arctic Sea Ice is in a Terrible State


10 April, 2015
Strong Polar Amplification. With human-forced climate change, it’s normally something you’d tend to see during winter time. By spring, the increase in solar radiation in the Mid-Latitudes would tend to force a more rapid pace of warming there. The snow and ice cover, recently refreshed by winter, would be at highest annual albedo at winter’s end. That high albedo would create a warming lag from the upper Latitudes. The resulting increase in temperature differential would then tend to reinforce the Jet Stream — giving it a strengthening kick and providing the polar north with a kind of ephemeral haven. At least for a brief window during early spring time.
Not so with 2015. This Spring, the Jet has been a basketcase. A mess of meanders like a river finding its way through a wetland prior to joining the sea. Strong south to north flows have persisted over the North Atlantic and well into Western Siberia. These meridional patterns have repeatedly delivered heat into the Arctic — particularly through the oceanic gateway between Greenland and the Yamal region of Russia.
Unusually Warm Spring for The Arctic

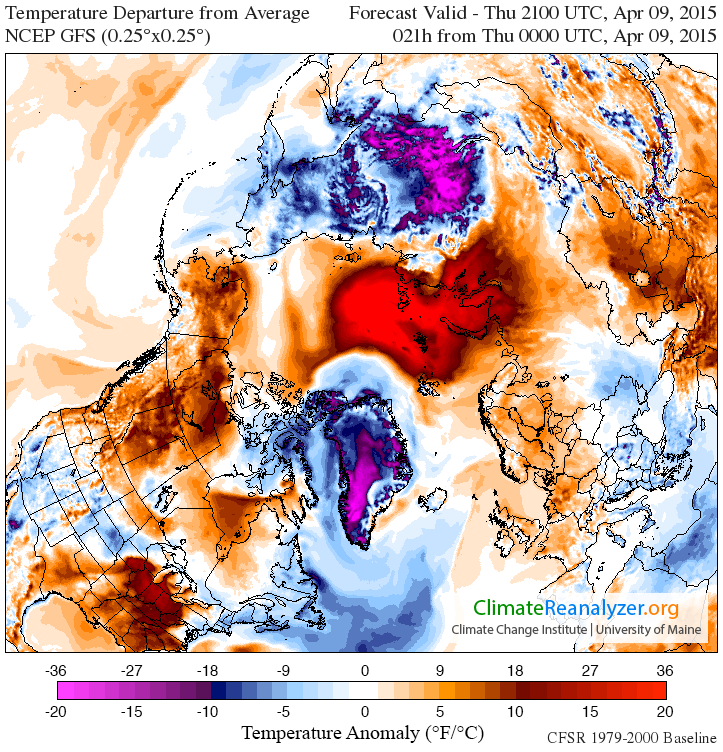
For the past week, this pattern intensified and the result is a bulge of extreme heat extending on toward the North Pole in the broad zone between Greenland and Northwest Siberia:
21 h Thursday April 9 Arctic T Anomaly Map
In the above image, provided by Climate Reanalyzer, we find a classic polar vortex disruption type pattern (a rather odd event for April, as both polar amplification and vortex formation have both tended to fade by this seasonal period) in which the cold core is essentially ripped in half by warm air invading from the south. In this case, we see a massive warm air flood emerging from Eastern Europe, Western Russia and the North Atlantic riding up and over the polar zone across a warm frontal boundary. This greater warm air influx is joined with a lesser one emerging off the Ridiculously Resilient Ridge pattern off the US and Canadian West Coasts and flooding up over Alaska and the Mackenzie Delta region of Canada.

The cold cores are thus shoved aside. One has fled to a dubious haven over Eastern Siberia. The second has taken a stronger hold over Greenland. For the Greenland region, surface winds have encircled the new, displaced, cold pool, generating a temperature boundary that is sharply visible in the anomaly map. The dangerous weather-wrecking “Storms of My Grandchildren” Greenland melt and polar amplification pattern — featuring a Greenland cold pocket beside a meltwater-cooled North Atlantic zone surrounded by angrily warming regions.
High anomaly departures in the range of 15-20+ degrees C above average cover about 1/3 of the high Arctic region above 80 degrees North Latitude. Laptev, Kara, Barents and the Arctic Ocean proper are all included in the heat bulge. Temperatures in this zone today spiked to near or above the point at which sea ice melts at the surface (-2.5 C) with temperatures in the Kara in the 0 to -2 C range, temperatures in the Laptev in the -2 to -4 C range and temperatures within 100 miles of the pole hitting around -3.8 C. For this region, these are readings more typical to June or even July.
Record Low Start to Melt Season

The impacts to sea ice have been nothing short of unprecedented for early season melt.
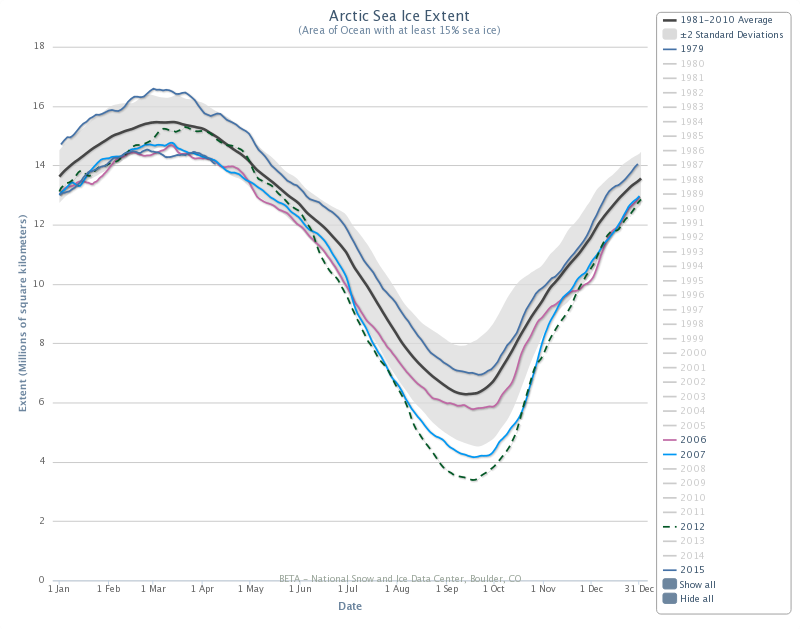
In the extent measure we find that for the past month running we have been at or near new record lows. Over recent days, consistent with the strong surge of polar heat amplification, extent values have again plummeted past previous record low values. Dropping by more than 50,000 square kilometers for each day in the April 6-8 timeframe, the melt rate is exceedingly steep for this time of year. With April 8 achieving a new record low extent of 14,073,000 square kilometers — 95,000 square kilometers below the previous record low of 14,168,000 set in 2006.

Sea Ice Extent April 9
(Arctic Sea Ice Extent as recorded by NSIDC through April 9 of 2015. We are at the descending curve of the upper arc on the left in the image. The bottom dark blue line represents 2015 sea ice extent. The light blue and pink lines are 2007 and 2006 [previous record low years for springtime]. The upper dark blue line represents 1979 sea ice extent. The dotted green line represents 2012. Note how the 2015 line has consistently trended in record low range during the past month. Image source: NSIDC.)

As heat and sunlight build in this record low ice extent environment, greater stretches of dark, open water will trap more sunlight. This will tend to have a heat amplifying effect — pushing for greater ice losses as melt season gains traction. Weather trends will tend to have an impact as well. And Arctic Oscillation (AO) is expected to again hit a strongly positive level over the next couple of days — providing further melt pressure to sea ice already at record lows. Wind patterns have also tended to facilitate ice export through the Fram, Nares and Bering Straits this year. Given a predicted continuation of these conditions, the long term-trend seems to be melt-favorable through end of April.
Kara Melting Early, Beaufort Cracking Up

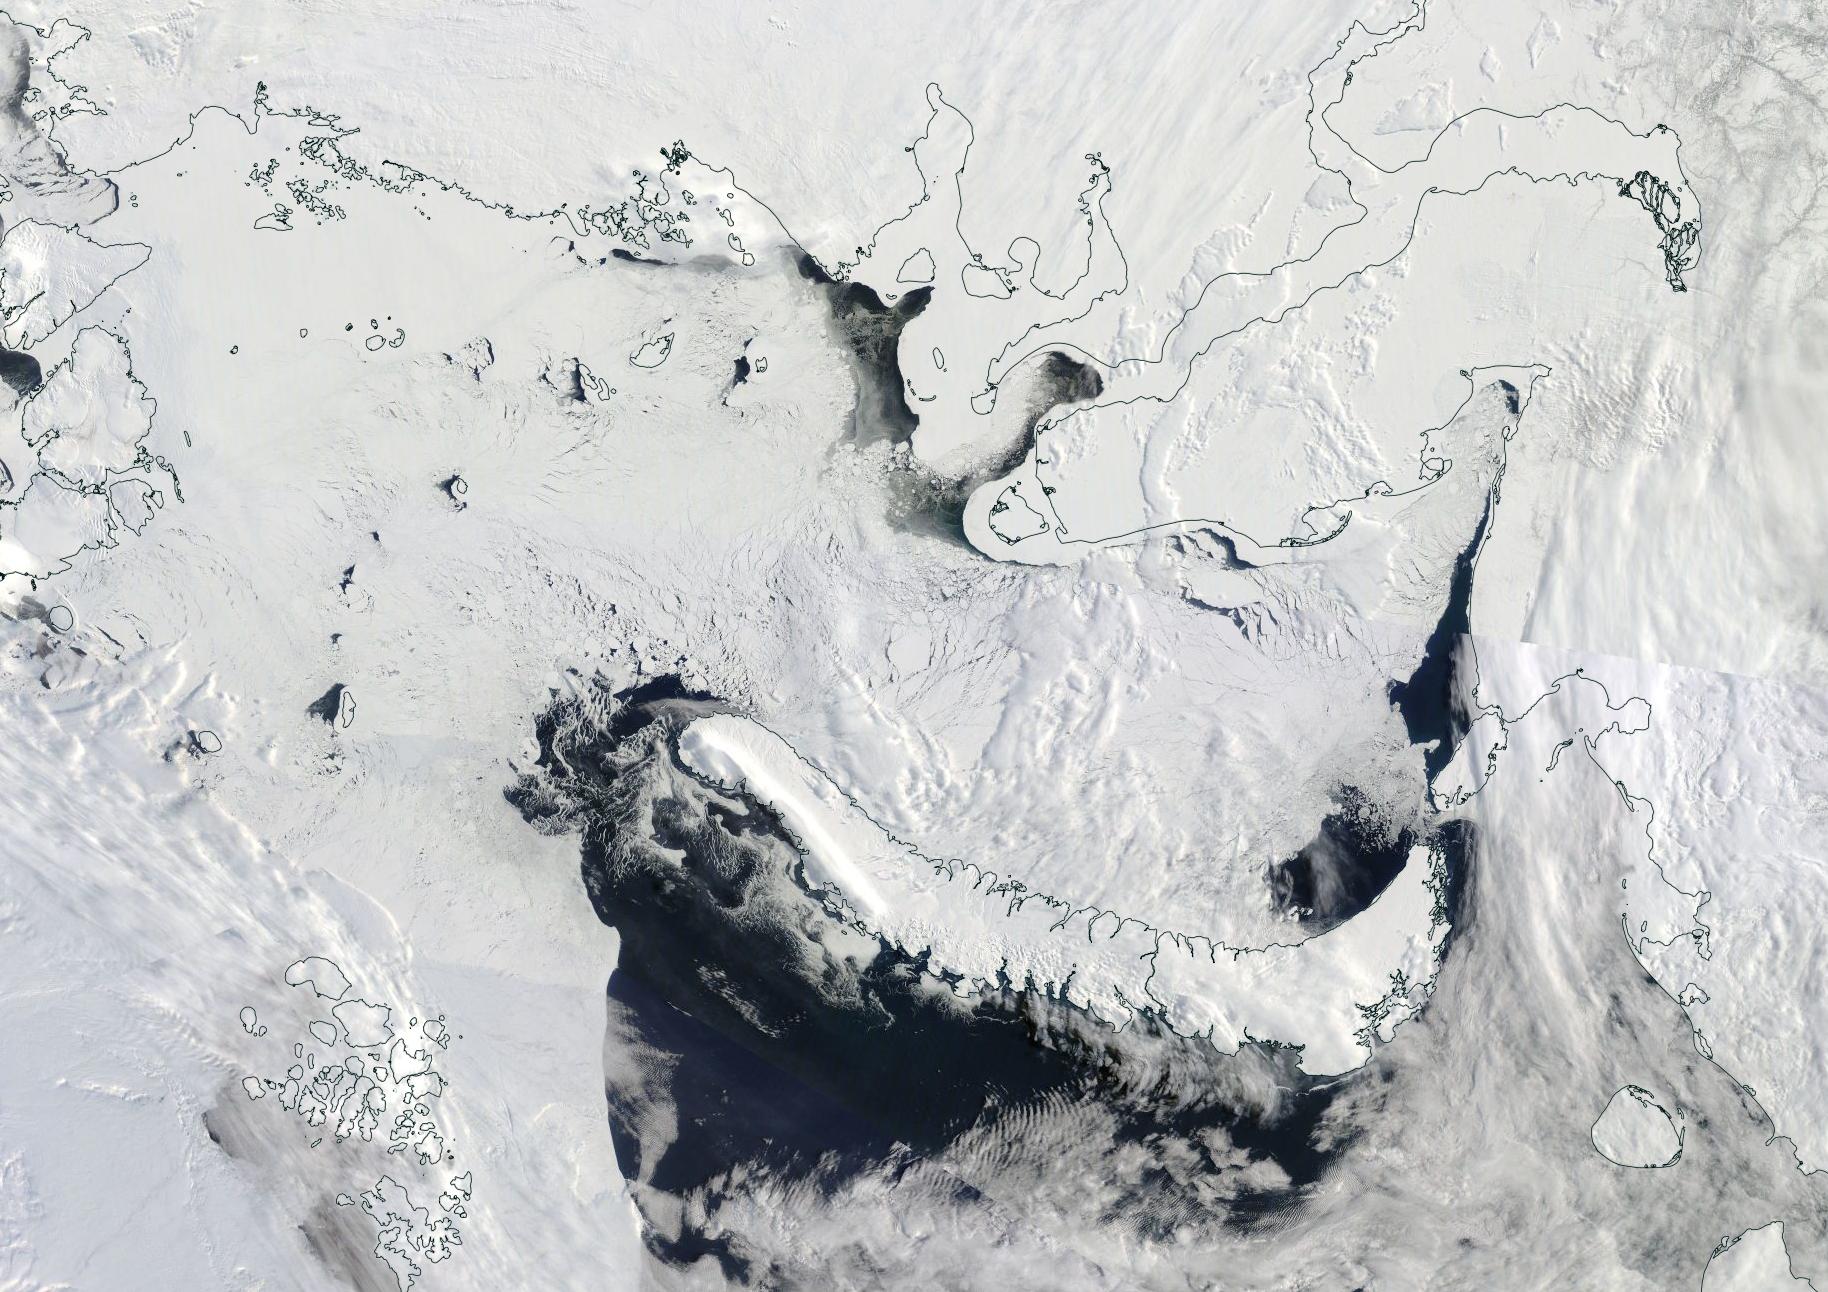
In the satellite shot the impacts of these much warmer than normal Arctic conditions are clearly visible. Particularly, the Kara Sea near Northwestern Siberia and the Beaufort are showing signs of melt stress and ice fragility.
For the Kara, melt is proceeding well in advance of typical seasonal thaw. Large polynyas have opened up even as the ice edge has retreated. Much of the ice in this zone appears broken, thin, and disassociated — making it vulnerable to both increasing solar radiation and to the periods of more intense warmth to come.
Kara Sea April 9
(The Kara Sea showing reduced sea ice coverage on April 9 of 2015. Image source: LANCE-MODIS.)

With 2015 showing a tendency for strong south to north air flows in this region, the Kara continues to be at risk of early melt through spring and into start of summer.
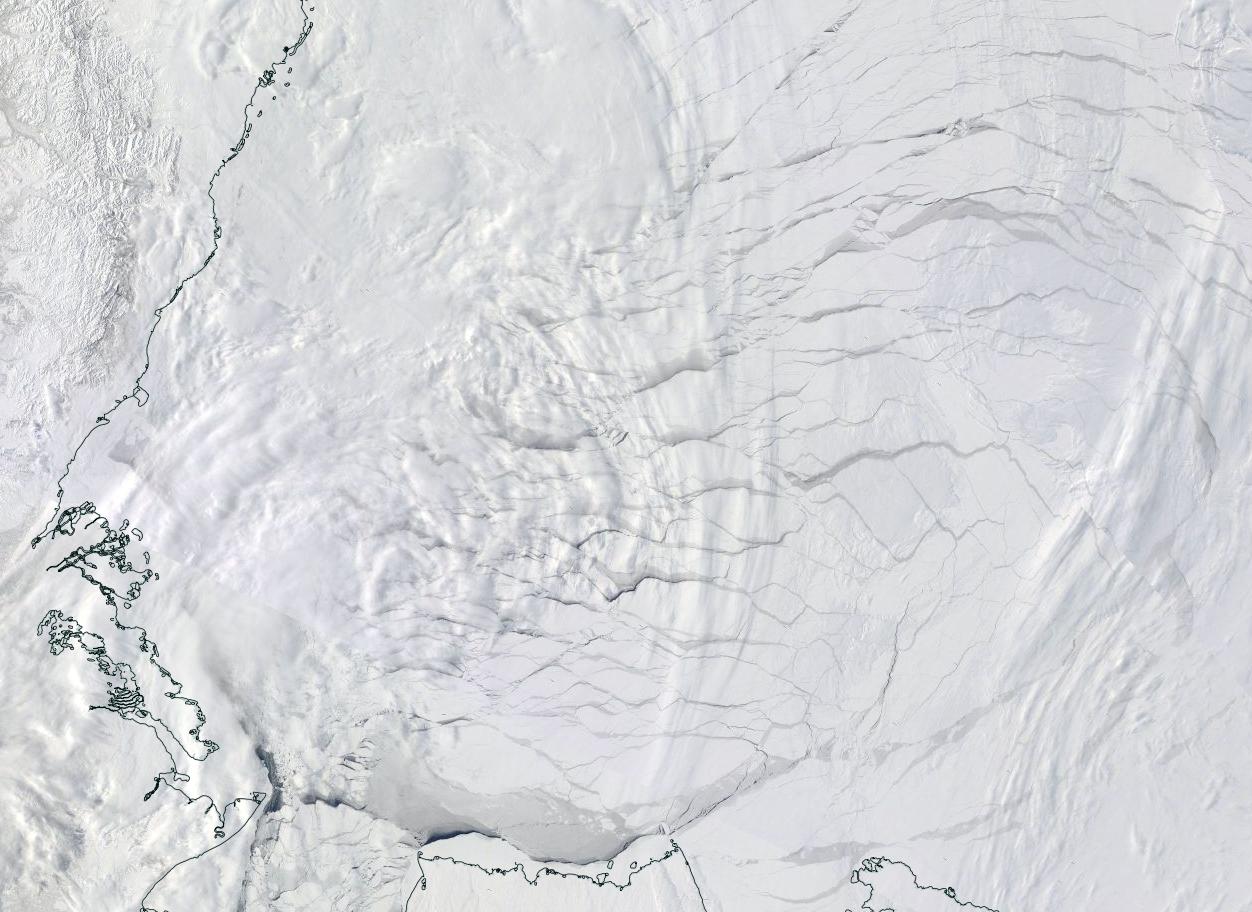
But perhaps more disturbing is an ongoing and widespread break-up of sea ice in the Beaufort. Starting in late March and continuing on through April, very large cracks have opened up throughout the Beaufort Sea. Given that air temperatures remain in a range cold enough to freeze surface water (-12 to -25 C), the resulting gaps have quickly frozen. However, this crack-up is occurring directly at melt season start. Warmth is building, the sun is at an ever higher angle, and the lower albedo cracks may well serve to capture more heat in an already vulnerable region. In addition, temperatures in the Mackenzie River Delta — a region that, when thawed, will dump above freezing water into the already broken Beaufort — are approaching the melt point (-4 C readings today and 0 C for widespread thaw).
Beaufort Breaking Up
(Large cracks and polynyas throughout the Beaufort Sea on April 10 of 2015. Left side of frame is somewhat covered by cloud, but a large polynya [partially frozen] is visible through the coverage. Image Source: LANCE MODIS.)

These cracks are very extensive and include multiple large breaks. A scene reminiscent of the winter 2013 break-up. But the current timing at melt season start is far more likely to enhance ice vulnerability as spring progresses toward summer. Also, the fragile behavior of this broad section of Beaufort ice illustrates how thin sea ice in this region has become even as it hints at the potential that warm water (which is increasingly prevalent at depth throughout the Arctic Ocean) may be upwelling to melt some of this sea ice from below.
Together, the warm air influx and very high temperature anomalies, the rapid melt at the edge zones, the record low extent levels, and the massive crack-up ongoing in the Beaufort all point to extreme sea ice weakness at the start of melt season. With weather patterns remaining neutral to melt-favorable over the next few weeks and with winds favoring export through the Fram, Bering and Nares, risks remain high that Arctic sea ice will remain in record low territory over the coming weeks. Sea ice fragility in certain regions, especially the Beaufort, also bear watching for possible unpleasant surprises.
Links: