Antarctica’s
Southern Ocean May No Longer Help Delay Global Warming
Researchers
are studying the ocean’s carbon dynamics to improve predictions for
sea level and temperature rise
16
November, 2016
Joellen
Russell wasn’t prepared for the 10-metre waves that pounded her
research vessel during an expedition south of New Zealand. “It felt
like the ship would be crushed each time we rolled into a mountain of
water,” recalls Russell, an ocean modeller at the University of
Arizona in Tucson. At one point, she was nearly carried overboard by
a rogue ave.
But
what really startled her was the stream of data from sensors
analysing the seawater. As the ship pitched and groaned, she realized
that the ocean surface was low in oxygen, high in carbon and
extremely acidic—surprising signs that nutrient-rich water
typically found in the deep sea had reached the surface. As it turned
out, Russell was riding waves of ancient water that had not been
exposed to the atmosphere for centuries.
Although
controversial when she encountered it back in 1994, this powerful
upwelling is now recognized as a hallmark of the Southern Ocean, a
mysterious beast that swirls around Antarctica, driven by the world’s
strongest sustained winds. The Southern Ocean absorbs copious amounts
of carbon dioxide and heat from the atmosphere, which has slowed the
rate of global warming. And its powerful currents drive much of the
global ocean circulation.
The
hostile conditions have kept oceanographers at bay for decades, but a
new era of science is now under way. Researchers from around the
world are converging on the region with floats, moorings, ships,
gliders, satellites, computer models and even seals fitted with
sensors. The goal is to plug enormous data gaps and bolster
understanding of how the Southern Ocean—and the global
climate—functions. Doing so could be key to improving predictions
of how quickly the world will warm, how long the Antarctic ice sheet
will survive and how fast sea levels will rise.
“It’s
been amazing to see this explosion of information,” says Arnold
Gordon, an oceanographer at Lamont-Doherty Earth Observatory in
Palisades, New York, who led some of the early Southern Ocean surveys
in the 1960s. “New technologies are allowing us access to these
remote areas, and we are far less dependent on driving a ship through
the sea ice.”
Already,
initial data from an array of ocean floats suggest that upwelling
waters could be limiting how much CO2 the Southern Ocean absorbs each
year. This raises new questions about how effective these waters will
be as a brake on global warming in decades to come.
“The
Southern Ocean is doing us a big climate favour at the moment, but
it’s not necessarily the case that it will continue doing so in the
future,” says Michael Meredith, an oceanographer with the British
Antarctic Survey in Cambridge, UK. Meredith is heading a series of
expeditions over the next five years to help document the uptake of
heat and carbon. “It really is the key place for studying these
things.”
TRACKING
CARBON
The
mysteries of the Southern Ocean have beckoned explorers for
centuries, but the unique geography of the region makes it a perilous
place for ships. There are no landmasses to tame the winds and waves
that race around the planet at 60° S. And the ice surrounding
Antarctica is notorious for engulfing wayward vessels, including
Ernest Shackleton's Endurance in 1915.
Scientists
only started to realize how important the region is for controlling
global climate in the 1980s, when several groups were trying to
explain what had caused atmospheric CO2concentrations to drop by
about one-third during the last ice age and then later rise.
Oceanographer Jorge Sarmiento at Princeton University in New Jersey
realized that changes in circulation and biology in the Southern
Ocean could help to cool and warm the planet.
Three
decades later, Sarmiento is leading an effort to gather the first
real-time data on the chemical and biological processes that govern
carbon in the Southern Ocean. The US$21-million Southern Ocean Carbon
and Climate Observations and Modeling Project (SOCCOM) has already
deployed 51 of a planned 200 robotic floats that bob up and down in
the upper 2,000 metres of the Southern Ocean. Building on the global
Argo array, which consists of more than 3,700 floats collecting
temperature and salinity data, the SOCCOM floats also measure oxygen,
carbon and nutrients.
With
the new data, Sarmiento and his team can test their models and refine
estimates of how CO2moves between the seas and the sky. Indirect
evidence suggests that the Southern Ocean is a net carbon sink and
has absorbed as much as 15% of the carbon emissions emitted by
humanity since the industrial revolution. But at some times of year
and in specific places in this region, carbon-rich surface waters
release CO2 into the atmosphere.
Now,
researchers are getting some of their first glimpses in near-real
time of what happens in the Southern Ocean, particularly in winter.
“Right off the bat, we are seeing CO2 fluxes into the atmosphere
that are much greater than we had estimated before,” Sarmiento
says. “It’s just revolutionary.”
The
unpublished analysis is based on just 13 floats that have been in the
water for at least a year, so the question now is whether the higher
CO2 emissions during winter represent larger trends across the entire
Southern Ocean.
“It’s
pretty tantalizing,” says Alison Gray, a postdoctoral researcher at
Princeton who is leading the study. “It would imply that
potentially there is a much weaker carbon sink in the Southern Ocean
than has been estimated.”
Hints
of something similar have been seen before. In 2007, a team led by
Corinne Le Quéré, now director of the Tyndall Centre for Climate
Change Research in Norwich, UK, published a study inScience
indicating that the rate of carbon uptake by the Southern Ocean
decreased between 1981 and 2004. The authors blamed the changes on
the winds that encircle the Antarctic continent.
The speed of those
winds had increased during that time, probably as a result of the
hole in the stratospheric ozone layer over Antarctica and possibly
because of global warming. Stronger winds are better able to pull up
deep, ancient water, which releases CO2 when it reaches the surface.
That would have caused a net weakening of the carbon sink.
If
that trend were to continue, atmospheric CO2 levels would rise even
faster in the future. However, a study in Science last year found
that the carbon sink started to strengthen in the early 2000s.
Le
Quéré says it’s unclear whether that rise in CO2 absorption is a
return to normal or a deviation from the long-term weakening of the
sink. Regardless, she says, it’s now clear that the Southern Ocean
might be much more fickle than scientists thought.
SOCCOM
floats will probably help researchers to answer these questions, but
it could be years before they can say anything concrete about trends.
Nor is Le Quéré convinced that the new network of floats will
provide enough detail. In a paper published in July, she found that
models of carbon uptake by the Southern Ocean depend strongly on
assumptions about the structure of the food web there. She says that
climate scientists need to improve their understanding of the type
and timing of phytoplankton and zooplankton blooms if they are going
to get their climate projections right. “In my view, that's the
next frontier,” she says.
WARMING
WATERS
Carbon
is only part of the story in the Southern Ocean. Scientists are also
beginning to pin down what happens to all the heat that gets absorbed
there.
The
Southern Ocean is the starting point for a network of currents that
carry water, heat and nutrients throughout the ocean basins. Near
Antarctica, surface waters normally grow cold and dense enough to
sink to the bottom of the ocean, forming abyssal currents that hug
the sea floor as they flow north into the Pacific, Atlantic and
Indian oceans.
Much
of what scientists know about these currents comes from ship surveys
conducted every decade or so since the early 1990s. In 2010, when
researchers analysed data from the surveys, they found a pronounced
warming trend in abyssal waters, which were somehow absorbing about
10% of the excess heat arising from global warming.
The
level of warming in the deep ocean came as a surprise, and
researchers have proposed several explanations that centre on the
Southern Ocean. One factor could be that surface waters around
Antarctica have become less salty, in part because of an increase in
summer rainfall over the ocean. Fresher surface water is less dense,
so that change would choke the supply of cold water sinking to the
sea floor to feed the bottom currents. “The deep water warms up
because it’s not getting as much cold-water replenishment,” says
Gregory Johnson, an oceanographer with the National Oceanic and
Atmospheric Administration (NOAA) in Seattle, Washington, who
co-authored the 2010 analysis.
An
as-yet-unpublished analysis, based on initial data from the third
round of ship surveys, finds similar trends, but researchers have
longed for more frequent measurements to provide a fuller picture.
That could happen if a proposed international project moves forward.
Called Deep Argo, this would be an array of floats that regularly
dive all the way to the bottom of the ocean. Johnson is involved in a
US consortium that is testing 13 floats in a basin off the coast of
New Zealand, and another nine south of Australia.
Others
are using moorings to monitor deep water flows. Since 1999, Gordon
has maintained an array of moorings in the Weddell Sea, one of the
main areas where cold surface waters sink to form ocean bottom
currents. He has seen the deep water growing less salty in some
areas, but the long-term trends are not clear.
“We
are really only scratching the surface of how bottom waters are
changing, and how that is impacting the large-scale global ocean
circulation,” he says.
ALONG
THE EDGE
In
January 2015, oceanographers aboard the Australian icebreaker Aurora
Australis were cruising off the coast of Antarctica when they were
presented with a unique opportunity. Following a crack in the sea
ice, they were able to reach the edge of the Totten Glacier, one of
the biggest drainage points for the East Antarctica ice sheet. No
other expedition had reached within 50 kilometres of the glacier.
The
team deployed floats and gliders into the waters around and
underneath the glacier, which is 200 metres thick at its front edge.
What they found came as a shock. The water at the front of the
glacier was 3 °C warmer than the freezing point at the base of the
glacier.
“We
always thought Totten was too far away from warm water to be
susceptible, but we found warm water all over the shelf there,”
says Steve Rintoul, an oceanographer at the Antarctic Climate and
Ecosystems Cooperative Research Centre in Hobart, Australia.
Scientists
had already shown that warm-water currents are undercutting the West
Antarctic ice sheet in many areas along the peninsula where the
glaciers extend into the ocean. But Rintoul says that this expedition
provided some of the first hard evidence that these same processes
are affecting East Antarctica, raising new questions about the
longevity of the mammoth ice sheets that blanket the continent.
There
is no clear answer yet for what is driving the warming of these
near-surface currents. Some explanations invoke changes in the winds
over the Southern Ocean and the upwelling of warm waters. Others
focus on fresher surface waters and an expansion of sea ice in some
areas. The combination of extra sea ice and fresher surface waters
could create a kind of cap on the ocean that funnels some of the
warmer upwelling water towards the coast.
“Every
scientist, including me, has their favourite explanation,” Gordon
says. “But that’s how science works: the more you observe, the
more complicated it gets.”
Finding
the answers may require recruiting some of Antarctica’s permanent
residents. Meredith’s team at the British Antarctic Survey plans to
equip Weddell seals with sensors so that the animals can collect
water measurements as they forage below the sea ice along the
continental shelf. This zone has particular importance because it is
precisely where cold water begins its descent into the abyss.
“The
processes that happen in that shelf region are very important on a
global scale, but measuring them is very difficult,” Meredith says.
“The seals sort of transcend that barrier.”
The
Weddell seals are just one component of the expedition’s arsenal.
The team will also send autonomous gliders under the sea ice on
preprogrammed routes to collect temperature and salinity data down to
depths of 1,000 metres. Measurements taken from ships will help fill
in the picture of what happens in this crucial region around
Antarctica—and how it relates to the rest of the global ocean
circulation.
Getting
the data is only half the challenge. Ultimately, scientists need to
improve their models of how currents transport heat, CO2 and
nutrients around the globe. Even armed with better measurements,
results suggest that modellers have a way to go.
An
analysis of data from the ship surveys suggests that upwelling ocean
water does not rise in a simple pattern near Antarctica. Rather, it
swirls around the continent one and a half times before reaching the
surface. And Sarmiento’s team at Princeton found that only the
highest-resolution models could accurately capture that behaviour.
Sarmiento says that it could be a while before the models can
simulate what really happens in this region, but he is confident that
day will eventually arrive.
For
Russell, it’s as if scientists are at last lifting the veil on the
Southern Ocean. After she returned from her maiden voyage in 1994,
she turned to modelling because there wasn’t enough data at the
time to quantify the effects of the upwelling she encountered. Today
she has it both ways. Russell is heading the modelling component of
the SOCCOM project, and she is getting more data than she ever dreamt
of.
“It’s
just a wonderful time to be an oceanographer,” she says, “even as
we are carrying out this really scary geophysical experiment on our
planet.”

 Posts


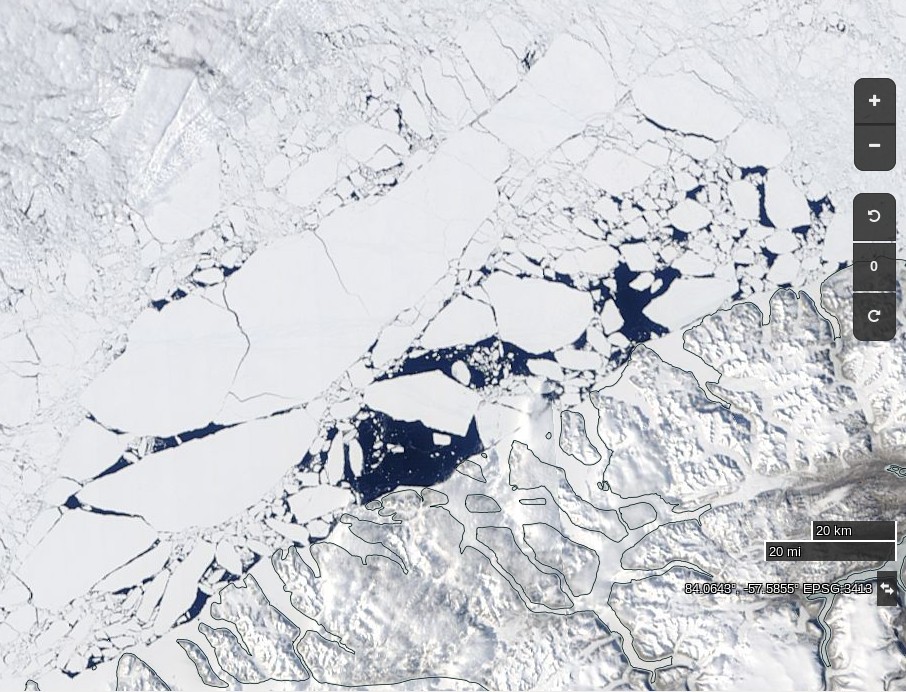 NASA
Worldview “true-color” image of the sea ice north west of
Greenland breaking up onclass="Apple-converted-space" June
2nd 2017
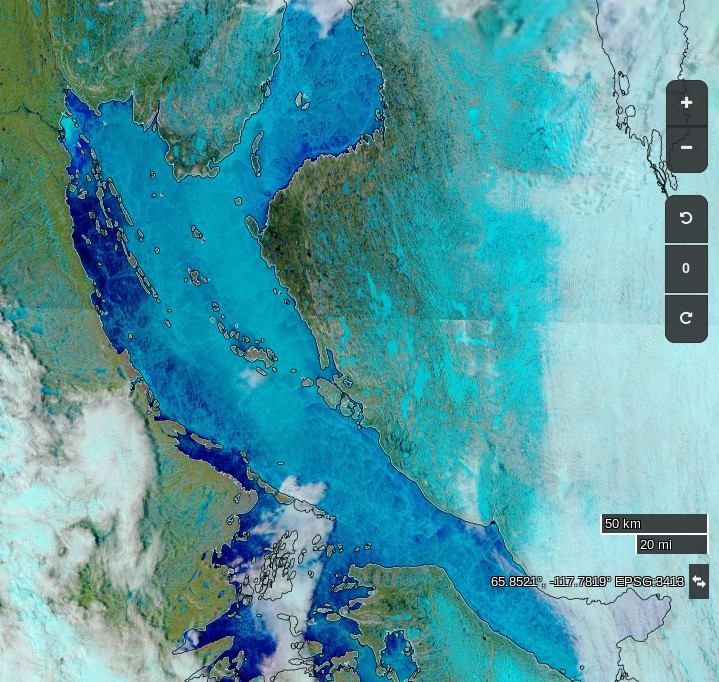 NASA
Worldview “false-color” image of the Coronation Gulf
onclass="Apple-converted-space" June
1st 2017,
derived from the MODIS sensor on the Terra satellite