

Looking at Methane & Arctic & Antarctic Sea Ice with Margo (Oct. 4, 2020)
Subscribe to

 Posts
All Comments
Posts
All Comments
Showing posts with label Antarctic. Show all posts
Showing posts with label Antarctic. Show all posts
Tuesday, 6 October 2020


Saturday, 29 June 2019
A brief look at mid-winter Antarctic ice - 29 June, 2019
A brief look at mid-winter Antarctic ice - 29 June, 2019
Many thanks to Margo for the .GIF.Wednesday, 2 January 2019
CO2 levels go up and up and sea ice levels go down
CO2
emissions keep going up and up
2018. Another year of rising carbon dioxide (CO₂). That is all.
[Animation by http://folk.uio.no/roberan/t/MLO_weekly.shtml …
]
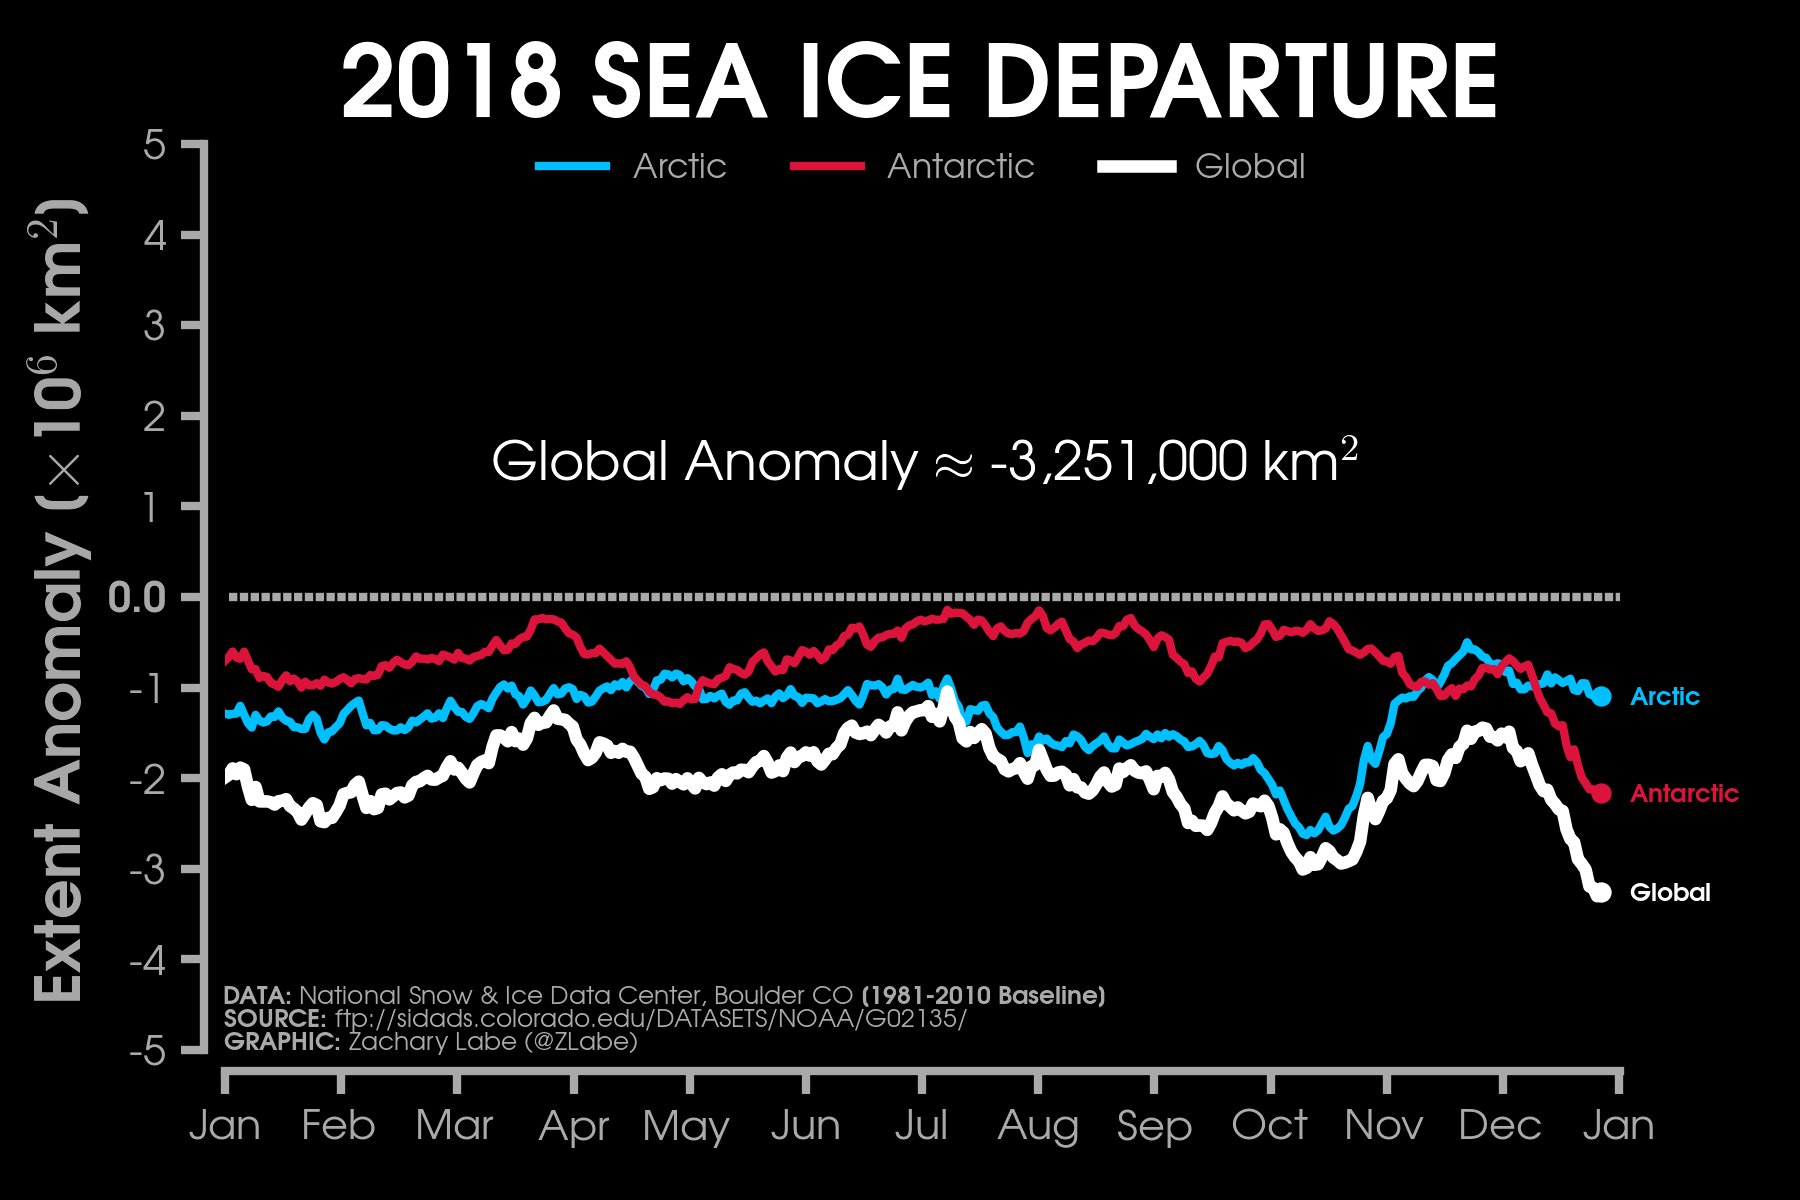
Sea ice ending the year on a negative note, especially for the Antarctic.
Sea ice extents at both poles are more than 1,000,000 km² below average
Friday, 29 September 2017
The differences betweeen Arctic and Antarctic ice
Arctic vs. Antarctic
Because the Arctic and Antarctic are cold, dark, and remote, we often think these two places are nearly the same. However, they are quite different. One notable difference is that polar bears live only in the Arctic, and penguins live only in the Antarctic. But what about the differences in sea ice between the two regions?
Geography
Sea ice differs between the Arctic and Antarctic, primarily because of their different geography. The Arctic is a semi-enclosed ocean, almost completely surrounded by land. As a result, the sea ice that forms in the Arctic is not as mobile as sea ice in the Antarctic. Although sea ice moves around the Arctic basin, it tends to stay in the cold Arctic waters. Floes are more prone to converge, or bump into each other, and pile up into thick ridges. These converging floes makes Arctic ice thicker. The presence of ridge ice and its longer life cycle leads to ice that stays frozen longer during the summer melt. So some Arctic sea ice remains through the summer and continues to grow the following autumn. Of the 15 million square kilometers (5.8 million square miles) of sea ice that exist during winter, on average, 7 million square kilometers (2.7 million square miles) remain at the end of the summer melt season.

These images using satellite-derived sea ice concentration data show average minimum and maximum sea ice during March and September for the Arctic and Antarctic from 1979 to 2000. Seasons are opposite between the Southern and Northern Hemispheres; the South reaches its summer minimum in February, while the North reaches its summer minimum in September. (March is shown for both hemispheres for consistency.) The black circles in the center of the Northern Hemisphere images are areas lacking data due to limitations in satellite coverage at the North Pole.
—Credit: National Snow and Ice Data Center, University of Colorado, Boulder, Colorado.
—Credit: National Snow and Ice Data Center, University of Colorado, Boulder, Colorado.
The Antarctic is almost a geographic opposite of the Arctic, because Antarctica is a land mass surrounded by an ocean. The open ocean allows the forming sea ice to move more freely, resulting in higher drift speeds. However, Antarctic sea ice forms ridges much less often than sea ice in the Arctic. Also, because there is no land boundary to the north, the sea ice is free to float northward into warmer waters where it eventually melts. As a result, almost all of the sea ice that forms during the Antarctic winter melts during the summer. During the winter, up to 18 million square kilometers (6.9 million square miles) of ocean is covered by sea ice, but by the end of summer, only about 3 million square kilometers (1.1 million square miles) of sea ice remain.
Thickness
Because sea ice does not stay in the Antarctic as long as it does in the Arctic, it does not have the opportunity to grow as thick as sea ice in the Arctic. While thickness varies significantly within both regions, Antarctic ice is typically 1 to 2 meters (3 to 6 feet) thick, while most of the Arctic is covered by sea ice 2 to 3 meters (6 to 9 feet) thick. Some Arctic regions are covered with ice that is 4 to 5 meters (12 to 15 feet) thick.
Patterns of Ice Extent
The above images reveal another notable difference in sea ice. The pattern of Antarctic maximum sea ice is roughly symmetric around the pole, forming a circle around Antarctica. In contrast, the Arctic is asymmetric, with much more ice in some longitudes than others. For example, sea ice off the eastern coast of Canada extends south of Newfoundland to 50 degrees north latitude, and ice off the eastern coast of Russian extends to Bohai Bay, China, at about 38 degrees north latitude. Conversely, in western Europe, the northern coast of Norway at 70 degrees north latitude (2,000 kilometers, or 1,243 miles, farther north than Newfoundland or Japan) generally remains ice-free. Ocean currents and winds explain these differences.
In the Antarctic, the currents and winds tend to flow without interruption around the continent in a west-to-east direction, acting like a barricade to warmer air and water to the north. In contrast, the Arctic region north of the Atlantic Ocean is open to the warmer waters from the south, because of the way the ocean currents flow. These warmer waters can flow into the Arctic and prevent sea ice from forming in the North Atlantic. The waters off the eastern coasts of Canada and Russia are affected by cold air moving off the land from the west. The eastern Canadian coast is also fed by southward-flowing cold water currents that make it easier for sea ice to grow.
Snow Cover over Sea Ice
Because the Arctic Ocean is mostly covered by ice and surrounded by land, precipitation is relatively rare. Snowfall tends to be low, except near the ice edge. Antarctica, however, is entirely surrounded by ocean, so moisture is more readily available. Antarctic sea ice tends to be covered by thicker snow, which may accumulate to the point that the weight of snow pushes the ice below sea level, causing the snow to become flooded by salty ocean waters.
Other Differences
Antarctic sea ice does not reach the South Pole, extending only to about 75 degrees south latitude (in the Ross and Weddell Seas), because of the Antarctic continent. However, Arctic sea ice can extend all the way to the North Pole. Here, the Arctic sea ice receives less solar energy at the surface because the sun's rays strike at a more oblique angle, compared to lower latitudes.
Water from the Pacific Ocean and several rivers in Russia and Canada provide fresher, less dense water to the Arctic Ocean. So the Arctic Ocean has a layer of cold, fresh water near the surface with warmer, saltier water below. This cold, fresh water layer typically allows more ice growth in the Arctic than the Antarctic.
Variations in Extent
Both Arctic and Antarctic sea ice extent are characterized by fairly large variations from year to year. The monthly average extent can vary by as much as 1 million square kilometers (386,102 square miles) from the year-to-year monthly average. In some months, the trends in Antarctic ice extent are statistically significant at the 95% level, although small.
According to scientific measurements, both the thickness and extent of summer sea ice in the Arctic have shown a dramatic decline over the past thirty years. This is consisistent with observations of a warming Arctic. This trend is a major sign of climate change in the polar regions and may be an indicator of the effects of global warming. (See Trends in the Environment section).
For more information on current sea ice conditions see the Arctic Sea Ice News & Analysis Web page. To read NSIDC press releases on recent Arctic sea ice minima, see the Arctic Sea Ice Press Announcements Archive on the Arctic Sea Ice News & Analysis Web page.

—Credit: National Snow and Ice Data Center, University of Colorado, Boulder, CO.

—Credit: National Snow and Ice Data Center, University of Colorado, Boulder, CO.
| Summary of differences between Arctic and Antarctic sea ice characteristics | ||
|---|---|---|
| Arctic | Antarctic | |
| Average Maximum Areal Extent | 15,600,000 km2 (6,000,000 mi2) | 18,800,000 km2 (7,260,000 mi2) |
| Average Minimum Areal Extent | 6,500,000 km2 (2,510,000 mi2) | 3,100,000 km2 (1,200,000 mi2) |
| Typical Thickness | ~ 2 m (6 ft) | ~ 1 m (3 ft) |
| Geographic Distribution | Asymmetric | Symmetric |
| Snow Thickness | Thinner | Thicker |
| Trend, 1979-2008 | Significant decrease of 4.4% (~520,000 km2; 201,000 mi2) per decade | Small increase of 1.8% (~219,000 km2; 85,000 mi2) per decade |
Thursday, 10 August 2017
Rain in Arctic and Antarctic
It
is raining at both Poles
This
is from Paul Beckwith.

These
maps show that it is snowing in the Antarctica.
If you look carefully
there are areas where it is RAINING. That is Antarctica in winter!!

You
can see also that it is raining in the Arctic which, will, together
with warm temperatures, ocean currents and wind be leading to further
destruction of ice.
And here are the jetstream winds in the southern hemisphere


Thursday, 22 June 2017
The "mystery" of Antarctic sea ice extent
Is
it really such a mystery? Antarctic ice melted to unprecedented
extent during the summer and has now returned to previous highs.
That
seems to indicate that the ice must be thin (it acts in quite
different from Arctic ice).
We also know it is melting from below
ANTARCTIC SEA ICE HIT 35-YEAR RECORD HIGH
Antarctic sea ice has grown to a record large extent for a second straight year, baffling scientists seeking to understand why this ice is expanding rather than shrinking in a warming world.

Antarctic
sea ice extent on September 22 compared to 1981-2010 median depicted
by orange curve (NSIDC)
On
Saturday, the ice extent reached 19.51 million square kilometers,
according to data posted on the National
Snow and Ice Data Center Web site.
That number bested record high levels set earlier this month and in
2012 (of 19.48 million square kilometers). Records date back to
October 1978.

(NSIDC)
The
increasing ice is especially perplexing since the water beneath the
ice has warmed, not cooled.
“The
overwhelming evidence is that the Southern Ocean is warming,”
said Jinlun
Zhang,
a University of Washington scientist, studying Antarctic ice. “Why
would sea ice be increasing? Although the rate of increase is small,
it is a puzzle to scientists.”
In a
new study in
the Journal of Climate, Zhang finds both strengthening and converging
winds around the South Pole can explain 80 percent of the increase in
ice volume which has been observed.
“The
polar vortex that swirls around the South Pole is not just stronger
than it was when satellite records began in the 1970s, it has more
convergence, meaning it shoves the sea ice together to cause
ridging,” the study’s
press release explains.
“Stronger winds also drive ice faster, which leads to still more
deformation and ridging. This creates thicker, longer-lasting ice,
while exposing surrounding water and thin ice to the blistering cold
winds that cause more ice growth.”
But
no one seems to have a conclusive answer as to why winds are behaving
this way.
“I
haven’t seen a clear explanation yet of why the winds have gotten
stronger,” Zhang
told Michael Lemonick of
Climate Central.
Some point
to stratospheric ozone depletion,
but a new
study published
in the Journal of Climate notes that computer models simulate
declining – not increasing – Antarctic sea ice in recent decades
due to this phenomenon (aka the ozone “hole”).
“This
modeled Antarctic sea ice decrease in the last three decades is at
odds with observations, which show a small yet statistically
significant increase in sea ice extent,”says
the study,
led by Colorado State University atmospheric scientist Elizabeth
Barnes.
Monday, 19 June 2017
Extreme weather and abrupt climate change report - 06/18/2017
Extreme
weather and abrupt climate change report
This latest edition of Radio Eco Shock includes a discussion with Paul Beckwith with the latest news as well as with Pavel Serov, a CAGE scientist on pingos and methane hydrates.
Incredible
heat records, Biblical downpours not reported. Candian climate
scientist Paul Beckwith & Alex get it on the record. Plus from
new science from Norway. Bright young mind Pavel Serov on Arctic
sea-bed methane risks & rewards.
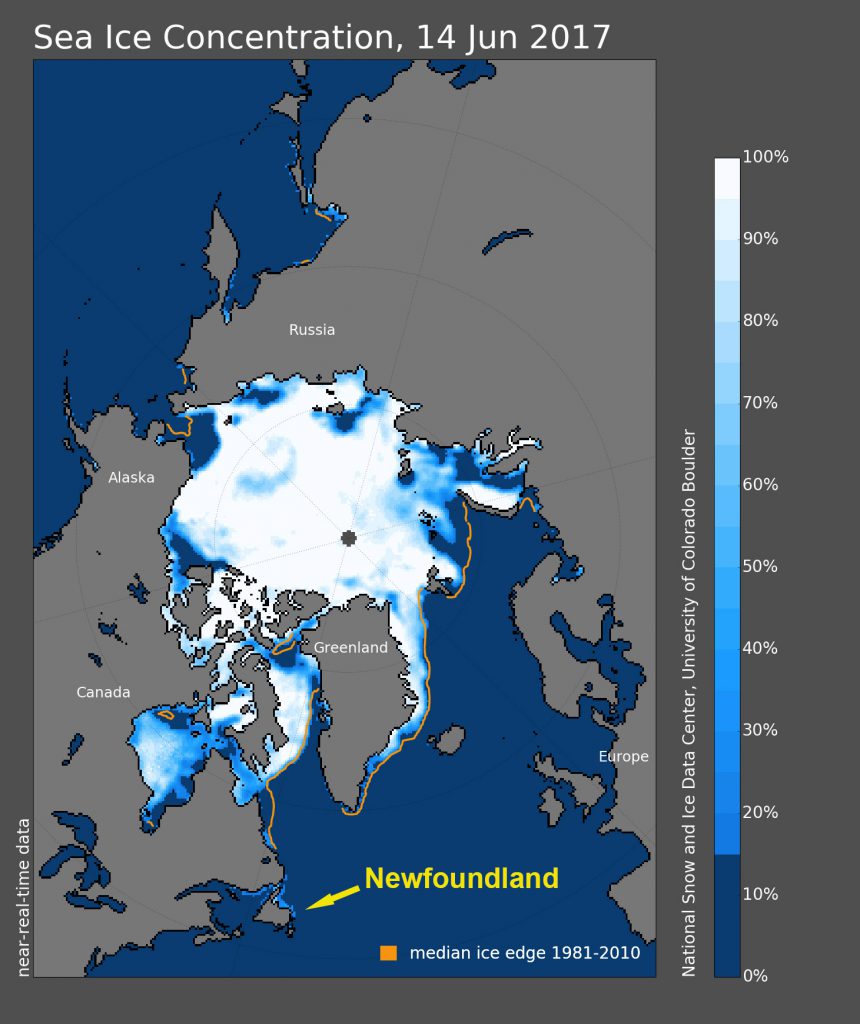
See just how little multi-year ice there is
Arctic Sea Ice Age - September 2015 to May 2017




See just how little multi-year ice there is
Arctic Sea Ice Age - September 2015 to May 2017
Here are some of the main headlnes.
May Was Earth's Second-Warmest in 137 Years; Only 2016 Was Hotter
May Was Earth's Second-Warmest in 137 Years; Only 2016 Was Hotter

NASA's
Goddard Institute for Space Studies calculated the Earth's mean
temperature over land and water in May was 0.88 degrees Celsius above
the 1951-1980 average, second only to May 2016's 0.93 degree Celsius
departure from average. May 2017 beat out May 2014 by just 0.01
degrees Celsius for the second-place ranking.
This
is the fifth month so far this year to rank among the top three
warmest on record for each respective month. February, March and
April 2017 ranked as second-warmest, while January 2017 finished in
third place.
The
largest May warm temperature anomalies were in western Europe,
northern Africa, Asia, eastern South America, northern Alaska,
northern Canada and near Antarctica. Northern Russia was the most
significantly cooler-than-average location.
Scorching May continues decades-long streak of above-average months, and global warming is only accelerating

But before our millennial readers start writing us that the term generally refers to people born starting in the early 1980s, consider this: July 1985 is only a cooler-than-average month if you use the base period 1951 to 1980, as NASA does for its data. But humans were warming the planet by burning fossil fuels long before then — the Industrial Revolution began over two centuries ago.
So when you use an 1880 to 1899 baseline to reflect the earlier warming, as Schmidt does in the graph above, you see we have to go back much further to find a colder than average year — or month.
Climate Central looked at the monthly data using the earlier baseline and found that “if you were born after December 1964, you’ve never experienced a month cooler than average on this planet.”


From
Antarctica, where a research expedition was canceled due to rising
temperatures, to the Arctic Sea, where ice continues to melt, the
effects of climate change are being felt around the globe. In the
United States, temperatures are rising and coastlines are
disappearing. One of the areas that has been affected the most is
Louisiana, the coastline of which has been in danger for years.
According to a new study reported on by the New Orleans
Times-Picayune, the danger is greater than anyone realized

It’s
common knowledge that the coast of Louisiana is quietly sinking into
the balmy Gulf waters. But new research suggests we may have been
underestimating how quickly it’s happening.
A
new paper, published Wednesday in the Geological Society of America’s
bulletin GSA Today, includes an updated map of the Louisiana
coastline and the rate at which it’s sinking into the sea, a
process scientists call “subsidence,” which occurs in addition to
the climate change-caused process of sea-level rise. The new map
suggests that, on average, the Louisiana coast is sinking at a rate
of about 9 millimeters, or just over a third of an inch, per year —
a faster rate than previous studies have suggested, according to the
authors.
Temperature
changes around the globe are pushing human pathogens of all kinds
into unexpected new areas, raising many new risks for people.

The
grasslands of U.S. Great Plains have seen one of the sharpest
increases in large and dangerous wildfires in the past three decades,
with their numbers more than tripling between 1985 and 2014,
according to new research.
The
new study, published in the journal Geophysical Research Letters,
found that the average number of large Great Plains wildfires each
year grew from about 33 to 117 over that time period, even as the
area of land burned in these wildfires increased by 400 percent.
A
dangerously intense heat wave will grip the Southwest U.S. this
weekend and may persist through next week. The NWS has already
plastered much of the region with excessive heat warnings. A strong
ridge of high pressure, expected to rank among the Southwest's
hottest on record at upper levels, will pave the way for this
prolonged heat wave. The all-time hottest surface temperature records
for Las Vegas, Phoenix, Tucson and Needles may be challenged, as
temperatures soar to 115° - 125° Sunday through Thursday next week.
The most intense heat is expected Monday through Wednesday, with 120°
predicted by Weather Underground for Phoenix on Tuesday. Extreme heat
will also extend northwest across the highly populated Central Valley
of California.
According
to wunderground weather historian Christopher C. Burt, Phoenix has
only reached 120° three times at its official NWS site (Sky Harbor
Airport):
122°
(June 26, 1990)
121°
(July 28, 1995)
120°
(June 25, 1990)

Scientists
have documented a recent, massive melt event on the surface of highly
vulnerable West Antarctica that, they fear, could be a harbinger of
future events as the planet continues to warm.
In
the Antarctic summer of 2016, the surface of the Ross Ice Shelf, the
largest floating ice platform on Earth, developed a sheet of
meltwater that lasted for as long as 15 days in some places.

Antarctica
is unfreezing. In the past few months alone, researchers have
chronicled a seasonal
waterfall,
widespread networks of rivers and melt
ponds and
an iceberg the size of Delaware on the brink
of breaking away from
the thawing landscape.
A
new study published
in Nature Communications only
adds to the disturbing trend of change afoot in Antarctica.
Researchers have documented rain on a continent more known for snow
and widespread surface melt in West Antarctica last summer, one of
the most unstable parts of a continent that’s already being eaten
away by warm
waters below the ice.
Rise
in tourism and warmer climate bring house flies – and the growth of
mosses in which they can live
Antarctica’s
pristine ice-white environment is going green and facing an
unexpected threat – from the common house fly. Scientists say that
as temperatures soar in the polar region, invading plants and
insects, including the fly, pose a major conservation threat.
More
and more of these invaders, in the form of larvae or seeds, are
surviving in coastal areas around the south pole, where temperatures
have risen by more than 3C over the past three decades. Glaciers have
retreated, exposing more land which has been colonised by mosses that
have been found to be growing more quickly and thickly than ever
before – providing potential homes for invaders. The process is
particularly noticeable in the Antarctic peninsula, which has been
shown to be the region of the continent that is most vulnerable to
global warming.
Earthquake Causes ATLANTIC TSUNAMI Greenland Hit

Portugal
has declared three days of national mourning as the country comes to
terms with a devastating fire that swept through the center of the
nation, killing at least 62 people and injuring 59 others. This drone
footage shows the scale of the devastation:
Huge forest fires in Portugal have killed more than 60 people.
Many died in their cars as they fled from huge blaze amid severe heatwave on Iberian peninsula

Millions of non-native creatures known as pyrosomes are "blooming" off the coast of British Columbia and have the potential to devastate an already fragile food
chain.
Scientists
in Canada know very little about the pimply, translucent, tube-like
animals — normally found in the tropics —some of which grow to 10
metres in length.

Some
Nebraska corn fields are so flooded that farmers are posting videos
of themselves wakeboarding. The image is amusing, but the realities
of the heavy spring downpours are pummeling U.S. grain farmers with
soggy fields and threats of crop disease.
In
the past 30 days, about 40 percent of the Midwest got twice the
amount of normal rainfall, with soils saturated from Arkansas to
Ohio, according to MDA Weather Services. While spring showers usually
benefit crops, the precipitation has come fast enough to flood some
corn and rice fields and trigger quality concerns about maturing
wheat.
“OUR
planet, the human family and life in all its myriad forms on Earth
are in the throes of a water crisis,” the experts are warning.

GROWING
up in Australia, most of us probably didn’t think twice about where
our seeingly endless supply of water came from. In our young minds,
the tap never ran dry.
But
the world certainly doesn’t have the luxury to think like that.
Water
is absolutely fundamental to life, which makes the increasingly loud
warnings about water scarcity and an impending global water crisis so
concerning for world leaders.
If
current patterns of consumption continue unabated, two-thirds of the
world’s population will be facing water shortages as a daily
reality by 2025 and global policy makers are scrambling to avoid
catastrophe.
The
massive iceberg poised to break off the Larsen C Ice Shelf may be a
harbinger of a continent-wide collapse that would swamp coastal
cities around the world.

Seen
from above, the Pine Island Ice Shelf is a slow-motion train wreck.
Its buckled surface is scarred by thousands of large crevasses. Its
edges are shredded by rifts a quarter mile across. In 2015 and 2016 a
225-square-mile chunk of it broke off the end and drifted away on the
Amundsen Sea. The water there has warmed by more than a degree
Fahrenheit over the past few decades, and the rate at which ice is
melting and calving has quadrupled.
On
the Antarctic Peninsula, the warming has been far greater—nearly
five degrees on average. That’s why a Delaware-size iceberg is
poised to break off the Larsen C Ice Shelf and why smaller ice
shelves on the peninsula have long since disintegrated entirely into
the waters of the Weddell Sea. But around the Amundsen Sea, a
thousand miles to the southwest on the Pacific coast of Antarctica,
the glaciers are far larger and the stakes far higher. They affect
the entire planet.
Subscribe to:
Posts (Atom)