We’re Gonna Need a Bigger Graph — Global Sea Level Rise Just Went off the Chart
6
October, 2015
From
end 2014 through Fall of 2015 global sea levels surged. Building
heat hitting +1 C above 1880s averages in
the atmosphere-ocean system continued to set off a range of what
appear to be ramping impacts. Thermal expansion grew more dramatic as
oceans continued to heat up during what may be a record El Nino year.
Rates of land ice melt continued to increase — providing a greater
and greater fraction of overall global sea level rise. And
global ocean currents showed signs of a melt-spurred change —
which resulted in an uneven distribution of this overall rise.
We’re
Going to Need A Bigger Graph
During
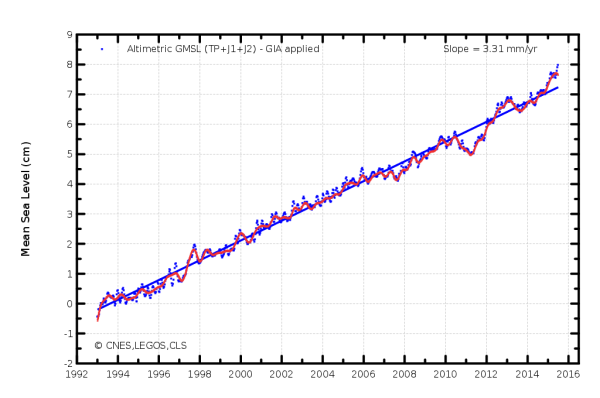
that less than one year time, seas rose by fully 1 centimeter. That’s
three times the ‘normal’ rate that’s been roughly ongoing since
the early 1990s. A big bump that’s now part of a
three-and-a-half-year, 3-centimeter surge. One more sign that global
sea level rise is starting to really ramp up.
(Global
sea level rise since 1992 hits past the 8 centimeter mark in the
AVISO altimetric graph. Image source: AVISO.)
This
big, one-centimeter, jump topped the previous AVISO graph, which went
up to 8 centimeters, forcing the measure to generate a new graph with
a 9 centimeter top like. In other words, ‘we’re gonna need a
bigger graph’ (See
the old, smaller, graph here).
Unfortunately, with some of the world’s top scientists predicting
the potential for an exponentially increasing rate of sea level rise
through this Century, it appears that ‘we’re gonna need a bigger
graph’ may well become the scientific rallying cry of the age.
Possibility
of Exponential Increase in Rate of Sea Level Rise
This
year’s seemingly-staggering, 1 centimeter and counting, jump in sea
level in less than one year, if maintained over the course of a
century would result in a more than 1 meter global rise. Sadly, many
new studies on the rate of glacier destabilization in Antarctica and
Greenland hint that such a significant jump in sea level is not only
likely, but may even be significantly exceeded under business as
usual or even a moderately curtailed rate of fossil fuel burning.
A
new study led by former NASA GISS head Dr. James Hansen points
to the possibility of as much as 3 meters of sea level rise by mid
Century and 7 meters or more of sea level rise by end Century even if
the global economy somewhat steps off its current high trajectory of
fossil fuel burning.
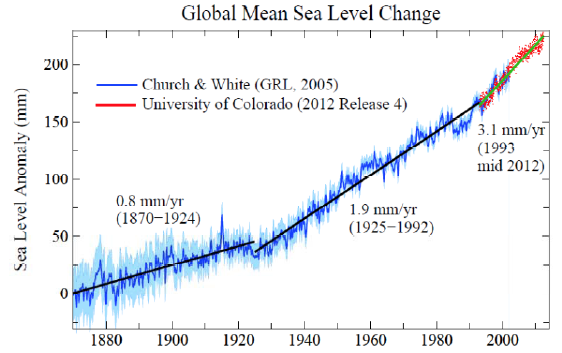
(Steadily
ramping sea level rise that may be the start of an exponential curve.
Image source:Research
Conducted by Dr. James Hansen.)
Such
massive rates of sea level rise would clearly be catastrophic.
In
such cases, we’d start to see these kinds of exponential increases
really begin to ramp up over the next 10, 20, and 30 years. And,
given the rather large bumps we’re seeing in the AVISO measure for
the past 3 and a half years, it’s possible we’re at the start of
one of these potential step changes.
Links:


No comments:
Post a Comment
Note: only a member of this blog may post a comment.