Climate
& Extreme Weather News #133 (6th-17th August 2018
00:13India:
Kerala floods 09:35China:
Floods inc. Shaanxi & Shenyang 14:22The
Philippines: Northern floods 16:00The
USA: California wildfires & east coast floods 25:08Canada:
Toronto flash flood & BC wildfires 30:49Mexico:
Chimalhuacan flash flood 33:14France:
Southern France flash floods 35:25Temperature
Data
This latest edition of Radio Eco Shock includes a discussion with Paul Beckwith with the latest news as well as with Pavel Serov, a CAGE scientist on pingos and methane hydrates.
Incredible
heat records, Biblical downpours not reported. Candian climate
scientist Paul Beckwith & Alex get it on the record. Plus from
new science from Norway. Bright young mind Pavel Serov on Arctic
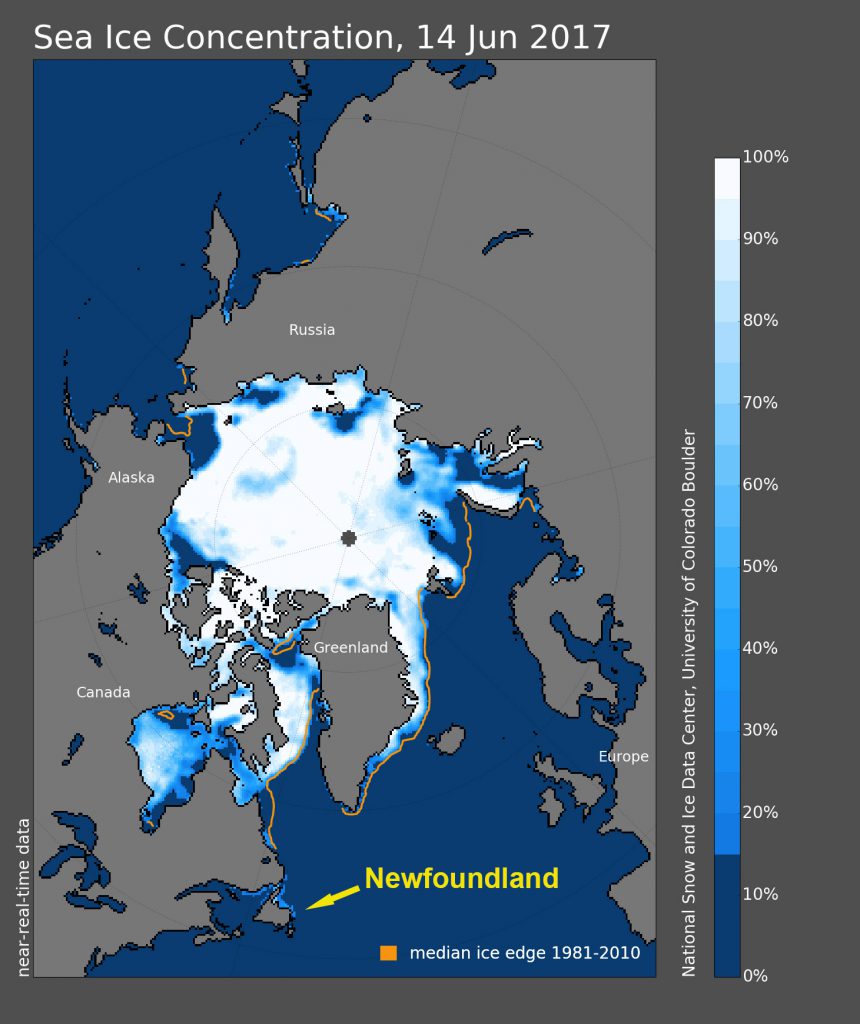
sea-bed methane risks & rewards. See just how little multi-year ice there is Arctic Sea Ice Age - September 2015 to May 2017
NASA's
Goddard Institute for Space Studies calculated the Earth's mean
temperature over land and water in May was 0.88 degrees Celsius above
the 1951-1980 average, second only to May 2016's 0.93 degree Celsius
departure from average. May 2017 beat out May 2014 by just 0.01
degrees Celsius for the second-place ranking.
This
is the fifth month so far this year to rank among the top three
warmest on record for each respective month. February, March and
April 2017 ranked as second-warmest, while January 2017 finished in
third place.
The
largest May warm temperature anomalies were in western Europe,
northern Africa, Asia, eastern South America, northern Alaska,
northern Canada and near Antarctica. Northern Russia was the most
significantly cooler-than-average location.
Scorching May continues decades-long streak of above-average months, and global warming is only accelerating
But before our millennial readers start writing us that the term generally refers to people born starting in the early 1980s, consider this: July 1985 is only a cooler-than-average month if you use the base period 1951 to 1980, as NASA does for its data. But humans were warming the planet by burning fossil fuels long before then — the Industrial Revolution began over two centuries ago.
So when you use an 1880 to 1899 baseline to reflect the earlier warming, as Schmidt does in the graph above, you see we have to go back much further to find a colder than average year — or month.
Climate Central looked at the monthly data using the earlier baseline and found that “if you were born after December 1964, you’ve never experienced a month cooler than average on this planet.”
From
Antarctica, where a research expedition was canceled due to rising
temperatures, to the Arctic Sea, where ice continues to melt, the
effects of climate change are being felt around the globe. In the
United States, temperatures are rising and coastlines are
disappearing. One of the areas that has been affected the most is
Louisiana, the coastline of which has been in danger for years.
According to a new study reported on by the New Orleans
Times-Picayune, the danger is greater than anyone realized
It’s
common knowledge that the coast of Louisiana is quietly sinking into
the balmy Gulf waters. But new research suggests we may have been
underestimating how quickly it’s happening.
A
new paper, published Wednesday in the Geological Society of America’s
bulletin GSA Today, includes an updated map of the Louisiana
coastline and the rate at which it’s sinking into the sea, a
process scientists call “subsidence,” which occurs in addition to
the climate change-caused process of sea-level rise. The new map
suggests that, on average, the Louisiana coast is sinking at a rate
of about 9 millimeters, or just over a third of an inch, per year —
a faster rate than previous studies have suggested, according to the
authors.
The
grasslands of U.S. Great Plains have seen one of the sharpest
increases in large and dangerous wildfires in the past three decades,
with their numbers more than tripling between 1985 and 2014,
according to new research.
The
new study, published in the journal Geophysical Research Letters,
found that the average number of large Great Plains wildfires each
year grew from about 33 to 117 over that time period, even as the
area of land burned in these wildfires increased by 400 percent.
A
dangerously intense heat wave will grip the Southwest U.S. this
weekend and may persist through next week. The NWS has already
plastered much of the region with excessive heat warnings. A strong
ridge of high pressure, expected to rank among the Southwest's
hottest on record at upper levels, will pave the way for this
prolonged heat wave. The all-time hottest surface temperature records
for Las Vegas, Phoenix, Tucson and Needles may be challenged, as
temperatures soar to 115° - 125° Sunday through Thursday next week.
The most intense heat is expected Monday through Wednesday, with 120°
predicted by Weather Underground for Phoenix on Tuesday. Extreme heat
will also extend northwest across the highly populated Central Valley
of California.
According
to wunderground weather historian Christopher C. Burt, Phoenix has
only reached 120° three times at its official NWS site (Sky Harbor
Airport):
Scientists
have documented a recent, massive melt event on the surface of highly
vulnerable West Antarctica that, they fear, could be a harbinger of
future events as the planet continues to warm.
In
the Antarctic summer of 2016, the surface of the Ross Ice Shelf, the
largest floating ice platform on Earth, developed a sheet of
meltwater that lasted for as long as 15 days in some places.
A
new study published
in Nature Communications only
adds to the disturbing trend of change afoot in Antarctica.
Researchers have documented rain on a continent more known for snow
and widespread surface melt in West Antarctica last summer, one of
the most unstable parts of a continent that’s already being eaten
away by warm
waters below the ice.
Rise
in tourism and warmer climate bring house flies – and the growth of
mosses in which they can live
Antarctica’s
pristine ice-white environment is going green and facing an
unexpected threat – from the common house fly. Scientists say that
as temperatures soar in the polar region, invading plants and
insects, including the fly, pose a major conservation threat.
More
and more of these invaders, in the form of larvae or seeds, are
surviving in coastal areas around the south pole, where temperatures
have risen by more than 3C over the past three decades. Glaciers have
retreated, exposing more land which has been colonised by mosses that
have been found to be growing more quickly and thickly than ever
before – providing potential homes for invaders. The process is
particularly noticeable in the Antarctic peninsula, which has been
shown to be the region of the continent that is most vulnerable to
global warming.
Portugal
has declared three days of national mourning as the country comes to
terms with a devastating fire that swept through the center of the
nation, killing at least 62 people and injuring 59 others. This drone
footage shows the scale of the devastation:
Millions
of non-native creatures known as pyrosomes are "blooming"
off the coast of British Columbia and have the potential to devastate
an already fragile food chain.
Scientists
in Canada know very little about the pimply, translucent, tube-like
animals — normally found in the tropics —some of which grow to 10
metres in length.
Some
Nebraska corn fields are so flooded that farmers are posting videos
of themselves wakeboarding. The image is amusing, but the realities
of the heavy spring downpours are pummeling U.S. grain farmers with
soggy fields and threats of crop disease.
In
the past 30 days, about 40 percent of the Midwest got twice the
amount of normal rainfall, with soils saturated from Arkansas to
Ohio, according to MDA Weather Services. While spring showers usually
benefit crops, the precipitation has come fast enough to flood some
corn and rice fields and trigger quality concerns about maturing
wheat.
“OUR
planet, the human family and life in all its myriad forms on Earth
are in the throes of a water crisis,” the experts are warning.
GROWING
up in Australia, most of us probably didn’t think twice about where
our seeingly endless supply of water came from. In our young minds,
the tap never ran dry.
But
the world certainly doesn’t have the luxury to think like that.
Water
is absolutely fundamental to life, which makes the increasingly loud
warnings about water scarcity and an impending global water crisis so
concerning for world leaders.
If
current patterns of consumption continue unabated, two-thirds of the
world’s population will be facing water shortages as a daily
reality by 2025 and global policy makers are scrambling to avoid
catastrophe.
The
massive iceberg poised to break off the Larsen C Ice Shelf may be a
harbinger of a continent-wide collapse that would swamp coastal
cities around the world.
Seen
from above, the Pine Island Ice Shelf is a slow-motion train wreck.
Its buckled surface is scarred by thousands of large crevasses. Its
edges are shredded by rifts a quarter mile across. In 2015 and 2016 a
225-square-mile chunk of it broke off the end and drifted away on the
Amundsen Sea. The water there has warmed by more than a degree
Fahrenheit over the past few decades, and the rate at which ice is
melting and calving has quadrupled.
On
the Antarctic Peninsula, the warming has been far greater—nearly
five degrees on average. That’s why a Delaware-size iceberg is
poised to break off the Larsen C Ice Shelf and why smaller ice
shelves on the peninsula have long since disintegrated entirely into
the waters of the Weddell Sea. But around the Amundsen Sea, a
thousand miles to the southwest on the Pacific coast of Antarctica,
the glaciers are far larger and the stakes far higher. They affect
the entire planet.
Over
the past 10 days, the rate of sea ice extent loss in the Arctic has
slowed down somewhat.
And as a result sea ice extent measures, though maintaining in record
low ranges, are much closer now to the 2012 line. Low pressure
systems have come to dominate the Arctic Ocean zone. And the
outwardly expanding counter-clockwise winds from these systems have
tended to cause the ice to spread out and to thin. In the past, such
events were seen as an ice preserving feature. But this year, there’s
cause for a little doubt.
The
first cause comes in the form of record Arctic temperatures for all
of 2016. As
Zack Labe shows in the compelling graphic below,
not only has the first half of 2016 been a record warm six months for
the Arctic, it’s been a record warm half-year like no other.
(The
first half of 2016 is about 1.5 C hotter in the Arctic than the
previous record hot year. It’s a huge jump to new record warmth
that should cause pretty much everyone to feel a deep sense of
concern about this sensitive region. Image source: Zack
Labe.)
Overall,
these conditions are unprecedented for the Arctic. And, in microcosm,
we can tell a little bit of this story of heat by tracking the life
of a ten mile wide hunk of ice that was recently blown away from the
ice pack and into the warming waters north of Svalbard.
Ocean
Zone North of Svalbard — A New Sea Ice Melt Field
(June
8 — a 10 mile wide hunk of sea ice exits the ice pack North of
Svalbard. LANCE
MODIS image.)
On
June 8th, this ten-mile wide chunk of ice was ushered away from a
thinning but concentrated grouping of ice about 80 miles to the North
of the Island Archipelago of Svalbard. In past decades during June,
the sea ice had tended to remain closer to Svalbard, often enveloping
this Arctic island chain straddling the 80th parallel. But during
recent years sea surfaces around Svalbard have dramatically warmed
due to a human-forced heating of the atmosphere and oceans. And
today, sea surface temperatures surrounding Svalbard range from
1 to 8 degrees Celsius above 20th Century averages.
That’s
still cold water in the range of 32 to 46 F. At least to the human
perspective — as neither you nor I would find it a pleasant
experience to plunge into sea waters that are still relatively close
to freezing. But to sea ice, this water is basically warm enough to
represent an oceanic killing field.
(June
10 — the large ice island shatters in waters warmed by climate
change. LANCE
MODISimage.)
By
June 10, our ten mile wide hunk of ice had been ejected about 30
miles into this warm water zone north of Svalbard. After only two
days, the previously contiguous structure of the ice is riddled with
cracks large enough
to be plainly visible in the 250 meter satellite resolution.
The sudden contact with warmer waters was more than enough to shatter
the surface of this island-sized hunk of Arctic sea ice.
Export
into warmer waters has long been a melt issue for ice moving out
through the Fram Strait. And loss of ice in this fashion due to
strong winds circulating clockwise around Greenland has become a
growing concern. Ice originating in the thick (though much thinner
than in past decades) ice pack north of Greenland can be funneled
along the Greenland Coast and eventually propelled out into the
warmer waters of the North Atlantic where it has no chance to
survive.
(June
13 — the ice island breaks into tiny pieces. LANCE
MODIS image.)
But
this is exactly what happened to this 10 mile wide chunk of ice as it
entered waters North of Svalbard. It exited the ice pack, lost access
to the fresh water field protecting the ice. It entered 1-3 C surface
waters. And it basically disintegrated.
Arctic
Ocean Near Summer Melt Tipping Points?
Added
Arctic heat is not just a measure, therefore, of atmospheric
temperatures. It’s a measure of implied ocean surface heat and
ocean heat lurking just beneath the surface. In the end, what we see
is that new ways to lose sea ice are now emerging. And it appears
that sea ice export into the northern Barents and near Svalbard
waters is yet one more sea ice melt risk potential. It’s a matter
worth bringing up due to the simple fact that this zone of ocean
water was once frozen, was once a consistent part of the Northern
Hemisphere ice pack. And after warming just enough, it’s a region
that is now hostile to sea ice.
(More
reliable US Navy ARCc model shows rapid thinning of remaining
Beaufort sea ice taking hold over the next seven days. With so much
heat baked into the Arctic over the past six months, we should remain
vigilant regarding outlier melt possibilities for 2016. Image
source: US
Navy.)
Looking
north, there’s risk that human caused climate change will drive
that ice hostility zone into the near polar region itself. During the
melt phase, broken ice can generate a bit of negative feedback by
promoting cloud formation through increased water evaporation and
reduced albedo as surface melt ponds are essentially dumped back into
the ocean. But such floes are at the mercy of transport and waves.
And they sit upon a warming surface ocean. A discontinuous floe can
hit a melt tipping point pretty rapidly — covering a large region
and then disappearing in a very short period. We’ve seen instances
of such events during late June for Baffin Bay, Hudson Bay, and the
Kara Sea.
Now,
much of the Arctic Ocean is covered by these floes. And with so much
heat in the system, it’s worth considering that the old rules no
longer fully apply. It’s worth realize that the ice is dancing in
an increasingly tenuous temperature zone between the warming waters
below and the warming airs above.
This report makes light of the fact that NZ had its warmest early-winter on record; the Southern Alps were devoid of snow; and does not reflect the increasing number of extreme weather events and growing impredictibility. Enjoy the relatively mild conditions while you can. 2014
Annual Climate Summary out now
NIWA’s
Annual Climate Summary, released today, shows 2014 was generally a
mild year with near normal rainfall and near average temperatures for
most of the country.
2014
significant weather and climate events:
New
Zealand observed its equal-warmest June on record, which meant many
ski areas throughout New Zealand were forced to delay their opening
for the 2014 season.
Heavy
rain on 4 and 5 March caused considerable flooding throughout
Christchurch and surrounding areas. On 4 March, Christchurch
recorded its second-highest ever 1-day rainfall total (123 mm) since
records began in 1873.
Near
the end of the first week of April, very warm temperatures for the
time of year were experienced in many central and northern locations
across the North Island. On 6 April, nine locations observed
their highest or equal-highest April maximum temperature on record.
However, temperatures were even higher for some of those locations
on the following day – six of the nine locations (i.e. Hamilton,
Tauranga, Paeroa, Te Puke, Whakatane and Rotorua) established new
April maximum temperature records.
At
the end of 2014 soil moisture levels were below normal for the time
of year across Waikato, lower Hawke’s Bay, Wairarapa, and along
and east of the Divide in the South Island, and the threat of
drought was especially prevalent in Canterbury.
For
the year as a whole, 2014 was the 4th ‘windiest’ year of the
past 49 years with 53 ‘windy days’ (see full report).
On
17 April, strong winds associated with ex-Tropical Cyclone Ita
struck much New Zealand. In Auckland, around 17,000 properties
were without power – mostly as a result of trees blowing onto
power lines.
On
8 and 9 July, damaging winds struck many parts of the upper North
Island, with widespread damage occurring in Northland.
At least twelve homes had their roofs blown off, with property
damage especially severe around the Kaitaia and south Hokianga
areas.
On
23 February, a supercell storm swept through northern and
mid-Canterbury. Two tornadoes formed, one in Amberley (north
Canterbury) around 6 p.m. and one in Leeston (mid-Canterbury)
earlier in the day.
Report
highlights:
Whangarei
recorded the highest annual average temperature for 2014 (16.1°C).
Whakatane
was the sunniest location in 2014, recording 2711 sunshine hours,
followed by Blenheim (2509 hours) and Lake Tekapo (2505 hours).
Of
the six main centres, for 2014 as a whole, Auckland was the warmest,
Tauranga was the sunniest, Christchurch was the driest, Wellington
was the wettest, and Dunedin was the coldest.
Alexandra
tops the 2014 list for the driest place in the country, with 378mm
of rain falling all year.
Last
year was one of whether contradictions – the West Coast filled the
leaderboard is the wettest place in New Zealand, but in spring and
also managed 24 days without a drop of rain.
The
National Institute of water and atmospheric research (NIWA)set in its
annual climate report that based on its own pages, three wettest
locations in the country were the crop river, with 11,866 mm, okay
Roever with 9066 mm and Ivory Glacier with 7476 mm – all on the
West Coast.
Meanwhile
August experienced a mini drought.
Westport
manage to go without a drop of rain from August 18 to September 10
mile Haast managed 21 days.
The
cobwebs (and acres of forest) the blind away on April 17 when the
remnant of cyclone eater slammed into the region, cutting power
forcing the closure of Greymouth.today, some houses are still
awaiting repair.
This
Westport had a record-breaking windgust of 126 km/h during the
cyclone.
Overall,
average annual temperatures were recorded in Wesland. The wet end to
the year when the above normal soil moisture levels were evident over
parts of the upper west coast.


