As
oceans warm, microbes could pump more CO2 back into air, study warns
Aboard the German research vessel Sonne in the South Pacific, study author Frank Pavia (left, foreground) prepares pumping apparatus used to sample seawater for organic matter. Credit: Frank Pavia
The world's oceans soak up about a quarter of the carbon dioxide that humans pump into the air each year—a powerful brake on the greenhouse effect. In addition to purely physical and chemical processes, a large part of this is taken up by photosynthetic plankton as they incorporate carbon into their bodies. When plankton die, they sink, taking the carbon with them. Some part of this organic rain will end up locked into the deep ocean, insulated from the atmosphere for centuries or more. But what the ocean takes, the ocean also gives back. Before many of the remains get very far, they are consumed by aerobic bacteria. And, just like us, those bacteria respire by taking in oxygen and expelling carbon dioxide. Much of that regenerated CO2 thus ends up back in the air.
A new study suggests that CO2 regeneration may become faster in many regions of the world as the oceans warm with changing climate. This, in turn, may reduce the deep oceans' ability to keep carbon locked up. The study shows that in many cases, bacteria are consuming more plankton at shallower depths than previously believed, and that the conditions under which they do this will spread as water temperatures rise. The study was published this week in the journal Proceedings of the National Academy of Sciences.
"The results are telling us that warming will cause faster recycling of carbon in many areas, and that means less carbon will reach the deep ocean and get stored there," said study coauthor Robert Anderson, an oceanographer at Columbia University's Lamont-Doherty Earth Observatory.
Scientists believe that plankton produce about 40 billion to 50 billion tons of solid organic carbon each year. They estimate that, depending on the region and conditions, about 8 billion to 10 billion tons manage to sink out of the surface ocean into greater depths, past about 100 meters, without getting eaten by bacteria. However, scientists have had a poor understanding of the depths at which CO2 is respired, and consequently, of the rate at which it is returned to the atmosphere. The new study zeroed in on this question, with surprising results.
Using data from a 2013 research cruise from Peru to Tahiti, the scientists looked at two distinct regions: the nutrient-rich, highly productive waters off South America, and the largely infertile waters that circle slowly in the central ocean below the equator in a set of currents known as the South Pacific Gyre.
To measure how deep organic particles sink, many oceanographic studies use relatively primitive devices that passively trap particles as they sink. However, these devices can collect only a limited amount of data over the vast distances and depths of the ocean. For the new study, the researchers instead pumped large amounts of seawater at different depths and sifted through it. From these, they isolated particles of organic carbon and isotopes of the element thorium, which together enabled them to calculate the amount of carbon sinking through each depth that they sampled. This procedure yields far more data than traditional methods do.
Researchers prepare to lower pumps overboard to sample seawater. Credit: Frank Pavia
In the fertile zone, oxygen gets used up quickly near the surface, as bacteria and other organisms gobble up organic matter. At a depth of about 150 meters, oxygen content reaches near zero, halting aerobic activity. Once organic material reaches this layer, called the oxygen minimum zone (OMZ) it can sink untouched to the deeper ocean. The OMZ thus forms a sort of protective cap over any organic matter that sinks past it. In the deeps, oxygen levels pick up again and aerobic bacteria can go back to work; however, any CO2 produced down that far will take centuries to get back into the air via upwelling currents.
Up to now, many scientists have thought much of the organic matter produced near the surface makes it through the OMZ, and thus most CO2 regeneration would take place in the deep ocean. However, the researchers' measurements suggested that actually only about 15 percent makes it this far; the rest is converted back to CO2 above the OMZ.
"People did not think that much regeneration was taking place in the shallower zone," said the study's lead author, Frank Pavia, a graduate student at Lamont-Doherty. "The fact that it's happening at all shows that the model totally doesn't work in the way we thought it did."
This matters because researchers project that as the oceans warm, OMZs will both spread horizontally over wider areas, and vertically, toward the surface. Under the conventional paradigm, this would allow more organic matter to reach the deep ocean to get trapped there. However, the new study suggests that as OMZs spread, so will the vigorous CO2 regeneration above them. This would counteract any increased trapping of organic matter below the OMZ. Which effect—near surface regeneration or the cap provided by the OMZ—might win out is a question for more research, says Pavia. But the discovery implies that the spread of OMZs might not be as beneficial as previously thought. (At least not for carbon storage; OMZs are harmful, in that they kill off much marine life in what are now important fishing areas.)
Further out, in the South Pacific Gyre, the results were less ambiguous. There is less biologic activity here than above the OMZs because of lack of nutrients, and previous research using sediment traps has suggested that much of whatever organic matter does form on the surface sinks to the cold deeps. Some CO2 regeneration takes place there, but it would take centuries for the gas to resurface. However, the new study found the opposite: there is far more regeneration near the warmer surface than previously estimated by some studies.
This matters because, like OMZs, the South Pacific Gyre and similar current systems in other parts of the oceans are projected to grow as the oceans warm. The gyres will divide these regions into stratified layer cakes of warmer waters on top and colder waters below. And because, according to the study, so much CO2 regeneration will take place in the warm, shallower waters, more CO2 will end up going back into the air over wider regions. And unlike below the nearer-shore OMZs, "there is no counterbalancing effect in the gyres," said Anderson. "The story with the gyres is that over wide areas of the ocean, carbon storage is going to get less efficient." (There are four other major gyres: the north Pacific, the south and north Atlantic, and the Indian Ocean.)
The researchers point out that the processes they studied are only part of the ocean carbon cycle. Physical and chemical reactions independent of biology are responsible for much of the exchange of carbon between atmosphere and oceans, and these processes could interact with the biology in complex and unpredictable ways. "This [the study] gives us information that we didn't have before, that we can plug into future models to make better estimates," said Pavia.
The following was a helpful comment on Margo's video that corresponds with our own view of what might be happening: "Hi Margo, not had time to catch up with all your videos, but was looking at CAMS and Climate Reanalyser today and realised that the methane plumes in the Arctic are actually coming through the ice off the eastern side of Novaya Zemlya and in the East Siberian Sea. How is that even possible?" What follows is an attempt to address this question. Is methane coming up from below in warmer Arctic seas?
Yesterday Margo made a video (which can be seen HERE) in which she showed alarming evidence that methane is coming in large concentrations up the east coast of Novaya Zemlya in western Siberia as well as (in smaller concentrations) at the East Siberian Arctic Shelf (ESAS).
At what temperature does salt water freeze? First a matter of clarification, In the video I stated that salt water freezes at minus 21 C whereas other sources say minus 6C. My source for this is: "Pure water freezes at 32 degrees Fahrenheit, (0 degrees Celsius) while a salt solution may not freeze until it reaches minus 6 degrees Fahrenheit (minus 21 degrees Celsius)because salt disrupts the movement of molecules entering and leaving the solid."
(I have added the conversions to degree Celsius) Basically the freezing point of water depends on the degree of mixing of fresh and salt water. Arctic water is likely to freeze at somewhere between 0C and -21C. Here is an illustration of sea surface salinity which shows a high degree of mixing in the North Atlantic but also relatively high levels of salinity in the Siberian sector of the Arctic Ocean.
If you want more on this read this item from Wikipedia
"Because earth's insulating crust is much thinner under the oceans than under the continents, most of the earth's internal heat escapes into the oceans. Although the temperature of the air at an ocean's surface may be freezing, the temperature of the water deep in the ocean is significantly warmer due to internal heating".
***
Sea surface temperatures are mainly just below freezing
What are the indications that methane might be coming up from below through the ice? Firstly, here is data from the US Navy site on ice thickness:
The data for sea ice concentration shows 100 % except for areas in the North Atlantic and the Bering Strait.
We come now to the all-important question of sea surface temperature.
Nullschool has a feature with measurement of sea surface temperature (even where there is ice, it seems)
According to that there is a warm area (seen below) of warm ocean that measures up to 16.2C.
For contrast, compare that with the Cook Strait in New Zealand in summer and in the midst of a marine heatwave.
A temperature of 18.2 degrees Celsius!!
If you go a little north from Svalbard the sea surface temperature is minus 1.8 degrees Celsius.
Note, this area of the Arctic (in the North Atlantic is still ice-free
Meanwhile, temperatures at the south of Greenland are2.4 degrees Celsius.
As a reminder. this is almost-but-not-quite in darkness.
Sea surface temperatures in Siberia and methane releases
Getting back to the methane...
According to Nullschool temperature to the east of Novaya Zemlya are minus 1.4C.
Given that a proportion of the water will have a certain amount of salinity mixed in which means that the water has not completely frozen and the probable quality of the ice will be very low.
It is a surprise to learn that Nullschool gives sea surface temperatures in areas which are frozen.
According to this, sea surface temperatures are minus 1.8 degrees Celsius.
Taken together, this would indicate that it is indeed possible for methane to be coming up to the surface from below and being released into the atmosphere.
Like the ESAS the seas around Novaya Zemlya are shallow enough for methane from clathrates to reach the surface
"The Pechora Sea is quite shallow, its average depth being only 6 m. The deepest point reaches 210 m. In the southern part of the sea runs the eastward-flowing Kolguyev Current."
I would surmise that given that it is winter and there is ice (whatever its quality) that only a part of the methane is being released into the atmosphere.
It is totally unexpected to see methane released into the atmosphere in winter and yet that is what I think is happening.
One can only begin to imagine how all this will look under conditions of ice melt and warmer-still seas.
Caveat and a provisional conclusion
All of the above is based on observations from data sources that we trust are accurate. There is no way to confirm whether this is the case.
My conclusion is that, given the above and information that has come out in the last few days is that we are in totally uncharted territory.
Some scientists (members of the "Priesthood" as call it) may pretend they know what is going on.
They don't, especially those sitting behind their computers working with their flawed models. This is how science has always worked:
"Nikita Zimov was teaching students to do ecological fieldwork in northern Siberia when he stumbled on a disturbing clue that the frozen land might be thawing far faster than expected.
Zimov, like his father, Sergey Zimov, has spent years running a research station that tracks climate change in the rapidly warming Russian Far East. So when students probed the ground and took soil samples amid the mossy hummocks and larch forests near his home, 200 miles north of the Arctic Circle, Nikita Zimov suspected something wasn't right."
In conjunction with our own observations it is these two pieces of news from the last few days that have put the wind up me.
Data from two Arctic sites suggest some surface layers are no longer freezing. If that continues, greenhouse gases from permafrost could accelerate climate change.
Polygons formed by the annual freezing and thawing of ice wedges just below the earth's surface are visible from above near the Northeast Science Station in Cherskiy, Russia.
What happens if the
Atlantic Meridional Overturning (AMOC) slows down, or even stops? The
former has happened, and if the latter occurs there will be global
chaos. How close are we to reaching the threshold for a “rewriting”
of global ocean circulation? If it occurs, will it be permanent, for
at least hundreds of years? How much will already extreme weather
change, and how much will global food supply be impacted?
Ocean
Currents Disruption: Slower and Wavier
What
If the Ocean's Climate-Controlling 'Conveyor Belt' Came to a Halt?
Freak
floods drown buildings, bone-chilling air flash-freezes pedestrians
and ice encases the Statue of Liberty. It sounds like a disaster
movie, and well, it is: In 2004's "The Day After Tomorrow,"
the collapse of an ocean current in the North Atlantic sends the
world into a whirlwind climate doomsday.
And
while that ocean current has not actually collapsed, scientists
reporting in two new studies have found that it's weakening, by a
lot. In fact, the current hasn't been this sluggish in 1,500 years —
a finding that could carry serious (although not disaster-movie
serious) repercussions for weather and sea-level rise in locations
around the world.
In
the Atlantic Ocean, the current known as the Atlantic Meridional
Overturning Circulation (AMOC) ferries warm surface waters northward
— where the heat is released into the atmosphere — and carries
cold water south in the deeper ocean layers, according to the
National Oceanic and Atmospheric Administration. Its circulation
transports heat around the globe like a conveyor belt, and if its
movement were to stop, that heat would not get distributed, and
weather havoc could ensue. [Doomsday: 9 Real Ways Earth Could End]
But
the AMOC has been getting weaker, and cold, freshwater infusions by
the runaway melting of glaciers, sea ice and permafrost are to blame,
and the AMOC may weaken even further if temperatures on Earth
continue to rise and ice reserves continue to melt, scientists
reported in the two studies.
Written
in sand
In
one study, published yesterday (April 11) in the journal Nature,
researchers analyzed ocean sediments in a core sampled off the
eastern coast of the U.S., from depths where most of the water
originated in the North Atlantic's Labrador Sea. They examined
positions of different-size sand grains in the geologic record, to
reconstruct how the flow of the currents that carried the grains may
have changed over time, said study co-author Delia Oppo, a senior
scientist in the geology and geophysics department at the Woods Hole
Oceanographic Institution.
The
researchers traced the start of the current's weakening to the
mid-19th century at the end of the Little Ice Age, a centuries-long
period of extreme cold that froze northern Europe. When temperatures
began warming up, freshwater from melting ice that flowed into the
Nordic Seas would have diluted salty seawater near the surface. This
weakened the current and prevented it from carrying bigger grains of
sand as far as it used to, which told the scientists about
differences in the current's strength, Oppo told Live Science.
The
Atlantic Meridional Overturning Circulation, also known as the Gulf
Stream System, brings warm waters from the South to the North, where
it sinks into the deep and transports cold water from the North to
the South. A weakening of this major ocean circulation can have
widespread and potentially disruptive effects.
Then, beginning in the
1950s, another stage of warming and ice melt began in the Northern
Hemisphere — this time, likely driven by human-induced climate
change — infusing the sea with more chilly fresh water and further
weakening the ocean circulation system, study lead author David
Thornalley, a senior lecturer at University College London, told Live
Science in an email.
"Theory and models
show the AMOC weakens when there is warming and increased input of
freshwater, and these are both things being observed as part of
global warming," Thornalley said. The research team estimated
that, since the current began to lose strength in the mid-1800s, it
has weakened by about 15 to 20 percent.
Finding the "fingerprint"
Another study, also
published today in Nature, arrived at the same conclusions about a
weakened AMOC — this time, by reviewing sea-surface temperature
data going back to the late 19th century. In this study, the
researchers' temperature analysis confirmed computer models'
predictions of AMOC behavior and suggested a decline of about 15
percent in current circulation strength, beginning in the 1950s.
"The evidence we're
now able to provide is the most robust to date," study co-author
and oceanographer Stefan Rahmstorf, a professor of physics of the
oceans at the Potsdam Institute for Climate Impact Research in
Germany, said in a statement.
The researchers detected
an ocean temperature pattern that was a "fingerprint" for
an AMOC slowdown: anomalous warming in the Gulf Stream and cooler
waters near Greenland, suggesting that warm water was not being
transported north as effectively as it once was, according to the
study.
"The specific trend
pattern we found in measurements looks exactly like what is predicted
by computer simulations as a result of a slowdown in the Gulf Stream
system," Rahmstorf said. "And I see no other plausible
explanation for it."
Though these two research
teams used different methods, they arrived at a similar conclusion:
that a crucial part of the climate system on our dynamic planet is
not performing as it once did.
"What's happening
now is that the evidence is converging from different sources,"
Oppo told Live Science. "So, we're becoming more and more
confident, as we see several studies starting to show similar things
using different approaches." [7 Ways the Earth Changes in the
Blink of an Eye]
An uncertain future
While the complete
disintegration of the AMOC is extremely unlikely, the ocean
circulation system will probably continue to weaken, and that
prospect is far from reassuring, Oppo told Live Science. Prior
research has suggested that a feeble AMOC brings more dryness to the
Sahel, a region of Africa bordering the Sahara Desert; spurs
sea-level rise in U.S. coastal cities; encourages patterns of
increasingly cold winters in Europe and the northeastern U.S.; and
prompts warmer summers across Europe. However, more research is
needed to confirm a persistent connection, Oppo said.
But a weakened AMOC does
make the ocean less effective at absorbing atmospheric carbon
dioxide, Oppo noted. If the ocean current continues to weaken, it
will likely take up even less CO2, leading to higher quantities of
the greenhouse gas in the atmosphere and potentially worsening the
effects of global warming, she said.
"More research into
the potential weather impacts of an AMOC slowdown and the associate
sea surface temperature pattern is needed, given the results of the
two new studies suggesting a weak AMOC that is likely to weaken
further," Thornalley told Live Science.
Editor's Note: This
article was updated to clarify some statements from Delia Oppo.
Where
does most of the heat trapped by human fossil fuel and other
greenhouse gas emissions ultimately end up? Given our fixation
on global surface temperatures, many people would say ‘the
atmosphere.’ But this answer is incorrect. The vast majority ends
up in the world ocean.
The
world ocean system is the largest heat sink on our planet’s
surface. This is due to the fact that liquid water contained in the
oceans both has a far greater mass and overall heat
capacity than
the atmosphere. Just a fraction — less than 1/30th of the heat
trapped by human-emitted greenhouse gasses ends up in the atmosphere.
Similar portions end up getting soaked in by the land and by melting
glaciers. The rest, about
90 percent,
finds its way into the oceans.
The
ocean is thus the best, most reliable global thermometer available.
For good reason, most scientists wait for readings from this big, wet
thermostat to get an idea where global temperatures are headed and
how fast. And what some of the world’s top ocean researchers found
this week was that during 2017 the
top 6,000 feet of the world’s oceans experienced their hottest year
ever recorded.
In
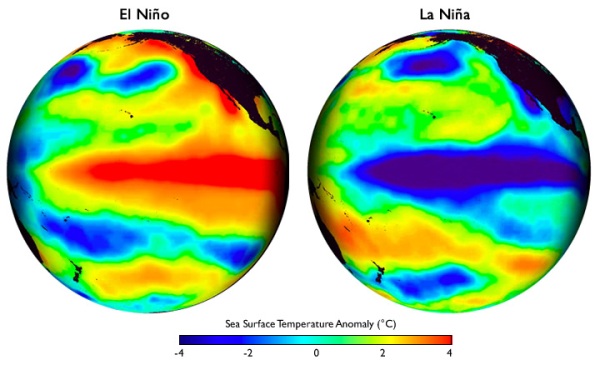
the atmosphere, we tend to focus on El Nino years as the hot ones in
an ongoing upward trend.
This is because warm surface waters spreading across the Equatorial
Pacific belch a bit of that huge volume of stored ocean heat back
into the atmosphere. But during La Nina years, cooler surface waters
across wide regions of the Equator swallow up more of the atmospheric
heat. It is during these years that oceans tend to warm the most
swiftly even as atmospheric warming tends to take a break. 2017 saw a
weak La Nina and a comparatively strong rate of related ocean heat
gain. And though atmospheric
temperatures were ‘only’ the second hottest ever recorded
according to NASA,
ocean temperatures tracked further into uncharted territory.
(During
El Nino years [left], the global oceans transfer a portion of their
vast store of warmth to the atmosphere. During La Nina years [right]
the oceans draw in more of the atmosphere’s heat. Image
source: Climate.gov.)
It’s
worth noting that ocean heat gain is presently both quite rapid and
rather steady. All
of the past five years were each one of the five hottest ocean years
ever recorded.
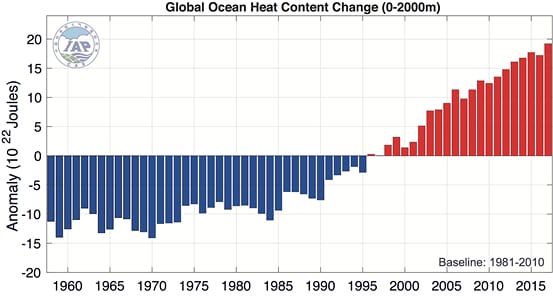
Global temperature gain thus hasn’t slowed. And though atmospheric
temperature gain has accelerated during recent years, the ocean
measure hints that overall heat gain per year has been pretty steady
since the mid 1990s. At least for the top 6,000 feet of the world’s
surface waters (though other measures provide some hints at
acceleration [see image at top of this post]). An observation that
would seem to reinforce the present decadal rate of temperature
increase in the range of 0.15 to 0.20 C every ten years or about 30
to 50 times faster than the warming that ended the last ice age.
To
be clear, the primary driver of what is a very rapid warming in the
geological context is human fossil fuel burning and related carbon
emissions in the range of 11 billion tons per year. Halting fossil
fuel burning is therefore critical to slowing down and ultimately
stopping the present rate of warming and dangerous related
atmospheric and ocean carbon addition.

 Posts
Posts