Showing posts with label Greenland. Show all posts

Thursday, 20 August 2020

Paul Beckwith on Arctic ice

 Arctic Sea Ice Status Update, and a Tragedy in Greenland.


Paul Beckwith


We are 4-5 weeks away from our yearly Arctic Sea Ice mid-September minimum. I chat on present Arctic sea ice status and loss trends. Gone are days of thick, solid, contiguous ice. We now have a regime where sea ice is fractured, broken, thin, and easily jostled around by wind, ocean currents, and waves. Sensors measuring ice extent, area, and thickness struggle to provide accurate info in this new fractured regime. 


I also discuss the extremely sad, tragic loss of Swiss glaciologist Konrad Steffen in a Greenland crevasse.


Fractured, Thin, Broken Arctic Sea Ice Subject to Mercy of Wind, Waves, Ocean Currents, and Sun


Friday, 5 June 2020

Arctic heat wave ushered in significant ice melt in Greenland

High Temperatures Set Off 
Major Greenland Ice Melt—
Again
An Arctic heat wave ushered in the start of the melt season two weeks earlier than average
High Temperatures Set Off Major Greenland Ice Melt--Again
3 June, 2020

A significant melt event is unfolding in Greenland this week.

With temperatures nearly 20 degrees Fahrenheit higher than usual in some areas, the southern part of the ice sheet is melting at its highest rate this season. Forecasts suggest that the melting on Greenland’s South Dome—one of the highest elevations on the ice sheet—may be the strongest for early June since 1950.

It worries experts that Greenland could be priming for another big melt season.

Early melting this spring, low snowpack in some areas and the potential for strong high-pressure weather systems later this summer have all raised red flags. Scientists are paying close attention after last summer’s record-breaking ice loss—an event scientists expect to occur more frequently as the Arctic continues to warm.

Scientists typically define the beginning of melt season as the first three-day period in which melting is observed across at least 5% of the ice sheet. This year, that period began on May 13—nearly two weeks earlier on average over the last few decades.

The melting coincided with a heat wave across much of the Arctic. Siberia and the central Arctic were some of the hardest-hit regions. But temperatures skyrocketed in parts of Greenland, as well, after an otherwise chilly start to the month.

At the same time, snow began rapidly disappearing along the margins of the ice sheet, exposing bare rock and ice. The lack of snow is one factor increasing the possibility of an above-average melt year, according to Jason Box, an ice expert with the Geological Survey of Denmark and Greenland.

Snow plays an important role in the Arctic. Its bright surface helps to reflect sunlight away from the Earth. When snow disappears, more heat is able to get through and warm the surface. That, in turn, can cause faster melting.

The exposure of bare ice is happening earlier than usual this year, according to Box.

“Like last year, a dearth of snow along the western ice sheet preconditioned stronger than normal ice loss because the seasonal snow shields the dark bare ice with a bright reflective cover,” he told E&E News by email. “So, all else equal, we can expect more melt this year.”

Xavier Fettweis, a polar climate scientist at the University of Liège in Belgium, agreed that the lack of snow can pose a risk. He added that warm events are also necessary to kick-start the feedback process.

The ice sheet is in the midst of one now. And the fact that melting is happening at such high elevations, where snowpack tends to be stronger, may be cause for some concern.

The melting at South Dome, for instance, is likely to make the snow wetter and denser, according to Fettweis. That will diminish its ability to reflect sunlight and to absorb meltwater that forms on the surface of the ice sheet.

“Such an event so early in the season will certainly favour an above-average melt season this year,” he told E&E News in an email.

It’s possible that more heat waves are on the way.

According to Judah Cohen, director of seasonal forecasting at the analytics firm Atmospheric and Environmental Research, model forecasts suggest strong high-pressure events over Greenland this summer. High-pressure systems are often associated with warming on the ice sheet.

In fact, a recent study concluded that last summer’s extreme melting was linked to abnormally persistent high-pressure systems over Greenland (Climatewire, April 16). Greenland’s melt rates last year were second only to those in 2012—and the total amount of ice lost was actually the highest on record.

This summer’s forecasts seem to suggest the high-pressure systems will be most intense in July. And they may affect larger swaths of the ice sheet than the current melt event, which is mainly limited to the southern part of the ice sheet.

Cohen cautions that there’s still considerable uncertainty about forecasts this far in advance. It’s too early, for now, to say whether these events will definitely occur.

But if the forecast is accurate, he said, it’s “definitely suggestive of high melt over the ice sheet.”

In general, he added, the forecast is in keeping with research indicating that these high-pressure systems are becoming more frequent over Greenland. Some scientists believe that climate change, which can alter the structure and flow of the atmosphere, is partly to blame.

“Nothing is impossible; there’s always variability,” Cohen said of this summer’s forecasts. “But I think just the background would support a continuation of this pattern of high pressure in and around Greenland.”

None of the events this spring necessarily promises a melt season like last year. But put together, with the threat of more heat events this summer, they do suggest cause for a watchful eye on Greenland this season.

Saturday, 24 August 2019

Is this the Big Cyclone of 2019?


Apart from a video from meteorologist, Nicholas Humphrey there has not been a peep from either media or social media.

This may be the most important information I have had to impart.

I had a panic with this video. After making it, editing it and then uploaded I got this message.


A second attempt to upload came with a warning that is was a duplicate of the original.

After abou 30 minutes it appeared on my You Tube account.

I have just seen a report that it is under 970 hPa as of now.


ICE-DESTROYING 

CYCLONE HITS THE ARCTIC


Ice-Busting Cyclone Headed For Arctic Ocean Friday (August 23, 2019)


More Wildfires Are Burning In Angola & Congo Than Brazil


Wednesday, 21 August 2019

Greenland's disappearing ice


I have to ask the question as to why they give so much attention to the Greenland ice melt as shocking as it is.

I have to conclude they are ignoring sea ice because it has an immediate effect as opposed to the melting of the Greenland ice sheet which gives rise to sea level rise over a longer period of time.


Abrupt climate change is still taboo,

Greenland's Summer Heat Breaks Records as 440 Billion Tons of Ice Expected to Disappear


20 August, 2019


(HELHEIM GLACIER, Greenland) — This is where Earth’s refrigerator door is left open, where glaciers dwindle and seas begin to rise.

New York University air and ocean scientist David Holland, who is tracking what’s happening in Greenland from both above and below, calls it “the end of the planet.” He is referring to geography more than the future. Yet in many ways this place is where the planet’s warmer and watery future is being written.

It is so warm here, just inside the Arctic Circle, that on an August day, coats are left on the ground and Holland and colleagues work on the watery melting ice without gloves. In one of the closest towns, Kulusuk, the morning temperature reached a shirtsleeve 52 degrees Fahrenheit (10.7 degrees Celsius).

The ice Holland is standing on is thousands of years old. It will be gone within a year or two, adding yet more water to rising seas worldwide.

Summer this year is hitting Greenland hard with record-shattering heat and extreme melt. By the end of the summer, about 440 billion tons (400 billion metric tons) of ice — maybe more — will have melted or calved off Greenland’s giant ice sheet, scientists estimate. That’s enough water to flood Pennsylvania or the country of Greece about a foot (35 centimeters) deep.

In just the five days from July 31 to Aug. 3, more than 58 billion tons (53 billion metric tons) melted from the surface. That’s over 40 billion tons more than the average for this time of year. And that 58 billion tons doesn’t even count the huge calving events or the warm water eating away at the glaciers from below, which may be a huge factor.

And one of the places hit hardest this hot Greenland summer is here on the southeastern edge of the giant frozen island: Helheim, one of Greenland’s fastest-retreating glaciers, has shrunk about 6 miles (10 kilometers) since scientists came here in 2005.

Several scientists, such as NASA oceanographer Josh Willis, who is also in Greenland, studying melting ice from above, said what’s happening is a combination of man-made climate change and natural but weird weather patterns. Glaciers here do shrink in the summer and grow in the winter, but nothing like this year.

Summit Station, a research camp nearly 2 miles high (3,200 meters) and far north, warmed to above freezing twice this year for a record total of 16.5 hours. Before this year, that station was above zero for only 6.5 hours in 2012, once in 1889 and also in the Middle Ages.

This year is coming near but not quite passing the extreme summer of 2012 — Greenland’s worst year in modern history for melting, scientists report.

“If you look at climate model projections, we can expect to see larger areas of the ice sheet experiencing melt for longer durations of the year and greater mass loss going forward,” said University of Georgia ice scientist Tom Mote. “There’s every reason to believe that years that look like this will become more common.”

A NASA satellite found that Greenland’s ice sheet lost about 255 billion metric tons of ice a year between 2003 and 2016, with the loss rate generally getting worse over that period. Nearly all of the 28 Greenland glaciers that Danish climate scientist Ruth Mottram measured are retreating, especially Helheim.

At Helheim, the ice, snow and water seem to go on and on, sandwiched by bare dirt mountains that now show no signs of ice but get covered in the winter. The only thing that gives a sense of scale is the helicopter carrying Holland and his team. It’s dwarfed by the landscape, an almost imperceptible red speck against the ice cliffs where Helheim stops and its remnants begin.

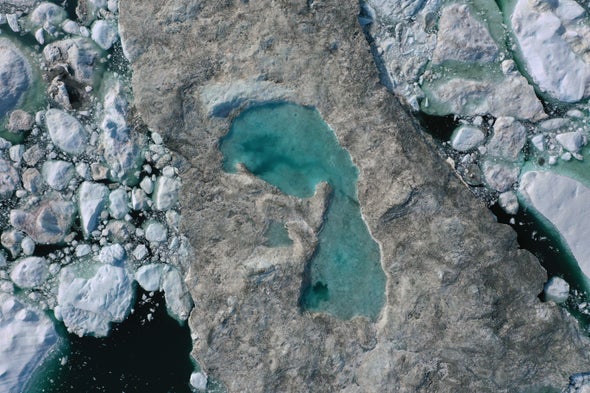
Those ice cliffs are somewhere between 225 feet (70 meters) and 328 feet (100 meters) high. Just next to them are Helheim’s remnants — sea ice, snow and icebergs — forming a mostly white expanse, with a mishmash of shapes and textures. Frequently water pools amid that white, glimmering a near-fluorescent blue that resembles windshield wiper fluid or Kool-Aid.

As pilot Martin Norregaard tries to land his helicopter on the broken-up part of what used to be glacier — a mush called a melange — he looks for ice specked with dirt, a sign that it’s firm enough for the chopper to set down on. Pure white ice could conceal a deep crevasse that leads to a cold and deadly plunge.

Holland and team climb out to install radar and GPS to track the ice movement and help explain why salty, warm, once-tropical water attacking the glacier’s “underbelly” has been bubbling to the surface

“It takes a really long time to grow an ice sheet, thousands and thousands of years, but they can be broken up or destroyed quite rapidly,” Holland said.

Holland, like NASA’s Willis, suspects that warm, salty water that comes in part from the Gulf Stream in North America is playing a bigger role than previously thought in melting Greenland’s ice. And if that’s the case, that’s probably bad news for the planet, because it means faster and more melting and higher sea level rise. Willis said that by the year 2100, Greenland alone could cause 3 or 4 feet (more than 1 meter) of sea level rise.

So it’s crucial to know how much of a role the air above and the water below play.

“What we want for this is an ice sheet forecast,” Holland said.

In this remote landscape, sound travels easily for miles. Every several minutes there’s a faint rumbling that sounds like thunder, but it’s not. It’s ice cracking.

In tiny Kulusuk, about a 40-minute helicopter ride away, Mugu Utuaq says the winter that used to last as much as 10 months when he was a boy can now be as short as five months. That matters to him because as the fourth-ranked dogsledder in Greenland, he has 23 dogs and needs to race them.

They can’t race in the summer, but they still have to eat. So Utuaq and friends go whale hunting with rifles in small boats. If they succeed, which this day they didn’t, the dogs can eat whale.

“People are getting rid of their dogs because there’s no season,” said Yewlin, who goes by one name. He used to run a sled dog team for tourists at a hotel in neighboring Tasiilaq, but they no longer can do that.

Yes, the melting glaciers, less ice and warmer weather are noticeable and much different from his childhood, said Kulusuk Mayor Justus Paulsen, 58. Sure, it means more fuel is needed for boats to get around, but that’s OK, he said.

“We like it because we like to have a summer,” Paulsen said.

But Holland looks out at Helheim glacier from his base camp and sees the bigger picture. And it’s not good, he said. Not for here. Not for Earth as a whole.

“It’s kind of nice to have a planet with glaciers around,” Holland said.

Tuesday, 20 August 2019

An update on methane, climate and Arctic ice - 18 August, 2019

This is the latest update from Margo

Methane, Climate & Arctic Sea Ice Update with Margo (Aug. 18, 2019)


I'm sure that readers of this blog understand this, perhaps leaving only those who do not WANT to understand.


This is what most people point to when they claim that a blue sea event is impossible (or unlikely).


What folk misunderstand is that although the sea ice extent is tying with the 2012 melt year conditions are COMPLETELY DIFFERENT.

Note, the above defines sea ice extent as the "area of ocean with at least 15 per cent ice.

What that means is you could have ice that is 6 inches thick and it is defined as "sea ice extent".

This is far - removed from 2012 when there was plenty of ice that was several meters thick.

When the ice is in such a condition the sea ice extent data can go up and down like a yo-yo but this is not really a predictor of what might happen.

Have a look at the data below from the US Navy site.

There are now NO areas where the sea ice concentration is at 100%- and it has changed quickly, as shown by the .gif.


Particularly alarming, the following shows that ice in the Central Arctic Basin is between 0.5 and 1 metre thick and the tiny area of thicker ice, north of Greenland is only 2 meters thick. Now, that old ice has completely disappeared.


Here you can see the rapid changes over 30 days.

Notice the area of very thin ice close to the North Pole.


And another source of data on ice concentration


It is difficult to say in these conditions what might transpire during the remaining weeks of sunlight (and beyond)  but those people who are claiming to know whether there might be a BOE or not do not know what they are talking about.

Finally, this video from CNN is in equal parts information and propaganda.  What it does (while completely overlooking sea ice because it has a far more short-term effect on the climate than the Greenland ice sheet.

They are correctly panicking over the rapid rate of melt which could happen over a lifetime while they ignore a phenomenon that could bring very rapid changes (as in months and years, not decades).  That does not fit into their narrative (see the second half of the video).

They do, however, acknowledge, perhaps for the first time, the role of the much warmer waters in melting ice far more rapidly than the mainstream ever contemplated.

Scientists find troubling signs under Greenland glacier


Monday, 5 August 2019

Large areas of blue ocean appear in the Arctic

The .gif below is courtesy of Margo who has taken a break from active monitoring of the Arctic ice, greenhouse gasses and earthquakes to concentrate on her own inner journey.

She has also withdrawn from You Tube and Facebook.

I would have to ask myself also whether it is worthwhile given the costs of this journey.


There has been no major cyclone as in 2012 and yet the sea ice extent is the LOWEST it has been at this time of year.


There have been major changes in the sea ice in just a few days. Some of the areas of BLUE OCEAN were not present last time I looked.


The area to the north of Greenland is obscured by cloud but other areas to the west and east are not.


However, one can see the true state of the ice from the day before.


There is a large area of blue ocean in the Laptev Sea where, I think, the Lena River comes out into the sea.


Air temperatures above the melting water are +4-5C. The temperature of the water is 4-5C


In the environs of Novaya Zemlya in western Siberia.


No photo description available.

No photo description available. 

The Greenland ice melt in pictures


Images show staggering extent of melting on Greenland ice sheet because of heat wave

the Washington Post,
4 August, 2019

A major melt event on the Greenland ice sheet, the most extreme since 2012, has left its surface transformed. Pools of sapphire melt water have popped up like pimples, while the usual pristine blanket of fresh snow atop the ice sheet has vanished over large areas, replaced by ash-colored ice left behind nearly 20,000 years ago.
The melt event was spurred by the same record-breaking heat wave that scorched Europe in late July, setting national temperature records in the United Kingdom, Germany, the Netherlands and Belgium. The pulse of warmth pushed temperatures 15 to 30 degrees above normal, and in response, the ice sheet has released billions of tons of water from surface melting.
Melt water ponding in northwest Greenland near the ice sheet's edge on July 30. (NASA/EPA-EFE/REX/Shutterstock) (Nasa Earth Observatory Handout/EPA-EFE/REX/Shutterstock)
Melting occurred on 60 percent of the ice sheet on Wednesday, making it the biggest single-day melt event since July 2012, when 97 percent of the ice sheet saw melting. On Thursday, the ice sheet set a record for the greatest daily mass loss event on record, shedding 12.5 billion tons of ice into the ocean.
Images from Sentinel 2, an Earth-observing satellite, reveals stunning changes on the surface of the ice sheet.
We created animations that show the change in the condition on sections of the ice sheet between July 30 this year and one year ago around the same time. Last summer was a relatively cool season, with lower ice loss than had been seen in some previous years, but even with that caveat, these comparisons are jaw-dropping.
First, here is a view of the southwest portion of the ice sheet:
Satellite views of a section of southwest Greenland in summer 2018 vs. 2019, following a major melt event. (Sentinel 2/European Union)
Next is a view from the northeast portion of the ice sheet:
Satellite views of a northeast section of Greenland comparing summer 2018 with summer 2019, after a major melt event. (Sentinel 2/European Union)
What stands out in both of these animations is the explosion in the amount of area colored in blue, revealing substantially increased melt water accumulating on the surface, as well as melt ponds.
In some areas, this melt water is gushing, cutting out crevasses and forming raging rivers. Studies have shown that melt water from the surface can work its way deep into the recesses of the ice sheet, lubricating the bottom of some glaciers and thereby speeding up the loss of ice mass.
This is a roaring glacial melt, under the bridge to Kangerlussiauq, Greenland where it's 22C today and Danish officials say 12 billions tons of ice melted in 24 hours, yesterday. pic.twitter.com/Rl2odG4xWj
— Laurie Garrett (@Laurie_Garrett) August 1, 2019
Detailed satellite imagery from Planet Labs Inc. from the past month shows just how quickly one of these melt water pools formed in northeast Greenland:
The emergence of a melt pond over northeast Greenland in July 2019. (Planet Labs Inc.)
In addition to the melt ponds, what also jumps out in the animations from the Sentinel 2 imagery is the big year-to-year transformation in the color of the ice sheet’s surface, from white to gray in many areas. The darkening of the ice surface speeds up melt, since it causes the ice to absorb more incoming solar radiation.
The loss of snow on the ice sheet began in the spring. The winter was relatively dry, particularly in southwest Greenland.
“The thin snow and spring warming led to a loss of snow and firn, exposing a much greater area of bare ice,” explained Thomas Mote, a professor of geography at the University of Georgia. “The exposed ice is much darker than the winter snow cover.”
Jason Box, a climate scientist who studies the ice sheet, said this loss of spring snow made it apparent by May that a major melt event on the ice sheet was likely this summer. The depleted snow cover meant there would be “less of a shield [to] buffer the abnormally high air temperatures,” he wrote in an email.
The bare ice exposed by the melted snow is thought to be a layer of glacial era ice that appears gray because it’s rich in dust, according to climate scientist Ruth Mottram of the Danish Meteorological Institute. “It then acts as a source of nutrients for all sorts of biology — primarily bacteria and algae that cause further darkening,” she said.Mottram says that rainfall also contributes to this darkening process. “I have seen glaciers being washed clean by rainfall in the middle of the melt season, so I suspect the very dark color this year is partly a result of the long warm period and the long dry period,” she said.
The southwestern Greenland animation also shows significant changes from 2018 to 2019 in the calving along the edge of the ice sheet at the coast, where it sheds giant pieces of ice.
“The calving front is very interesting,” Mottram said. “It looks like it has retreated and is calving bigger and more regular shaped icebergs this year. There is a link between melt rates and calving rates so it’s not surprising, but the shape of the fractures with more regular parallel crevasses suggests to me the glacier velocity has increased, possibly as a result of the long melt season.”
In other areas, satellite imagery reveals an active wildfire and a burn scare from a separate wildfire two summers ago:
Melt ponds🌊 in western Greenland, active 2019 wildfire🔥, and 2017 wildfire burn scar, #Greenland🇬🇱 1 August 2019 Enh. nat. col. #Copernicus #Sentinel-3🛰️ Full-size: https://t.co/Ecm3eT0erI #RemoteSensing #Wildfire Image is about 380 kilometers wide pic.twitter.com/HBHnffMeJX
— Pierre Markuse (@Pierre_Markuse) August 2, 2019
To scientists who study the ice, often traveling there each spring and summer to gather data, this week’s melt event demonstrates the increased pace of ice loss as a result of human-caused global warming, along with other factors.
Studies have shown that extreme ice melt periods like the one seen in 2012 typically occur about every 250 years, so the fact that another one is taking place only a few years later could be a sign of how climate change is upping the odds of such events, too.
What happens in Greenland may seem remote and disconnected from our everyday lives, but the ice sheet is already the biggest contributor to modern sea level rise and the medium and long-term viability of cities like Miami, New York, Norfolk and many others depends in part on the pace and severity of ice melt during the next few decades.
Every increment of sea-level rise provides a higher launchpad for storms to more easily flood coastal infrastructure, such as New York’s subway system, parts of which flooded during Hurricane Sandy in 2012. Think of a basketball game being played on a court whose floor is gradually rising, making it easier for shorter players to dunk the ball.
According to Mottram, the ice sheet sent 197 billion tons of water pouring into the Atlantic Ocean during July alone. This is enough to raise sea levels by 0.5 millimeter, or 0.02 inches, in a one-month time frame, said Martin Stendel, a DMI researcher.
Below find more imagery from Greenland:
The heat wave that smashed high-temperature records in five European countries a week ago is now over Greenland, accelerating the melting of the island's ice sheet. (Caspar Haarløv/Into the Ice/AP)
Rivers of melting water form on an ice sheet in western Greenland on Aug. 1. (Caspar Haarløv/Into the Ice/AP)
Large rivers of melting water form on an ice sheet in western Greenland and drain into moulin holes that empty into the ocean from underneath the ice on Aug. 1. (Caspar Haarløv/Into the Ice/AP)