

This really is (unless a nuclear bomb is unleashed) the most important news of the day.
But you on't find this in the Mass Media
Arctic Sea Ice Bounce Wiped Out as 2015 Summer Tracks Third Lowest on Record
5
August, 2015
It’s
been a rough summer for the Arctic sea ice. Extent values started off
at record low levels during late spring, melt ponding and warming
ramped up during early June, and July saw the ice pounded by intense
high pressure cells located on the Greenland side.

(Abnormally
hot water surrounds the Arctic sea ice on all sides. High sea surface
temperature anomalies in this range tend to aid in the maintenance of
late season melt momentum. Image source: DMI.)
Warm
Waters and Airs
Anomalously
warm water invaded from almost every side. The Kara saw extreme sea
surface temperature warming after an early ice recession, a flood of
warm water from rivers, and a powerful albedo flip to dark ocean from
white ice. The Chukchi, Beaufort, and East Siberian seas saw a
continued influx of anomalously warm waters from the Pacific side —
this flow was fed by the powerful and persistent blobs of warm water
in the Northeast Pacific. A heat invasion that has been ongoing for
that region since at least Winter. And in North Baffin Bay a pool of
anomalously hot water has combined with an extended period of warmer
than usual air temperatures to deliver heat to the remaining thick
ice along the Northern Greenland and Canadian Archipelago boundary.
Warm
Storms Smashing the Old Ice
By
August, a series of storms had invaded the Beaufort, Chukchi and East
Siberian Seas. Kicking up 20-35 mile per hour winds, they pushed 2-7
foot swells out through an expanding shattered ice zone. Though the
storms cooled the air, they tapped heat from the ocean itself through
the process of surface churning and the larger dynamic of cyclonic
Ekman pumping. All this motion and heat energy created a very
unfavorable environment for sea ice — essentially melting the ice
rafts out from the water line on up.


(Top
[July 22] and bottom [August 4] comparison of the same Beaufort grid
showing large rafts of multi-year ice gradually being smashed to
finer and finer pieces. Image source:LANCE
– MODIS.)
Large
pieces of multi-year ice were smashed together like rocks in the late
20th Century video game — asteroids. The ice, ground into
ever-finer bits by these storms, then felt the heat of the moving
waters and suffered an ongoing dissipation.
The
result is that the Beaufort ice is being steadily hollowed out. A
bank of thicker ice floes is expanding into the warmer waters of the
Chukchi and near-shore Beaufort as it melts. This leading ice edge,
though frail, is denser than the interior ice for scores of miles
where three large polynyas are in the process of joining into one. If
this keeps up for too much longer, the next ten-to-twenty days will
see the Beaufort ice and the Chukchi boundary ice practically wiped
out.
Melt
Invading Past 80 North
Meanwhile,
thinned ice and open water is gradually invading the Central Arctic
past the 80 North Latitude line.


(Arctic
sea ice appears to be in a terrible state in the AMSR2 visible
measure. Beaufort and Chukchi ice continues dramatic thinning.
Central Basin ice is retreating in numerous places behind the 80
North line. And the fabled Northeast Passage is open to shipping.
Image source: Uni
Bremen.)
Heat
from the Atlantic side is eating away at the ice edge there. Laptev
melt is biting in beyond the 80 North line. And the Beaufort storms
are basally melting and dispersing the Central Arctic boundary ice.
As a result, the monitors are showing sea ice that looks to be in a
very unhealthy state overall. The Northeast Passage is open and the
Northwest Passage appears to be just a week or two behind.
The
Rebound is Wiped out in all Major Monitors
As
a result of all this punishment, the sea ice monitors are looking
increasingly bleak.Japan’s
JAXA extent monitor is showing sea ice boundary measures in the same
range as third lowest year on record — 2011.
The National Snow and Ice Data Center measure is not too far behind
at just a hair above 2011 and 2010 — now
tracking at 5th lowest extent on record (a
loss of two places since last week). These extent measures are
swiftly catching up to the Cryosphere Today area totals that are now
also just a hair above 2011 at 4th lowest on record.
The area measure is also interesting in that overall area is at 4.13
million square kilometers —
which is now starting to dip below the 2005 line.
But
perhaps most concerning of all is the fact that sea ice volume, which
showed a brief bounce back from 2012 record lows during 2013 and
2014, is
now re-entering decline.
For According to PIOMAS, the ongoing punishment we have visibly seen
in the form of high atmospheric temperatures north of the Canadian
Archipelago and in remaining thick ice being swept into the billiards
pool that is the Beaufort has pushed that volume measure wel lbelow
the 2014 line and back toward recent record low years.
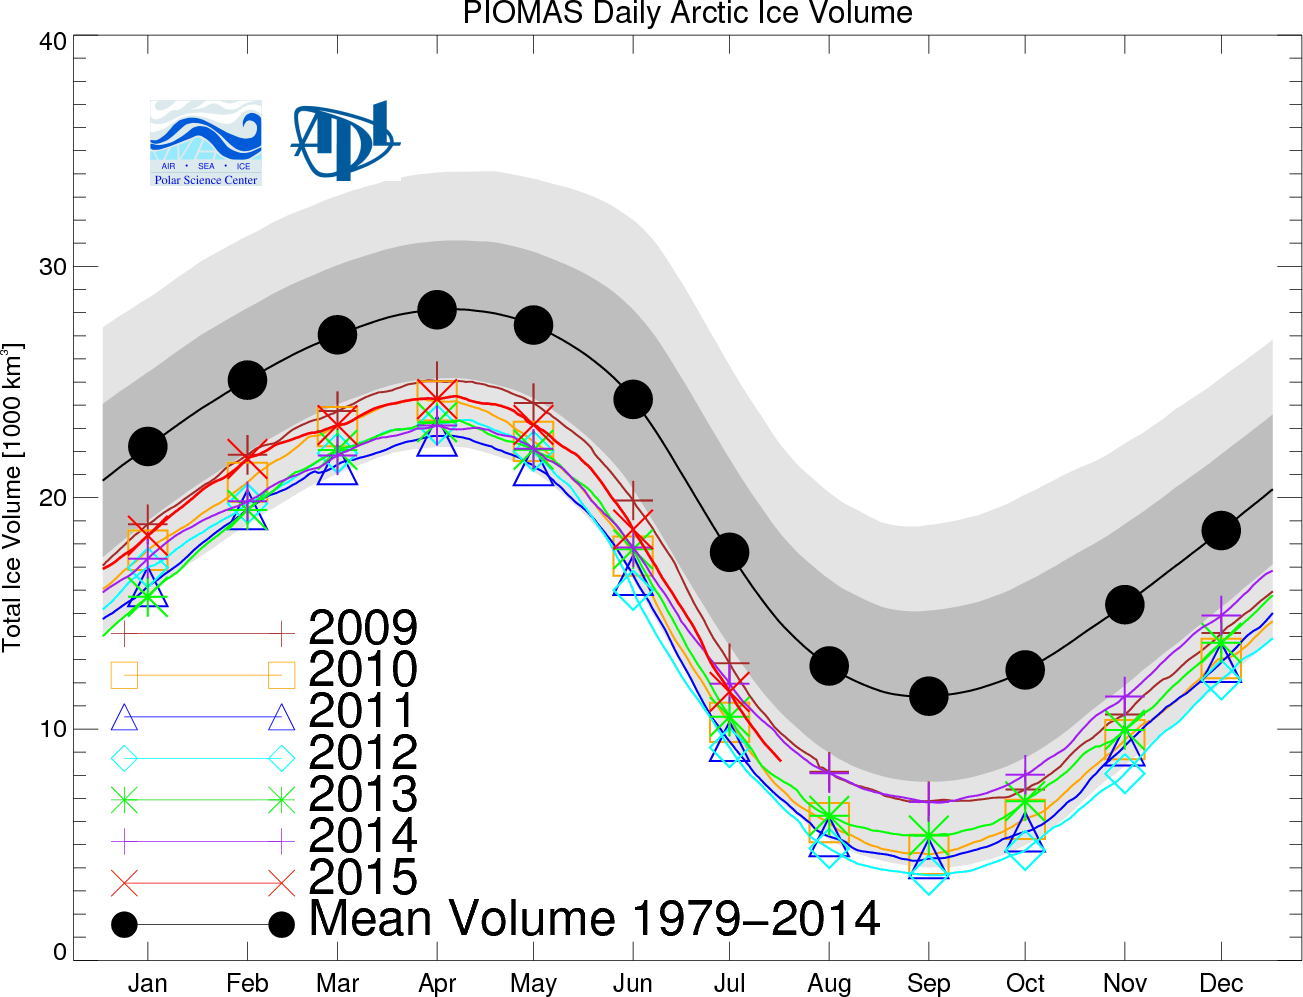
(PIOMAS
volume measure takes a nose-dive in July. Continued losses at this
rate would put sea ice volume in the range of lowest years recently
observed. Image source: PIOMAS.)
It’s
a steep nose dive. One that will start to challenge the upper
boundary of record low years without a slowing in the rate of losses
soon.
Storms,
Ocean Surface Warmth, El Nino Heat Transport, and Beyond 80 North
Melt Drive Late Season Loss Risk
With
a month and a half of melt still to go, we could see a softening in
this high rate of loss and an adjustment that brings use closer to
2014 for end season. Or we could see the steep rate of loss continue
to challenge the 2011 boundary in some measures and possibly even
break lower to challenge 2007. But given the melt momentum coming out
of July, it is very unlikely that measures return to 2014 levels. As
a result, it looks like the summer of 2015 is wiping out the
post-2012 sea ice bounce which, given the massive pace of
human-forced warming and failing to see large enough melt from
Greenland to counter that trend in the Arctic, appears to have been
inevitable.
Looking
forward there appears to be four factors that will play out their
final hands for 2015 melt. The first are those very warm sea surface
temperatures we mentioned earlier. The second is the fact that this
is an El Nino year featuring a very warm Northern Pacific and a
strong northward heat transport through the Canadian Archipelago and
Alaska. The third involves the weak sea ice and persistent storms in
the Beaufort, Chukchi, and ESS. And the final major factor involves
the strong advancement of melt into the Central Arctic and the higher
likelihood that the below 80 North boundary ice will be wiped out in
the coming weeks.

(The
northward propagation of anomalously warm ocean surface waters is bad
news for late season sea ice. Extremely warm Northeastern Pacific
surface waters and an associated El Nino warming of the Eastern
Pacific equatorial waters creates a pathway for warm air transport
into the Arctic over Alaska and Canada during late summer. Such a
situation may result in an extension of late season melt beyond the
September 15 date. Image source:NOAA
ESRL.)
Abnormally
warm sea surface temperatures plus the atmospheric feedback of El
Nino hint that more energy to melt ice may remain in the Arctic for
longer than during a typical year. Current transport of that
abnormally warm water into the Chukchi, East Siberian Sea, and the
Beaufort will continue. And the El Nino tendency to push warm air up
over Alaska and the Bering will be reinforced by the strong warming
in the lower Chukchi. These factors will tend to extend late season
melt. Over on the Atlantic side, a similar dynamic is starting to
come into play. Warm waters in the Laptev and Barents are
increasingly being driven against the edge ice past the 80 North
boundary line by warm southerly winds and through the action of storm
systems invading the upper North Atlantic. Over the past few days a
pattern has emerged in the models indicating an influx of these
storms past Iceland and into the Barents near Svalbard. Swell
propagation and warm water driven north will have a deleterious
effect on the ice there.
As
storms rise up from the North Atlantic, storms are predicted to
continue to plague the ice in the Beaufort, Chukchi and East Siberian
seas. According to GFS
model runs,
this tendency continues through at least the next five days. And with
warm air firmly in place over Alaska and the Chukchi, while cooler
air sits over the Beaufort, the gradient necessary to fuel these
storms will remain in play. Ocean
state forecasts pick
up seven foot swells in the East Siberian Sea tomorrow, nine foot
swells in the Chukchi on Friday, and 3-4 foot swells ranging the
thick ice billiard room in the Beaufort on Sunday. Swells in the
Laptev open water are also predicted to hit 6-7 feet over the coming
days.
Stepping
back and looking at the overall distribution of the sea ice, we find
that much of the beyond 80 North region is invaded by melt. A
substantial amount of weak boundary ice remains in the Beaufort, the
Chukchi, the East Siberian Sea, near the land regions of the Laptev,
and within the waterways of the Canadian Archipelago. Ice in these
outlier regions is traditionally more vulnerable to rapid melt and it
is doubtful that much of it will remain by end season.

(Arctic
Ocean sea ice extent measures are tracking in the range of 2012
according to the above graph by Wipneus. Low values that, entering
final stage melt for August and September, may swing the overall
measures lower come end season. Image source:Wipneus.)
Meanwhile,
the beyond 80 North melt invasion is substantial to the point that we
are now very close to the 2012 melt trend line in that key region. In
fact, pretty much all the interior Arctic Ocean seas show extent
values tracking near the 2012 record low line.
These
low Arctic Ocean values imply a deeper vulnerability to hitting lower
end season totals. A vulnerability the overall measures, so far have
missed.
Links:
NSIDC
No comments:
Post a Comment
Note: only a member of this blog may post a comment.