Showing posts with label global warning. Show all posts

Tuesday, 11 July 2017

A dire warning from Siberia

Gas pipelines supplying Europe 'in real danger from exploding tundra' - top scientist

By The Siberian Times reporter

10 July 2017

Pipes are built over bulging and unstable Arctic pingos prone to violent eruptions caused by 'thawing methane gas', as seen twice on the Yamal peninsula this year.

Yerkutinskaya funnel. Picture: Aleksandr Sokolov 
New analysis by satellite and helicopter shows  gas pipelines run right over swelling tundra which is deeply unstable due to the release of underground methane that had been frozen in permafrost - now thawing - for thousands of years, revealed Russia's leading expert on the new phenomenon, Professor Vasily Bogoyavlensky.
In one recent explosion, permafrost soil was thrown around 1 kilometre from the epicentre of the blast, highlighting the huge force, scientists discovered.
Flames shot into the sky, and a 50 metre-deep crater was formed from the eruption. 
The process is seen as caused by the warming Arctic climate and has vast implications for the energy industry in polar regions.
Pipes are built over bulging and unstable Arctic pingos prone to violent eruptions caused by 'thawing methane gas', as seen twice on the Yamal peninsula this year.
Seyakhinskaya funnel. Picture: Yamal Region  

Gas from Yamal is crucial to both Russia and the European energy system, with exports in particular to Poland and Germany. 
Some 7,000 pingos - scientific name hydrolaccoliths - have been identified in Yamal, and one estimate is that some 700 of these mounds could be prone to eruptions.
Most are harmless but the difficulty for experts is identifying which are dangerous.
'In a number of areas pingos - we see  both from satellite data with own eyes during helicopter inspections - they literally prop up gas pipes,' said the professor. 
'I would even use another term - in some places they jack up gas pipes. 
'Do you understand? They seem to begin to slightly bend these pipes.'
Pipes are built over bulging and unstable Arctic pingos prone to violent eruptions caused by 'thawing methane gas', as seen twice on the Yamal peninsula this year.

Pipes are built over bulging and unstable Arctic pingos prone to violent eruptions caused by 'thawing methane gas', as seen twice on the Yamal peninsula this year.

Pipes are built over bulging and unstable Arctic pingos prone to violent eruptions caused by 'thawing methane gas', as seen twice on the Yamal peninsula this year.

Pipes are built over bulging and unstable Arctic pingos prone to violent eruptions caused by 'thawing methane gas', as seen twice on the Yamal peninsula this year.

Pipes are built over bulging and unstable Arctic pingos prone to violent eruptions caused by 'thawing methane gas', as seen twice on the Yamal peninsula this year.
Yerkutinskaya and Seyakhinskaya funnels. Pictures: Aleksandr Sokolov, Yamal region  

Experts say villages and towns are also under threat, but the risk of explosions under gas supply pipelines is clearly acute. 
Alexander Mazharov, deputy head of the governor of Yamalo-Nenets autonomous region, said: 'It is cleat that it was not a meteorite, but gas emission.'
The explosion was in an Arctic river, and it was immediately submerged with water.  
'We did a good job as we took samples of water, soil and air. Now it is time for laboratories to give us results of analyses,' he said. 
Gas pipelines supplying Europe 'in real danger from exploding tundra' - top scientist
Professor Vasily Bogoyavlensky. Picture: Vesti Yamal 

Another crater - or funnel - that was found same week is called Yerkutinskaya. This is up to 10 metres in diameter and visible depth is 30 metres. 
'Based on satellite data, we have marked 7,000 bulges (pingos) - or even more,' said Bogoyavlensky, deputy director of the Oil and Gas Research Institute, Moscow.
'It doesn't mean that every pingo carries danger but it is still clear that we can draw certain conclusions. 
'Locals calls these bulges 'bugunyakhs'. In the West they are called pingos.'
Gas pipelines supplying Europe 'in real danger from exploding tundra' - top scientist

Gas pipelines supplying Europe 'in real danger from exploding tundra' - top scientist

Gas pipelines supplying Europe 'in real danger from exploding tundra' - top scientist
Scientists now believe that Yamal's landscape - pockmarked by round-shaped lakes - was substantially caused by this process over hundreds of years. 
This means it was not solely the recent 'global warming' that was responsible but more subtle rhythms of melting every decade with the Arctic Ocean ice cover melting by some 14%.
But it is only in the past three years that the formation of the new craters has been witnessed. 
In the case of the most recent explosion - now named Seyakhinskaya - it was witnessed by herders, and reindeer and dogs were seen fleeing in terror - see our previous report here.
Ice inside hydrolaccoliths thaws under the influence of high air temperature, say scientists.  Water takes less volume, while the vacant space is filled with a gas mixture, substantially methane. 
When the gas pressure inside the dome begins to exceed the pressure of the soil layer on the surface, gas gets out. 
Usually this happens as an emission, but in some cases, there is a fierce explosion. 


Trembling tundra of the Yamal Peninsula. Video credit Aleksandr Sokolov

Dr Bogoyavlensky believes the explosions are similar to the under-ocean eruptions of methane that caused the so-called Bermuda Triangle. 
The Yamal peninsula is now one of the world's key sites for production of natural gas for residential and industrial supplies, notably to Western Europe, for example by Gazprom.
Currently, there are three seismic stations on the Yamal peninsula, in Sabetta, Bovanenkovo and Kharasavey. 
Scientists believe at least six  permanent stations are required, with three more located in Urengoy, Bely island and Salekhard. 
The issue of Yamal tundra explosions is to addressed at the next meeting of the Russian government's state commission on exploration of the Arctic. 
Map of the newest Yamal funnels, and pictures of the funnel known as F1, registered in 2014. Pictures: The Siberian Times, Vasily Bogoyavlensky 
Gas pipelines supplying Europe 'in real danger from exploding tundra' - top scientist

Gas pipelines supplying Europe 'in real danger from exploding tundra' - top scientist

Gas pipelines supplying Europe 'in real danger from exploding tundra' - top scientist

Gas pipelines supplying Europe 'in real danger from exploding tundra' - top scientist

Gas pipelines supplying Europe 'in real danger from exploding tundra' - top scientist

Gas pipelines supplying Europe 'in real danger from exploding tundra' - top scientist

Tuesday, 2 May 2017

High temeratures in Greenland to precipitate melt

Early Greenland Melt Spike Possible as Forecast Calls for Temperatures of up to 50 F Above Average


1 May, 2017
Greenland — a region vulnerable to the slings and arrows of human-forced climate change — appears set to experience both considerable warming and a significant melt spike this week.
Starting on Wednesday, May 3, a sprawling dome of high pressure is expected to begin to extend westward from the far North Atlantic and out over Iceland. As the high pressure dome builds to 1040 mb over the next couple of days, its clockwise flow will thrust abnormally warm and moist air northward out of the Atlantic. This air-mass is expected first to over-ride eastern Greenland, then run up into Baffin Bay, finally encompassing most of the island and its vast, receding glaciers.
(May 5, 2017 GFS model run as shown by Earth Nullschool is predicted to produce widespread above-freezing temperatures over the surface of the Greenland Ice Sheet. Such warming is expected to be accompanied by rainfall over a number of glaciers. Image source:Earth Nullschool.)

Liquid precipitation is then expected to start falling over southern sections of the Greenland Ice Sheet as temperatures rise to 1-6 C (33 to 43 F) or warmer. Since water contains more latent heat energy than air, such rainfall is likely to produce more melt than would otherwise be caused by a simple temperature rise.

For those of us living in more southerly climes, a temperature of 6 C (43 F) may not sound very warm. But for the northeastern region of Greenland shared by the Zachariae, Brittania, Freja, and Violin Glaciers, such temperatures far exceed ordinary expectations for early May. They are anything but normal. In fact, the building influx of heat is more reminiscent to readings Greenland would have tended to experience during summer — if at all — under past climate averages.

(GFS model predictions for May 4 show widespread liquid precipitation falling over southern Greenland. Image source: Climate Reanalyzer.)

Unfortunately, the new climate presented by human-forced warming is now capable of producing some rather extraordinary temperature extremes. And the anomaly ranges that are predicted for the coming week are nothing short of outlandish.
According to climate reanalysis data, by May 5th, temperatures over northern and eastern Greenland are expected to range between 15 C above average over a wide region and between 20 and 28 C above average in the northeast. For the Fahrenheit-minded, that’s 27 to 50 degrees F above normal. Or the equivalent of a 102 F to 125 F May day high in Gaithersburg, MD.

(An amazing temperature spike is expected to ride up and over Greenland on May 3 to May 5. This warming is expected to produce very extreme above average temperatures for this time of year. Image source: Global and Regional Climate Anomalies.)

Overall excessions for Greenland temperature are also predicted to be quite extraordinary for the day — hitting nearly 9 degrees Celsius (16 F) above average for the whole of this large island. So much warmth extending so far inland and combining with liquid precipitation, if it emerges as predicted in these GFS climate models, is likely to produce a significant early season melt spike — especially over southern and eastern Greenland. In places, these temperatures exceed expected normal summer conditions for Greenland’s glaciers. So it is difficult to imagine a situation where a significant surface melt spike does not occur if these predicted temperatures emerge.
Links:


Wednesday, 2 November 2016

Record rate of increase in CO2 levels

2016 on Track for Record Rate of Atmospheric CO2 Increase


1 November, 2016

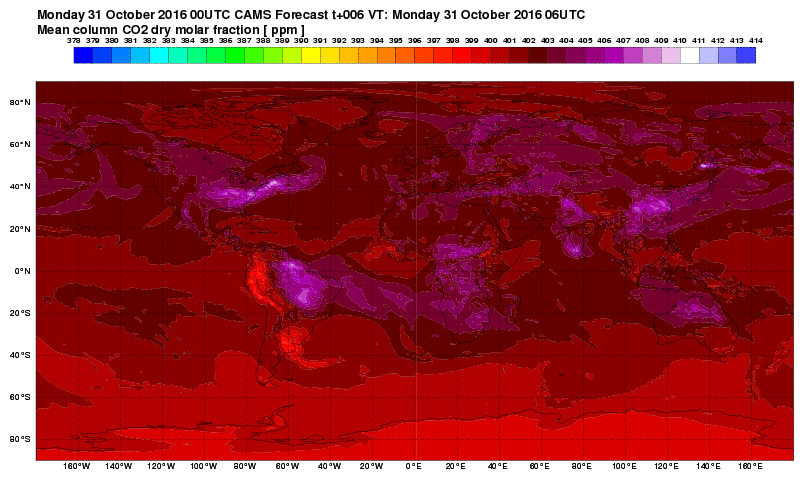
During 2016, the annual rate of atmospheric carbon dioxide increase will have hit a record 3.2 to 3.55 parts per million (ppm). By 2017, the amount of carbon dioxide in the Earth’s atmosphere will be roughly equivalent to concentrations last seen during the Middle Miocene climate epoch (404 to 410 ppm average). In other words, atmospheric CO2 is rising at a record rate and we are hitting levels of this heat-trapping gas that have not been seen in about 15 million years.
Record Rates of CO2 Increase

The world is struggling to make the necessary turn toward reducing fossil fuel-based carbon emissions. Global emissions have plateaued at or near new record highs during the past three years. Conflicts over fossil fuel cuts and transitioning to renewable energy embroil numerous countries. Climate change deniers hold significant power in places like the United States, the United Kingdom, Canada, and Australia. And facing off against those who would defend the harmful interests of what could well be called the most destructive industry to ever inhabit the planet, are a broad group of environmentalists, scientists, concerned citizens, and renewable energy advocates.

carbon-dioxide-october-2016-global
(Global carbon dioxide is approaching a level not seen since the Middle Miocene period around 15 million years ago when atmospheric concentrations typically averaged above 405 ppm and global temperatures were 3-4 degrees Celsius hotter than 19th-century averages. Record annual rates of CO2 increase in excess of 3 ppm each year for 2015 and 2016 are swiftly propelling us into a climate state that is more similar to this ancient epoch — a shift that is producing increasingly harmful global consequences. Image source: The Copernicus Observatory.)

As the political turmoil ramps up, it appears that the Earth’s oceans and biosphere are straining to draw in the massive volumes of these gasses that we’ve been pumping out. Annual atmospheric CO2 growth rates for 2015 were a record 3.05 ppm. 2016 appears to be on track to beat that high mark, being likely to see a new annual increase of between 3.2 and 3.55 ppm.

Hot Lands and Oceans Tend to Produce a Carbon Feedback

The previous most rapid annual rate of atmospheric CO2 increase was 2.93 ppm during the strong El Niño year of 1998. Back then, high ocean surface temperatures combined with warming-related wildfires and droughts which spanned the globe to reduce the Earth’s capacity to take in carbon. More carbon was squeezed out of hot soils, burning forests, and warming oceans. Less was drawn down. New record rates of atmospheric CO2 increase were breached.

the-keeling-curve-2-years
(Except for a couple of days, all of 2016 saw atmospheric CO2 levels above 400 ppm. Peak values as measured at the Mauna Loa Observatory in May were 407.7 ppm. By May 2017, atmospheric CO2 levels are likely to hit near 410 ppm — a level not seen in about 15 million years. Image source: The Keeling Curve/Scripps Institution of Oceanography.)

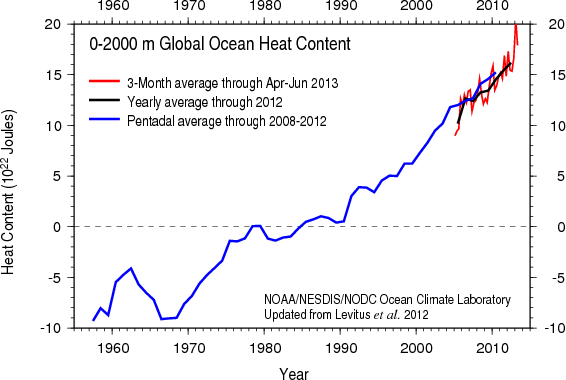
Even during the period of heightened heat stress that occurred in 1998, we did not see a year in which annual rates of CO2 increase exceeded 3 ppm. We have never, until 2015-2016, seen a time when there were two back-to-back years of such rapid rates of increase. Similar but worsening heat stress impacts have likely flagged what at first appeared to be an increased rate of carbon uptake from the biosphere during the late 2000s. Ocean heat content is now dramatically greater than during 1998 and this significant warming is likely having at least a periodic impact on the ocean’s rate of carbon uptake. Wildfires are now far more prolific, generating more atmospheric carbon. Droughts are more widespread and these tend to squeeze carbon from the soil. The Arctic is the warmest it’s been in 115,000 years and, as a result, some new Earth system carbon sources are starting to pop up.

Record High Rates of Fossil Fuel Emissions Hitting a Plateau

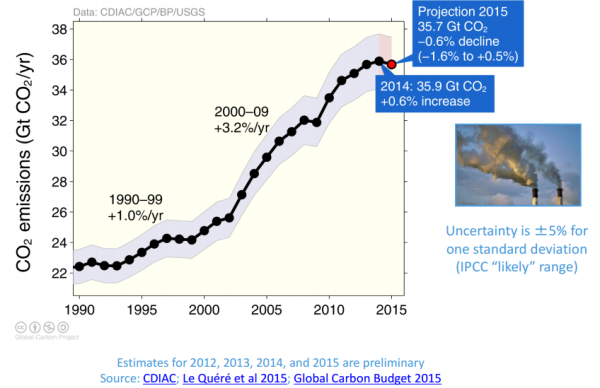
In the intervening years since 1998, global carbon emissions from fossil fuels have also jumped dramatically. During 1998, yearly CO2 emissions were in the range of 26 billion tons per year. By 2014-2015, these greenhouse gas releases had soared to around 35.8 billion tons per year. Through this period, average annual rates of CO2 increase continued to climb during the 2000s and 2010s.

global-carbon-project-emissions-2015
(Global carbon emission increases stalled during 2013, 2014, and 2015 according to The Global Carbon Project. But despite this recent pause, atmospheric rates of carbon dioxide increase have continued to ramp up. Due to a number of factors, including atmospheric and ocean inertia as well as temperature and saturation stress to global carbon stores, it is likely that significant reductions in carbon emissions from fossil fuels will be necessary to have a marked impact on annual rates of atmospheric CO2 increase.)

According to NOAA, the 1980s and 1990s saw yearly jumps in CO2 at the rate of about 1.5 ppm each year. By the 2000s, this average rate of increase had leaped to about 2 ppm per year. For the first six years of the 2010s, the average rate will likely be around 2.5 ppm per year.

New Records Provide Urgency For Rapid Emissions Cuts

This rate of increase roughly matches the overall rate of increase in emissions. As yet, there is no major global trend sign in the atmospheric CO2 data showing that carbon uptake from the oceans and the biosphere has been significantly curtailed, at least not to the point that it has shown up in the long term global trend. There are, however, widespread signs of stress to the Earth’s carbon storage system, and two years of 3 ppm-plus increase back-to-back is a warning blip on the climate radar.
In other words, these new record rates of CO2 increase are disturbing. If the annual increases do not fall back into the low 2-ppm per year range in 2017 and 2018, it will be an indication that some of the Earth’s ability to draw down carbon has been significantly hampered. If that is the case, then the urgency to draw down emissions is considerably greater.
Links:

Hat tip to SmallblueMike
(Note: This post focuses primarily on CO2 as an indicator. Overall CO2e levels will be covered in a separate exploration.)

Sunday, 20 March 2016

Ten Record Months in A Row

NOAA: 10th Record Month in A Row. Temperature Off the Charts


201602


AGU,
17 March, 2016


February 2016 was the hottest month ever measured on Earth. The planet broke a heat record for the 10th month in a row in February and we broke it by a record amount as well. The heat was nothing short of amazing with Alaska averaging out at over 12 degrees above normal. That is nothing less than stunning. The odds that this warmth is part of a natural cycle have been shown to be (depending on how you look at it) at least 1500 to one. More likely several thousand to a million to one. This heat is the result of rising greenhouse gas levels and the strong El Nino in the Pacific. El Nino events are always warm years globally, but to pass the record by this much would almost certainly not have happened if greenhouse gas levels were not the highest in many thousands of years.


201602 (1)
More from NOAA:


The combined average temperature over global land and ocean surfaces for February 2016 was the highest for February in the 137-year period of record, at 1.21°C (2.18°F) above the 20th century average of 12.1°C (53.9°F). This not only was the highest for February in the 1880–2016 record—surpassing the previous record set in 2015 by 0.33°C / 0.59°F—but it surpassed the all-time monthly record set just two months ago in December 2015 by 0.09°C (0.16°F). Overall, the six highest monthly temperature departures in the record have all occurred in the past six months. February 2016 also marks the 10th consecutive month a monthly global temperature record has been broken.


The average global temperature across land surfaces was 2.31°C (4.16°F) above the 20th century average of 3.2°C (37.8°F), the highest February temperature on record, surpassing the previous records set in 1998 and 2015 by 0.63°C (1.13°F) and surpassing the all-time single-month record set in March 2008 by 0.43°C (0.77°F).


Most of Earth’s land surfaces were warmer than average or much warmer than average, according to the Land & Ocean Temperature Percentiles map above, with record warmth notable across various areas of South America, much of southern Africa, southern and eastern Europe, around the Urals of Russia, and most of Southeast Asia stretching to northern Australia. Of significance, a vast region stretching from central Russia into eastern Europe, along with most of Alaska, observed February temperatures more than 5°C (9°F) above the 1981–2010 average, beyond the upper bounds of the Land & Ocean Temperature Departure from Average map shown above. A few pockets in Asia were cooler than average, including part of Far East Russia, with one area record cold in the upper Kamchatka Peninsula.


Select national information is highlighted below. (Please note that different countries report anomalies with respect to different base periods. The information provided here is based directly upon these data):
  • Australia observed its ninth warmest February since national records began in 1910, with a mean temperature 0.92°C (1.66°F) above the 1961–1990 average. The average maximum temperature for the country was eighth highest, at 1.43°C (2.57°F) above average.

  • New Zealand observed its second warmest February and second warmest month of any month since national records began in 1909, at 2.2°C (4.0°F) above the 1981–2010 average and behind February 1998 by only 0.1°C (0.2°F).

  • Strong west and southwest winds contributed to an average February temperature in Germany that was 3.0°C (5.4°F) above the 1961–1990 average.

  • February was the second warmest for Austria, behind 1966, since national records commenced in 1767, with a monthly temperature 4.1°C (7.4°F) higher than the 1981–2010 average. On February 22nd the temperature reached 23.2°C (73.7°F) in Pottschach in Lower Austria, tying the record for the warmest February day recorded in the country.

  • February was mild in Sweden, where monthly temperatures were generally 2–4°C (4–7°F) higher than the 1961–1990 average. In northeastern Norrland, Febraury temperatures were as high as 6°C (11°F) above average. However, 2014 and 2015 were both milder than February 2016.

  • In Canada, both minimum and maximum temperature records were set during a “roller coaster” month, according to the Ontario Weather Review. Early in the month, on February 3rd, the temperature in Toronto reached 16°C (60.8°F), the highest February temperature ever recorded for the city. A little over a week later, during February 13th–14th, cold air shot down from the north, breaking minimum temperature records across southern and part of northeastern Ontario. The temperature drop over that 10-day period was extreme. Among the most extreme, the town of Beatrice, to the east of Georgian Bay, went from a high temperature of 8°C (46°F) to a minimum of -41°C (-42°F), a difference of 49°C (88°F).

  • In the United States, Alaska reported its warmest February in its 92-year period of record, at 6.9°C (12.4°F) higher than the 20th century average. The contiguous U.S. was seventh warmest in its 122-year period of record, at 3.18°C (5.72°F) above average, with the west and extreme northeast observing the highest departures from average.

  • The average February temperature was about 3.0°C (5°F) higher than the 1981–2010 average in Venezuela and northern Colombia, while temperatures were about 0.5°C (0.9°F) below average in southern Argentina.


From NZ's NIWA


Monthly Climate Summary for February 2016


3 March 2016

Overview 

During February 2016, strong El Niño conditions continued but weakened in the tropical Pacific. Typically, more westerly to south-westerly air flows over New Zealand are associated with El Niño. However, this was not the case this month as significant tropical activity combined with higher than normal air pressure to the east of New Zealand and lower air pressure than usual south of the country produced more northerly to north-easterly winds than normal over the North Island and more north-westerlies than normal over the South Island.

Air temperature

The increased prevalence of air flow from northerly directions during February channelled warm and humid air originating in the tropics towards New Zealand. This was the primary reason behind the humid conditions in the North Island and the exceptionally warm month for New Zealand as a whole. Remarkably, almost every climate station around the country recorded well above normal temperatures (>1.20 °C above February average) for the month. The nationwide average temperature in February 2016 was 19.5°C (2.2°C above the 1981-2010 February average from NIWA’s seven station temperature series which begins in 1909)[1].
This was the second warmest February, and second warmest of any month, on record. The warmest February and month on record is February 1998, where the mean temperature (according to the seven station series) was 19.6°C.

Rainfall 

The moist tropical air masses (including remnants of tropical cyclones Tatiana and Winston) that affected New Zealand in February not only brought warm temperatures and high humidity, but also significant rainfall to some parts of the country. Rainfall was well above normal (>149% of February normal) in Nelson as well as parts of Northland, Auckland, the Bay of Plenty, Waikato, Tasman, the West Coast and Southland. Conversely, rainfall was well below normal (<50% of February normal) for the eastern portions of Gisborne, Hawke’s Bay, Manawatu-Whanganui, Wellington, Canterbury and Otago.

Soil moisture

As of 1 March 2016, soil moisture levels were above normal for the time of year for eastern Northland and Auckland, Coromandel, the Bay of Plenty, northern Tasman, Nelson and parts of eastern Waikato and Southland. Drier than normal soils were evident in the remainder of the North Island as well as eastern parts of Canterbury and Otago.

Sunshine

Sunshine in February was generally above normal (110-125%) or well above normal (>125%) in the South Island and southern parts of the North Island. Below normal (75-89%) sunshine was recorded in the Bay of Plenty and parts of Waikato. In particular, Tauranga had its cloudiest February on record, with records extending back to 1933. Auckland and Northland recorded near normal February sunshine hours (90-109%).

Highlights

Further Highlights:
  • The highest temperature was 35.5°C, observed at Clyde on 3 February.
  • The lowest temperature was 1.9°C, observed at Manapouri on 10 February.
  • The highest 1-day rainfall was 331 mm, recorded at North Egmont on 17 February.
  • The highest wind gust was 148 km/hr, observed at South West Cape on 28 February.
    • Of the six main centres in February 2016, Auckland was the warmest, Dunedin was the coolest, Christchurch was the driest, Wellington was the sunniest and Tauranga was the wettest and cloudiest.
    • Of the available, regularly reporting sunshine observation sites, the sunniest four locations in 2016 so far (1 January – 29 February) were Richmond (573 hours), New Plymouth (543 hours), Blenheim (522 hours) and Masterton (517 hours).

Download 


Reposting from earlier in the week

Well, catastrophic climate change has made it onto the soundwaves of mainstream television in the form of an interview with the infamous Paul Henry.

You can see that NIWA scientist Chris Brandolino is more than slightly anxious to get his message out. To be fair Paul hears him out until a certain point where he collapses into nervous laughter and the interview is more or less complete.

What is really revealing is Paul Henry himself.

Like Donald Trump in the US Paul Henry is a perfect representation of the average “civilised” New Zealander who would (literally) rather destroy his own nest and die rather than make any changes to his/her lifestyle.

So is the perfect person to help deliver the message.

He is 'Mr. Average' climate change denier and his response is that that I have encountered time after time after time.

Change the station and move on.

I encountered a quote that said something like – I do not fear the fascist as fascist. What is dangerous is the fascist dressed up like a democrat.

In this context, far more dangerous than Paul Henry (who in his own way allows the message to get out) are the Kim Hills and Guyon Espiners – the civilised fascists of Radio New Zealand - who will try every sophisticated trick in the book to stop educated New Zealanders from knowing the truth.

On this one at least. I would rather have Paul Henry who,if nothing else, is straightforward.

Here is Martyn Bradbury on the same item.

Climate Denier Paul Henry shocked at climate change – laughs it off anyway
Our total denial of the realities we face if we do not make significant changes now is as bewildering as our blind ignorance. We deserve political leaders who will lead, not make excuses. The very existence of us as a species demands it.

paul-henry_0
15 March, 2016

The simple, brutal truth is that man made pollution has passed a tipping point where the feedback loops built into the biosphere are now beyond our ability to control. We are facing catastrophic climate change now – which makes the Green Parties and NGOs celebrations at Paris so galling…
February breaks global temperature records by ‘shocking’ amount
February smashed a century of global temperature records by “stunning” margin, according to data released by Nasa.
The unprecedented leap led scientists, usually wary of highlighting a single month’s temperature, to label the new record a “shocker” and warn of a “climate emergency”
The Nasa data shows the average global surface temperature in February was 1.35C warmer than the average temperature for the month between 1951-1980, a far bigger margin than ever seen before. The previous record, set just one month earlier in January, was 1.15C above the long-term average for that month.
“Nasa dropped a bombshell of a climate report,” said Jeff Masters and Bob Henson, who analysed the data on the Weather Underground website. “February dispensed with the one-month-old record by a full 0.21C – an extraordinary margin to beat a monthly world temperature record by.”
“This result is a true shocker, and yet another reminder of the incessant long-term rise in global temperature resulting from human-produced greenhouse gases,” said Masters and Henson. “We are now hurtling at a frightening pace toward the globally agreed maximum of 2C warming over pre-industrial levels.

…climate deniers like far right hate speech blogger Cameron Slater and climate minimalists like David Farrar have been allowed to dominate the debate – they need to be held accountable for their lies and muddying of the waters. Well known climate denier Paul Henry on his one hand clapping show this morning was confronted by the facts by a Scientist and then laughed them off.
The speed of the climate meltdown has shocked scientists and has highlighted how ineffective the IPCC has really been by not including the worst case scenarios as likelihood.

As the planet super heats because of the CO2 we pump into the atmosphere, more and more heat is trapped. That heat pushes temperatures up, those temperatures melt ice at the polar caps. This melting ice does two things. Firstly it reduces the amount of white space on the planet that simply bounces heat back into space so it ends up quickening the heating process and more importantly it puts more fresh water into the oceans. As heat build, frozen methane trapped on the ocean floor and in Siberia is released in massive amounts, this rapidly melts remaining glaciers desalinating ocean conveyor pumps, particularly in the Labrador and Irminger Seas around southern Greenland which shut down the flow of heat from the tropics north which in turn plunges the Northern hemisphere into a new ice age.
Within the space of a decade we can go from a 7 degree hike in temperatures to a frozen snowball.
The ability for most species to adapt to that kind of climate extreme will see many become extinct and the ability for Governments and civilisations to function crumble.
We need to be on a war footing to cope with the changes we need to implement, not some foot dragging irrelevancy.
Our total denial of the realities we face if we do not make significant changes now is as bewildering as our blind ignorance. We deserve political leaders who will lead, not make excuses. The very existence of us as a species demands it.
Next week the oil conference on Monday will be held at Sky City Casino. The only response now is civil disobedience.


To watch the Paul Henry interview GO HERE


Guy McPherson was interviewed by the very same Paul Henry back in October, 2014 on his visit to New Zealand.

To watch an October, 2014 interview with Guy McPherson GO HERE

World weather today (temperature anomalies)