The Growing Role of Minerals and Metals for a Low Carbon Future – World Bank 2017 – To get 50% of global energy from renewables requires: – 100% more silver – 920% more indium – 2,700% more lithium – Lithium requires 500,000 gallons of water to produce a single ton
The value of global magnet rare earth oxide consumption will rise five-fold by 2030. The rate of demand growth for magnet rare earths would soon reach “escape velocity” – a point in yearly demand growth where it is so great that it is simply implausible for the already-lagging supply-side to catch up and keep up.
Jeff Gibbs, is the director, writer, and producer of “Planet of the Humans" and was co-producer of “Bowling for Columbine” and “Fahrenheit 9/11.” He was born in Flint, Michigan.
The
smoggy city of Baoding is known for two things: donkey burgers, and
solar panels. An industrial centre just south of Beijing — 45
minutes via high-speed rail — the city’s high-tech zone styles
itself as “Power Valley” because it is home to so many solar
manufacturers.
But
for Vincent Yu, deputy general manager at Yingli Solar, one of the
first renewables companies to set up in the city, business has been
difficult lately. “These last two years, there has been a lot of
pressure. The subsidies for solar projects have fallen,” Mr Yu
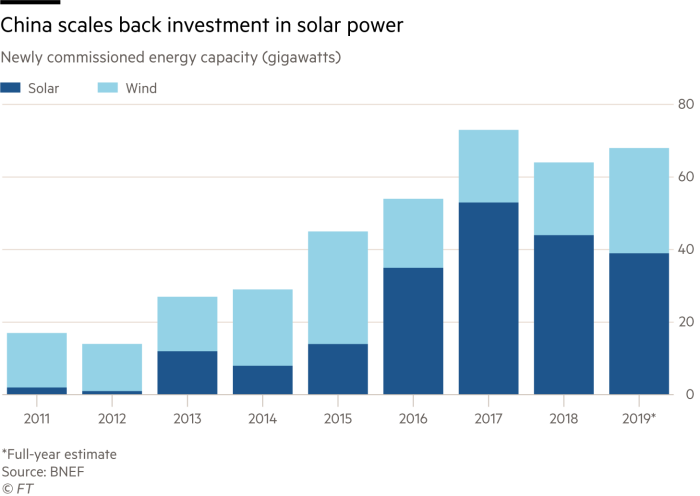
says. New solar installations in China — running at 53 gigawatts in
2017 when demand peaked — will be about 40 per cent lower this
year, he estimates.
The
photographs in his office show Yingli in its glory days a decade ago.
Sales were surging and the company spent millions sponsoring the 2010
and 2014 football World Cup tournaments. Yingli was the world’s
largest solar-panel maker in 2012 and 2013, exporting all over the
globe and celebrated in China as a national champion. Its huge
factory campus in Baoding still nods to that status, with a spacious
museum dedicated to the company’s history as a solar pioneer.
Today
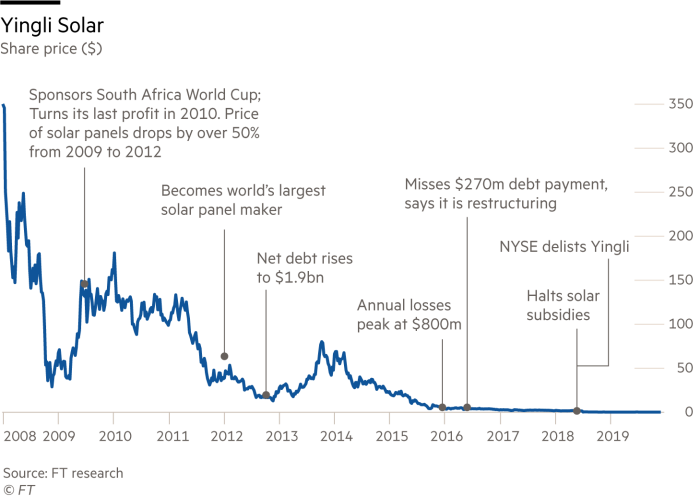
Yingli is insolvent. It has been defaulting on debt payments since
2016, and in 2018 it was kicked off the New York Stock Exchange
because its market capitalisation had sunk below the minimum $50m
threshold. Although Yingli still makes solar panels, its factories
operate at a loss and the most valuable asset it has left is the land
underneath them. Some question how Yingli is still operating. But
analysts believe the political connections of its founder may have
helped stave off creditors.
The
company is the highest profile casualty of a change in policy that is
being felt across the renewable energy sector in a country once
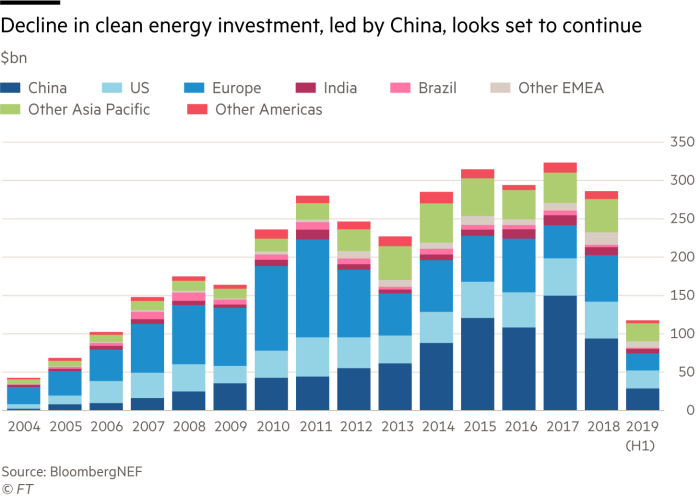
celebrated as the world’s clean energy champion. Chinese investment
in clean energy is plummeting — down from $76bn during the first
half of 2017, to $29bn during the first half of this year.
For
the annual UN climate talks, starting next Monday, that is alarming.
Concerns
over the impact of climate change have never been higher. But the gap
between what countries should be doing, and what they are actually
doing — pumping rising levels of carbon dioxide into the air —
has never been greater. With the US withdrawing from the Paris
climate accord, an increasing amount of attention is on China.
The
country is both the greenest in the world, but also the most
polluting. It has more wind and solar power than anybody else, yet it
is also the world’s biggest builder of new coal plants. Last year,
its emissions hit a record high, accounting for more than half of the
global increase in energy-related CO2 emissions in 2018, according to
the International Energy Agency. This year, Chinese emissions are
expected to grow about 3 per cent from 2018.
“Everything
is at stake for the planet, because the Chinese economy is so much
bigger than any other,” says Adair Turner, chair of the Energy
Transitions Commission. “Even the whole of Europe is considerably
less than Chinese emissions.”
He
points to China’s current pledge, that its CO2 emissions will peak
by 2030, and says it is nowhere near ambitious enough. “Let’s be
clear, if that was all China ever did, then we are on the path to
climate disaster,” says Lord Turner, who is lobbying for China to
consider a target of net zero emissions by 2050. “That is true of
all the [countries that have made pledges under the Paris
accord] . . . everyone has always known there would have to
be very significant improvements, to get us anywhere close to 2C.”
The
Paris climate accord, of which China is a signatory, pledges to limit
global warming to well below 2C. But that goal looks increasingly out
of reach. The world is on track for 3C of global warming by the end
of this century, if current trends continue. That would mean higher
sea levels of as much as 1m, threatening more than 600m people in
low-lying and coastal areas, according to a recent report from the
UN’s Intergovernmental Panel on Climate Change.
The
climate pact is under attack from many sides, and the US is
withdrawing from the agreement entirely, on President Donald Trump’s
orders. Fraying multilateralism has further eviscerated the climate
accord, which lacks any enforcement mechanism. China — distracted
by a slowing economy, the US trade war and protests in Hong Kong —
is not the only reason why the planet is on course for devastating
climate change, but it is near the top of the list.
“The
general momentum on climate and environment issues has been declining
[in China],” says Li Shuo, senior global policy adviser at
Greenpeace. Climate change has become a lower priority for Beijing.
“There is less space for the green agenda,” he says.
China’s
investment in renewable energy fell 39 per cent in the first half of
this year, compared with the same period in 2018, according to data
from Bloomberg New Energy Finance. Beijing yanked subsidies for solar
panel projects in the middle of last year, and is shrinking those for
wind, causing an abrupt shift.
“This
is probably a low point,” says Li Junfeng, a senior renewable
energy
policymaker
and head of the National Centre for Climate Change Strategy Research,
part of the government planning ministry. “The new policy is not in
place yet, and the old policy [of subsidies] has been stopped.”
Five
years ago, when the economy was growing robustly, Beijing saw
stronger environmental policies as core to its economic
transformation away from energy-intensive heavy industry. Today, with
the economy growing at its slowest pace since the early 1990s, that
has changed.
“The
highest political priority in China is trying to stabilise the
economy,” says Kevin Tu, an energy economist who previously led the
China desk at the IEA. “Anything else, including environmental
protection, especially climate change, will have to make some room
for these political priorities.”
On
paper, China’s climate targets have not changed: Beijing has
pledged that its carbon dioxide emissions will peak by 2030, and that
it will draw 20 per cent of its primary energy from non-fossil
sources by that same date. Yet that promise would allow China to keep
increasing its emissions for the next decade, with devastating
implications for the planet. Its investments in the Belt and Road
Initiative, under which state banks have earmarked more than $30bn to
build coal-fired power plants in other countries, is also adding to
global emissions.
China’s
participation in the Paris climate pact in 2015 was heralded as a
great victory by activists. Convincing Beijing to set climate targets
was a top priority for the Obama administration. But baked into the
negotiations was an expectation that China would achieve its
emissions target much earlier than 2030. Next year will be crucial,
as countries that signed the Paris accord are supposed to submit
enhanced targets — but the mood in Beijing makes a tougher climate
goal less likely for China.
Mr
Li says deteriorating relations between the US and China — along
with the unrest in Hong Kong — have helped fuel a growing
nationalist sentiment and a broader anger at the west.
One
of the targets of this nationalist ire has been Greta Thunberg, the
Swedish teenage activist who is revered as a climate hero in some
parts of the world. “Many netizens see [Greta] as representing the
general liberal western agenda,” says Mr Li. “There is this
larger perspective that the west is ganging up against China.”
At
the same time, coal appears to be again in the ascendant with Li
Keqiang, China’s premier, last month identifying it as a priority
area. China remains the world’s biggest producer. Many see this as
part of a growing focus on energy security in Beijing, a result of
Chinese leaders being spooked by deteriorating relations with the
west. “Energy security anxiety is a blessing for the coal [sector]
in China,” says Mr Tu.
Policymakers
are also focused on keeping the cost of power cheap to help stimulate
the economy, so from January the price of electricity from coal-fired
power plants, which is centrally regulated, will be allowed to
fluctuate, and is expected to fall.
These
factors have compounded the pain for the renewable energy industry.
After benefiting from generous subsidies for more than a decade,
Beijing axed solar subsidies without warning last year. The payments
due have created a deficit of around Rmb200bn ($28bn) in the
renewable energy development fund that was paying out the subsidies.
Frank
Haugwitz, founder of Asia Europe Clean Energy (Solar) Advisory in
Hong Kong, says the subsidies contributed to a solar surge that
exceeded the government’s expectations, triggering the sudden cut.
The
dice are now loaded in coal’s favour. The new policies for
renewable energy are focused on grid parity — only building wind
and solar projects that can compete with the price of coal. Yet with
coal power prices dropping, and a glut of new coal-fired power
stations coming online, it may be challenging for wind and solar to
compete. In the wind industry, there has been a rush of projects this
year as developers try to capture the last of the subsidies.
The
diplomatic pressure on China to improve its climate targets has been
played out in public. During a state visit from Emmanuel Macron, the
French president, earlier this month, both sides issued a joint
declaration, vowing that the Paris climate deal was “irreversible”,
and promising new climate targets aimed at the middle of the century.
Chinese
policymakers such as Li Junfeng say the pressure is misplaced, as
China is likely to exceed existing climate targets, even if it does
not officially adopt new goals. “Now that the US has withdrawn from
the Paris agreement, the entire global response to climate change is
shifting,” he says. “We have to be realistic . . . There’s
no point in being in a rush.”
He
also points out that China has achieved, and far surpassed, most of
its previous climate targets. A pledge to cut carbon intensity —
the amount of carbon produced per unit of GDP — by between 40 and
50 per cent by 2020, compared with 2005 levels, was achieved three
years early. It also overachieved on its targets for solar
installations, although this runaway growth led to the subsidy
deficit.
For
many years, action on climate change was the one area that Beijing
and western capitals could usually agree on. Even the most hawkish
western politician would hold up China’s climate record as an
example to be praised.
But
that may be changing. “It is going to sour for sure, if China
doesn’t move in the right direction, quickly enough,” says Todd
Stern, the chief US negotiator for the Paris agreement, who adds
there is simply “less leeway” now in terms of global emissions.
“We can’t possibly do what we need to do, unless China is doing
quite a bit.”
“We
are sort of entering a new world now . . . It is not just a
sense of urgency, it is the math. Do the math, and you will see
whether we are doing enough,” says Mr Stern. “The Paris agreement
is going to rise and fall, on the level of political will in
constituent countries. That has always been true.
“The
fault is that there is a lack of political will in virtually every
country, compared to what there needs to be.”
Solar
eclipsed: a pioneering panel-maker retrenches
Stepping
on to the Yingli campus in Baoding is like stepping back in time.
Employees wear a dark navy jumpsuit with the Yingli sunburst logo on
one shoulder and a Chinese flag on the other, giving the place a
distinctly communal feel. In front of a large assembly yard, a big
stage is decorated in honour of the recent 70th anniversary of the
founding of the People’s Republic of China, plastered with slogans
such as “remember your mission” and “help each other”.
The
company’s problems began at least five years ago, as mounting debt
levels combined with plummeting panel prices. Its dire financial
situation became evident in May 2016, when Yingli failed to meet a
$270m loan payment. Discussions with debtholders, the largest of
which is China Development Bank, have since failed to reach
conclusion. Shareholders fear the worst: Yingli’s shares on the
pink sheets — the over-the-counter market for companies not listed
on a major exchange — are trading at just 15 cents a share. The cut
in government subsidies for solar projects has only compounded the
challenges.
Miao
Liansheng, the founder who started his career in the army before
becoming an entrepreneur, was once ranked among China’s richest
individuals. Mr Miao lives on the Yingli campus, and employees say
that he still makes daily appearances to chat with workers.
But
today there are fewer workers than there used to be. Many of the
factory production lines are quiet. It’s not clear if some are
under maintenance, or if they have simply been idled. The company
once had around 20,000 employees, but that has fallen to just over
6,000, according to deputy general manager Vincent Yu. This year it
will produce panels with capacity of 2.5GW-3.5GW, he says, equivalent
to about 3 per cent of global demand.
The
Yingli museum shows that the company was, in many ways, a pioneer. It
boasted the first automatic soldering equipment in China in 2005 and
the first automatic module production line in 2007. But its equipment
quickly became outdated, allowing newer entrants to undercut them.
Starting
a decade ago, China’s state support for solar panel manufacturers
led to overcapacity and vicious price wars. This pushed down the
price of solar panels — to the benefit of the rest of the world —
but meant that margins were razor-thin, or negative, for panel
manufacturers in China.
A
new study by Ferroni and Hopkirk [1] estimates the ERoEI of temperate
latitudesolar
photovoltaic (PV) systems to be 0.83. If correct, that means more
energy is used to make the PV panels than will ever be recovered from
them during their 25 year lifetime. A PV panel will produce more CO2
than if coal were simply used directly to make electricity. Worse
than that, all the CO2 from PV production is in the atmosphere today,
while burning coal to make electricity, the emissions would be spread
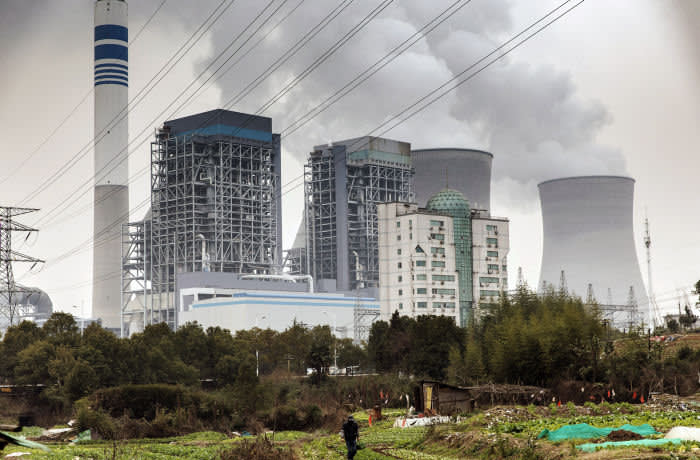
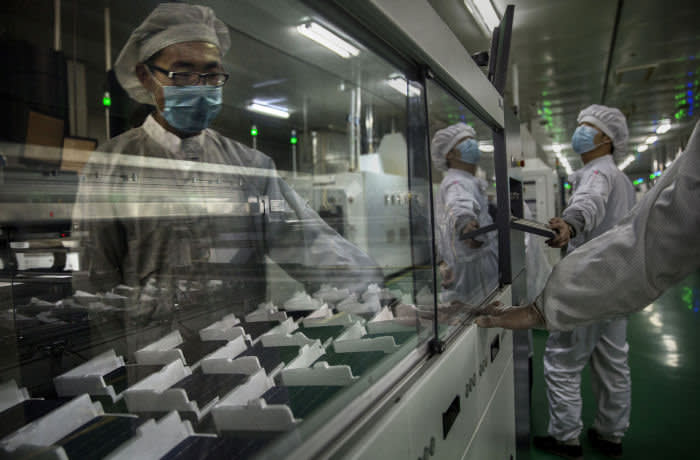
over the 25 year period. The image shows the true green credentials
of solar PV where industrial wastelands have been created in China so
that Europeans can make believe they are reducing CO2 emissions
(image
credit Business Insider).
I
have been asked to write a post reviewing the concept of energy
return on energy invested (ER0EI) and as a first step in that
direction I sent an email to my State-side friends Charlie Hall, Nate
Hagens and David Murphy asking that they send me recent literature.
The first paper I read was by Ferruccio Ferroni and Robert J. Hopkirk
titled Energy
Return on Energy Invested (ERoEI) for photovoltaic solar systems in
regions of moderate insolation [1] and
the findings are so stunning that I felt compelled to write this post
immediately.
So
what is ERoEI? It is simply the ratio of energy gathered to the
amount of energy used to gather the energy (the energy invested):
ERoEI
= energy gathered / energy invested
Simple,
isn’t it? Well it’s not quite so simple as it appears
at first sight. For example, using PV to illustrate the point, the
energy gathered will depend on latitude, the amount of sunshine, the
orientation of the panels and also on the lifetime of the panels
themselves. And how do you record or measure the energy invested? Do
you simply measure the electricity used at the PV factory, or do you
include the energy consumed by the workers and the miners who mined
the silicon and the coal that is used to make the electricity?
Ferroni and Hopkirk go into all of these details and come up with an
ERoEI for temperate latitude solar PV of 0.83. At this level, solar
PV is not an energy source but is an energy sink. That is for
Switzerland and Germany. It will be much worse in Aberdeen!
Why
is ERoEI important? It is a concept that is alien to most
individuals, including many engineers, energy sector employees,
academics and policy makers. The related concept of net energy is
defined as:
Net
Energy = ERoEI – 1 (where 1 is the energy invested)
Net
energy is the surplus energy left over from our energy gathering
activities that is used to power society – build hospitals,
schools, aircraft carriers and to grow food. In the past the ERoEI of
our primary energy sources – oil, gas and coal – was so high,
probably over 50, that there was bucket loads of cheap energy left
over to build all the infrastructure and to feed all the people that
now inhabit The Earth. But with the net energy equation for solar PV
looking like this:
0.83-1
= -0.17
…..
Brussels we have a problem!
So
how can it be possible that we are managing to deploy devices that
evidently consume rather than produce energy? The simple answer is
that our finance system, laws and subsidies are able to bend the laws
of physics and thermodynamics for so long as we have enough high
ERoEI energy available to maintain the whole system and to subsidise
parasitic renewables. Try mining and purifying silicon using an
electric mining machine powered by The Sun and the laws of physics
will re-establish themselves quite quickly.
In
very simple terms, solar PV deployed in northern Europe can be viewed
as coal burned in China used to generate electricity over here. All
of the CO2 emissions, that underpin the motive for PV, are made in
China. Only in the event of high energy gain in the PV device would
solar PV reduce CO2 emissions. More on that later
Energy Return
The
calculations are all based on the energy produced by 1 m^2 of PV.
Theoretical
calculations of what PV modules should generate made by manufacturers
do not take into account operational degradation due to surface dirt.
Nor do they take into account poor orientation, unit failure or
breakage, all of which are quite common.
The
actual energy produced using Swiss statistics works out at
106kWe/m^2 yr
We
then also need to know how long the panels last. Manufacturers claim
30 years while empirical evidence suggests a mean scrapage age of
only 17 years in Germany. Ferroni and Hopkirk use a generous 25 year
unit life.
Combining
all these factors leads to a number of 2203kWe/m^2 for the life of a
unit.
Energy
Invested
The
energy invested calculation is also based on 1 m^2 of panel and uses
mass of materials as a proxy for energy consumed and GDP energy
intensity as a proxy for the labour part of the equation.
Two different
methods for measuring energy invested are described:
ERoEI(IEA)
ERoEI(Ext)
Where
IEA = methodology employed by the International Energy Agency and Ext
= extended boundary as described by Murphy and Hall, 2010 [2,3]. The
difference between the two is that the IEA is tending to focus on the
energy used in the factory process while the extended methodology of
Murphy and Hall, 2010 includes activities such as mining, purifying
and transporting the silicon raw material.
In
my opinion, Ferroni and
Hopkirk correctly follow the extended ERoEI methodology
of Murphy and Hall and include the following in their calculations:
Materials to
make panels but also to erect and install panels
Labour at
every stage of the process from mining manufacture and disposal
Manufacturing
process i.e.
the energy used in the various factories
Faulty
panels that
are discarded
Capital which
is viewed as the utilisation of pre-existing infrastructure and
energy investment
Integration of
intermittent PV onto the grid
And
that gives us the result of ERoEI:
2203
/ 2664 kW he/m^2 = 0.83
The
only point I would question is the inclusion of the energy cost
of capital. All energy produced can be divided into energy used to
gather energy and energy for society and I would question whether the
cost of capital does not fall into the latter category?
But
there appears to be one major omission and that is the energy cost of
distribution. In Europe, about 50% of the cost of electricity
(excluding taxes) falls to the grid construction and maintenance. If
that was to be included it would make another serious dent in the
ERoEI.
This
value for ERoEI is lower than the value of 2 reported by Prieto and
Hall [4] and substantially lower that the values of 5 to 6 reported
by the IEA [5]. One reason for this is that the current paper [1] is
specifically for temperate latitude solar. But Ferroni and
Hopkirk also detail omissions by the IEA as summarised below.
IEA
energy input omissions and errors
a) The
energy flux across the system boundaries and invested for the labour
is not included. b) The
energy flux across the system boundaries and invested for the capital
is not included. c) The
energy invested for integration of the PV-generated electricity into
a complex and flexible electricity supply and distribution system is
not included (energy production does not follow the needs of the
customer). d) The
IEA guidelines specify the use of “primary energy equivalent”
as a basis. However, since the energy returned is measured as
secondary electrical energy, the energy carrier itself, and since
some 64% to 67% of the energy invested for the production of
solar-silicon and PV modules is also in the form of electricity
(Weissbach et al., 2013) and since moreover, the rules for the
conversion from carrier or secondary energy back to primary energy
are not scientifically perfect (Giampietro and Sorman, 2013), it is
both easier and more appropriate to express the energy invested as
electrical energy. The direct contribution of fossil fuel, for
instance in providing energy for process heating, also has to be
converted into secondary energy. The conversion from a fossil fuel’s
internal chemical energy to electricity is achieved in modern power
plants with an efficiency of 38% according to the BP statistic
protocol (BP Statistical Review of World Energy, June 2015). In the
present paper, in order to avoid conversion errors, we shall continue
to use electrical (i.e. secondary) energy in kW he/m2 as our basic
energy unit. e) The
recommended plant lifetime of 30 years, based on the experiences to
date, must be regarded as unrealistic. f) The
energy returned can and should be based on actual experimental data
measured in the field. Use of this procedure will yield values in
general much lower than the electricity production expected by
investors and politicians.
Of
those I’d agree straight off with “a”, “c” and “f”. I’m
not sure about “b” and “e” I’m sure this will be subject to
debate. “d” is a complex issue and is in fact the same
one described in my recent post EU
and BP Renewable Electricity Accounting Methodologies.
I agree with Ferroni and Hopkirk that units of electricity
should be used throughout but if the IEA have grossed up the
electricity used to account for thermal losses in power stations then
this would increase their energy invested and suppress not inflate
their estimates of ERoEI. Hence this is a point that needs to be
clarified.
Environmental
impacts
The
main reason for deploying solar PV in Europe is to lower CO2
emissions. The European Commission and most European governments have
been living in cloud cuckoo land allowing CO2 intensive industries to
move to China, lowering emissions in Europe while raising emissions
in China and making believe that importing steel from China somehow
is emissions free.
The
example of solar PV brings this into sharp focus. Assuming the main
energy input is from coal (and low efficiency dirty coal at that) and
with ERoEI <1, making electricity from solar PV will actually
create higher emissions than had coal been used directly to make
electricity for consumption in the first place. But it’s a lot
worse than that. All of the emissions associated with 25 years of
electricity production are in the atmosphere now making global
warming much worse than it would otherwise have been without the PV.
And
it gets even worse than that! The manufacture of PV panels involves
lots of nasty chemicals too:
Many
potentially hazardous chemicals are used during the production of
solar modules. To be mentioned here is, for instance, nitrogen
trifluoride (NF3), (Arnold et al., 2013), a gas used for the cleaning
of the remaining silicon-containing contaminants in process chambers.
According to the IPCC (Intergovernmental Panel on Climate Change)
this gas has a global warming potential of approximately 16600 times
that of CO2. Two other similarly undesirable “greenhouse” gases
appearing are hexafluoroethane (C2F6) and sulphur hexafluoride (SF6).
And
The
average weight of a photovoltaic module is 16 kg/m2 and the weight of
the support system, inverter and the balance of the system is at
least 25 kg/m2 (Myrans, 2009), whereby the weight of concrete is not
included. Also, most chemicals used, such as acids/ bases, etchants,
elemental gases, dopants, photolithographic chemicals etc. are not
included, since quantities are small. But, we must add hydrochloric
acid (HCl): the production of the solar- grade silicon for one square
meter of panel area requires 3.5 kg of concentrated hydrochloric
acid.
Comparison
with nuclear
The
paper offers some interesting comparisons with nuclear power. Looking
first at materials used per unit of electricity produced:
PV
uses 20.2
g per kW he (mainly
steel aluminium and copper)
A
nuclear power station uses 0.31
g per kW he (mainly
steel) for a load factor of 85%
kW
he = kilowatt hours electrical
Looking
at labour, the authors observe:
The
suppliers involved in the renewable energies industry advertise their
capability to create many new jobs.
While
of course the best forms of energy use as little labour as possible.
At the point where ERoEI reaches 1, everyone is engaged in gathering
energy and society as we know it collapses!
Solar
PV creates 94.4
jobs per MW installed,
adjusted for capacity factor.
Nuclear
creates 13
jobs per MW installed
covering construction, operation and decommissioning.
This
may seem great to the politicians but it’s this inefficiency that
makes solar PV expensive and kills the ERoEI. And looking at capital
costs:
Solar
PV needs CHF 6000 per kW installed (CHF = Swiss Franc)
Nuclear
power CHF 5500 per kW installed
But normalising
for capacity factors of 9% for solar and 85% for nuclear we get for
effective capacity:
66,667
/ 6471 = 10.3
Solar
PV is 10 times more capital intensive than nuclear.
Energy
transformation
When
ERoEI approaches or goes below 1 we enter the realm of energy
transformation which is quite common in our energy system. For
example, converting coal to electricity we lose approximately 62% of
the thermal energy. Converting coal and other raw materials into a PV
panel may in certain circumstances make some sense. For example PV
and a battery system may provide African villages with some
electricity where there is little hope of ever getting a grid
connection. Likewise for a mountain cabin. Individuals concerned
about blackouts may also consider a PV battery system as a backup
contingency.
But
as a means of reducing CO2 emissions PV fails the test badly at
temperate latitudes. It simply adds cost and noise to the system. In
sunnier climates the situation will improve.
Concluding
comments
The
findings of this single study suggest that deploying solar PV at high
latitudes in countries like Germany and the UK is a total waste of
time, energy and money. All that is achieved is to raise the price of
electricity and destabilise the grid. Defenders of RE and solar will
point out that this is a single paper and there are certainly some of
the inputs to Ferroni and Hopkirk that are open to debate. But
there are reasons to believe that the findings are zeroing in on
reality. For example Prieto and Hall found ERoEI for solar PV = 2.
Looking only at cloudy, high temperate latitudes will substantially
degrade that number.
And
you just need to look at the outputs as shown below. Solar PV
produces a dribble in winter and absolutely nothing at the 18:00
peak demand. There is a large financial cost and energy cost to
compensate for this that RE enthusiasts dismiss with a wave of the
arm.
Figure
1 From UK
Grid Graphed.
The distribution of solar production in the UK has grown 7 fold in 4
years. But 7 times a dribble in winter is still a dribble. The
large amount of embodied energy in these expensive devices does no
work for us at all when we need it most.
Energy
Matters has a good search facility top right. Insert solar pv and I
was surprised to find how many articles Roger and I have written and
they all more or less reach the same conclusions. I have added these
links at the end of the post.
Figure
2 A
typical solar installation in Aberdeen where the panels are on an
east facing roof leaving the ideal south facing roof empty. This is a
symbol of ignorance and stupidity that also pervades academia. Has
anyone seen a University that does not have solar PV deployed? I’ve
heard academics argue that orientation does not matter in Scotland,
and they could be right. I dare say leaving the panels in their box
would make little difference to their output. Academics, of course,
are increasingly keen to support government policies. Note that sunny
days like this one are extremely rare in Aberdeen. And in winter
time, the sun rises about 10:00 and sets around 15:00.
Two
years ago I fulminated about the random orientation of solar panels
in Aberdeen in a post called Solar
Scotland.
And this random orientation will undoubtedly lead to serious
degradation of the ERoEI. PV enthusiasts will no doubt assume that
all solar PV panels are optimally orientated in their net energy
analysis while in the real world of Ferroni and Hopkirk, they are
not. A good remedy here would be to remove the feed in tariffs of
systems not optimally deployed while ending future solar PV feed
in tariffs all together.
But
how to get this message heard at the political level? David MacKay’s
final interview was very revealing:
The
only reason solar got on the table was democracy. The MPs wanted to
have a solar feed-in-tariff. So in spite of the civil servants
advising ministers, ‘no, we shouldn’t subsidise solar’, we
ended up having this policy. There was very successful lobbying by
the solar lobbyists as well. So now there’s this widespread belief
that solar is a wonderful thing, even though … Britain is one of
the darkest countries in the world.
If
the politicians do not now listen to the advice of one of the World’s
most famous and respected energy analysts then I guess they will not
listen to anyone. But they will with time become increasingly aware
of the consequences of leading their electorate off the net energy
cliff.
References
[1]
Ferruccio Ferroni and Robert J. Hopkirk 2016: Energy Return on Energy
Invested (ERoEI) for photovoltaic solar systems in regions of
moderate insolation: Energy Policy 94 (2016) 336–344
[2]
Murphy, D.J.R., Hall, C.A.S., 2010. Year in review-EROI or energy
return on (energy) invested. Ann. N. Y. Acad. Sci. Spec. Issue Ecol.
Econ. Rev. 1185, 102–118.
[3]
Murphy, D.J.R., Hall, C.A.S., 2011. Energy return on investment, peak
oil and the end of economic growth. Ann. N.Y. Acad. Sci. Spec. Issue
Ecol. Econ. 1219, 52–72.
[4]
Prieto, P.A., Hall, C.A.S., 2013. Spain’s Photovoltaic Revolution –
The Energy Return on Investment. By Pedro A. Prieto and Charles A.S.
Hall, Springer.
[5] IEA-PVPS
T12, Methodology Guidelines on the Life Cycle Assessment of
Photovoltaic Electricity – Report IEA-PVPS T12-03:2011.

 Posts
Posts