Showing posts with label ozone depletion. Show all posts

Sunday, 14 February 2021

Massive increase in ultra-violet radiation measured

 EXTINCTION EVENT


Dane Wigington: UV-B and UV-C radiation increases 150-200 %


Nasa Engineer Issues Deadly Ozone Layer Collapse Warning


GeoengineeringWatch,

19 November, 2017

Global climate engineering programs continue to destroy the planet’s life support systems, including the ozone layer. The former NASA aerospace avionics engineer who has been working directly with Geoengineering Watch has issued an even more dire report on the unfolding ozone layer collapse. He has continued his ongoing UV radiation monitoring efforts with state of the art UV metering equipment supplied by GeoengineeringWatch.org. Those who are most aware of their surroundings have long since taken note of the growing intensity of the sun. This change is not due to increased solar activity, rather, it is a dire symptom of Earth’s rapidly disintegrating ozone layer. Geoengineering Watch has issued previous warnings of the rapidly increasing UV radiation. Though there are many anthropogenic factors negatively impacting the life sustaining ozone layer, ongoing covert climate engineering programs are mathematically by far the most damaging. Many mainstream and “official” sources falsely claim that the southern hemisphere ozone hole is “recovering” (in order to pacify populations), however,  front-line data does not support the “ozone recovery” official narrative. Since the start of this century UV levels comparable to the surface of Mars have been recorded. The same sources of false “ozone layer recovery” data do not even mention the massive and growing northern hemisphere ozone hole.

Mainstream media (and all “official sources” of UV data) have done their best to completely hide the already extreme UV radiation dangers in the Northern Hemisphere.

The impacts of the extreme UV radiation exposure is very evident on the sun exposed side of many tree species. All life forms that are exposed to the increasingly excessive UV radiation are being affected, including whales and plankton.

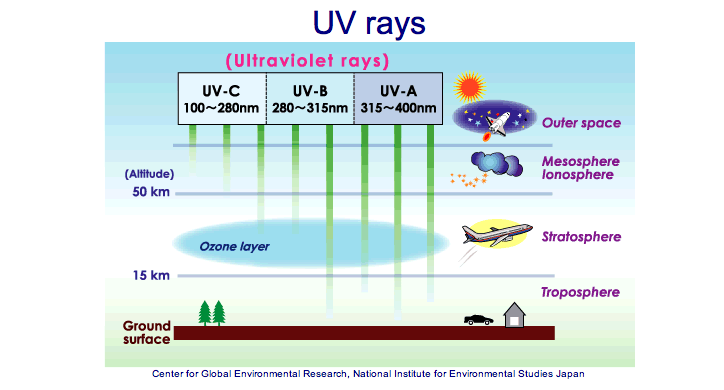
Effects of solar UV radiation on biomolecules, cellular components and physiological responses. (Diagram credit: Royal Society of Chemistry)

If the ozone layer completely collapses, all exposed life forms will collapse with it (terrestrial and aquatic). Climate engineering is decimating the ozone layer, all of Earth’s life support systems are at risk. The latest dire report below (addressing extreme UV radiation dangers) was assembled for GeoengineeringWatch.org by a retired NASA aerospace avionics engineer who is working exclusively with us. Out of concern for his safety, we must keep this individual anonymous at this time.

UVC Radiation Today And The End Of All Life

An Ominous title.  Selected for exactly that reason – to wake you up – denial of this fact will soon be gone as the food supplies vanish – famine, starvation, sickness, disease, hey, it’s here now.

Too late for many species already, and we’re losing an average of 200 more every day.

The author has studied the Upper Ozone Layer in detail since 1994, while involved in a High Altitude Atmospheric Research project at the NASA/Ames Dryden Flight Research Center at Edwards AFB.

Initially, the research seemed trivial, why would anyone spend so much money, to go so high, just to get numbers from atmospheric sensors?  Many scientists in this program were asked this very question, and the consensus among scientists was that ‘something was going wrong with the Upper Ozone Layer – and we intend to find out why’.

If you do an internet search on UVC radiation and try to find credible information from a well-known University or other “official source” – be prepared to discover disinformation, like: “UVC radiation never reaches the earth surface”.  So, finding maximum radiation dosages in direct sunlight is difficult – and when you do find someone with UVA/B/C measurements – what do those numbers really mean?

It’s difficult to understand the authenticity of this information – how do you know the info is correct?  Simply put, you don’t.

The National Institute of Standards and Technology tries to be helpful here, they have established methods and reference standards that provide comparison and correlation of various manufactured sensors and meters – so that the data gathered from those meters has a ‘traceable’ and verifiable meaning.

Start out at NASA GSFC, short for Goddard Space Flight Center, and look up Ozone.  This is one place to investigate, but remember, this is a government website, so the information has been ‘tailored’ for the public.

GSFC did one, very good thing – they linked UVC radiation to DNA/RNA damage, and suggested that ‘a 1% change in the Upper Ozone Layer gives a 2% change on the earth surface’.  Think about that.  What it should say is: “whatever change happens to the Upper Ozone Layer – the effects are TWICE the amount on the earth surface”.  You must pay close attention to scientists – their degree was not in English, or Communication – understanding the full meaning of what’s being said can be difficult at best.

So, next you want to find data that shows how much harmful UVC radiation is at the earth’s surface – but the search comes up empty – the only info you can find is from individuals with hand-held meters, and no actual data other than the readings displayed on the meter.  Try to find earth surface UVC data – IT DOESN’T EXIST – except at 1 website:  http://www.geoengineeringwatch.org/


Thanks to GeoengineeringWatch.org and Dane Wigington.

The charts presented are from the ILT950UV Spectral Radiometer, and has traceable calibration to the National Institute of Standards and Technology (NIST).  The data gathered by the ILT950UV and presented in surface chart form is untouched by any software programs other than the Microsoft Excel Surface Chart.  An average of 90,000 data points are displayed on each of these charts to give a visual understanding of harmful UV radiation from 250 to 300 nanometers.  The emphasis for the chart is multifold – the colors have been selected to mean that when you are in the YELLOW, you are being radiated with 0.9 to 1.0 uW/cm^2 of energy.  The other colors in the spectrum on the chart illustrate even more extreme UV radiation exposure dangers.

Click image to enlarge

Maximum radiation dosage levels are referenced to time, the time factor for this chart is Per Hour.  The maximum recommended exposure level of UVC @ 270 nm.  This chart shows YELLOW from 0.8uW/cm^2 to 0.9uW/cm^2 – NOTING that if exposed to this level for even 1 hour you have exceeded the maximum recommended level of exposure.  The maximum exposure levels were established to mean that if exceeded, irreversible damage to DNA/RNA and tissue has occurred on unprotected skin and eyes. The additional graph color spectrum reveals even more extreme UV exposure dangers.

Why is this important?

No standards have been set for solar radiation exposure levels in this UV spectrum – they don’t exist because all agencies involved with solar radiation levels claim “Solar UVC radiation never reaches the earth surface”.  This statement is a blatant and dangerous lie.

Reference UVC radiation levels have been established, not for Solar radiation, but for man-made UVC sources intended for DNA/RNA gene splicing, research, and other applications.  The Maximum UVC radiation (specifically 270 nanometer) level is to NOT EXCEED 0.1uW/cm^2 for 8 hours.  That’s 1 billionth of a Watt over a square centimeter for an 8 hour period.

It is important because our DNA/RNA has a harmonic resonance to 270 nanometers, and radiation from the sun at this frequency will TEAR APART the physical strands.   All life-form DNA/RNA exhibit this same reaction, with humans, the sensitivity to this frequency is 9,000 times greater than any other frequency in the solar spectrum.  So, we already have more than a ten-fold UVC level over the maximum dosage rate!

The function and design of the ILT950UV Spectral Radiometer was researched at great length prior to purchase, with a Radiometer sent from the factory and tested at Mt. Hamilton Observatory in 2016.  The data gathered was analyzed and found to be accurate, and of major concern – UVC levels of 1.7uW/cm^2 were measured.  Do the math, the maximum dosage level per hour is 0.8uW/cm^2/hour (0.1uW/cm^2 times 8 hours), so, 1.7uW/cm^2 * 8 = 13.6uW/cm^2/hour, or, 17 TIMES the maximum dosage level.

This author has confronted a major scientist with the NASA “SORCE” program, and the subject of 270 nanometer radiation levels measured at earth surface were discussed – that scientist responded by saying “your data is a result of stray light, UVC radiation is attenuated completely by the Upper Ozone Layer and the atmosphere”. This scientist denied the data presented through emails, and all phone and internet communication was terminated with the author.

Again, denial.

Ok, fine. Go outside, and feel the sun on your skin. Does it feel hotter than normal? It is. If you can deny this, then there is no method available to teach you otherwise – your perception of reality is wrong.

Scientists always want to quantify things – and this is ok,  for the most part, but don’t get so involved with the measurements and data that you lose perspective on that is going on around you:  The Great Barrier Reef is almost completely dead, mass die-offs of whale, dolphin, seal, bird and plant, insect, and yup, algae, and plankton, the cornerstones of our food supply – HEY these things are vanishing NOW!!!  How about those scientists having something to do with a solution, like, first of all STOP ALL GEOENGINEERING!

This engineer is dedicated to the preservation of all life on planet earth. UVC data charts will be provided for as long as humanly possible – in color you know and understand – YELLOW is WARNING, RED is DANGER – everything above RED, well, it won’t matter for long, because neither you nor I will be here.

My sincere thanks go to Dane Wigington, and all those who support him with the efforts of GEOENGINEERINGWATCH.org

(Former NASA avionics aerospace engineer)

So many in academia have chosen their paychecks and pensions over their sense of morality, virtue, and honor. There is an epidemic of moral bankruptcy and willful blindness as so many “experts” in the environmental and human health sciences “look the other way” so to speak. If there were only a few more with the fortitude and courage this former NASA engineer has shown, the horizon would perhaps not be nearly so dark as it is. I wish to express my deepest gratitude to him and am very grateful for his ongoing efforts. Each and every one of us that is already awake and aware must forge forward in the battle to reach a critical mass of public awareness regarding the climate engineering crimes. If and when we can accomplish this, we would provide those in academia enough support so that they may yet find their courage and join the effort to sound the alarm. We must all take action today, tomorrow will be too late.
DW

May be freely reprinted, so long as the text is unaltered, all hyperlinks are left intact, and credit for the article is prominently given to GeoengineeringWatch.org and the article’s author with a hyperlink back to the original story.


Saturday, 24 October 2020

Largest and Deepest Ozone Hole in Antarctica in Years

It seems to be just a few months ago that they were crowing about how the hole in the Antarctic ozone hole was 'healing' and at its smallest size.  Now, you cannot even find those items in the search engines!

Reports like this to me reveal just how bad the situation must be and is being hidden. 

Dane Wigington is amongst the very few that says the situation is getting worse - much worse - and I believe him.


https://www.geoengineeringwatch.org/category/geoengineering/results-of/ozone/

 Antarctica Wakes Up to Largest and Deepest Ozone Hole in Years


Sputnik

23 October, 2020


Both small and short-lived ozone holes, as well as bigger ones are known to be driven by very special meteorological conditions: cold stratosphere temperatures have been found to be behind astonishing increases in their size, whereas warming typically causes them to shrink.

A hole in the ozone layer over Antarctica occurs regularly, but now it has expanded to one of its biggest recorded sizes over the past few years, scientists report, as cited by Science Alert.


Fresh estimates from the European Space Agency's Copernicus Sentinel-5P satellite show that the ozone hole reached a maximum size of roughly 25 million square kilometres on 2 October, thereby outpacing the measurements of 2018 and 2015's ozone holes - 22.9 and 25.6 million square kilometres respectively.

Yet, 2020’s maximum peak isn't the largest on record. That title belongs to the 29.9-million square kilometre hole registered back in 2000, however, this year’s hole is still one of the deepest in recent years.

Atmospheric scientist Vincent-Henri Peuch from the European Centre for Medium-Range Weather Forecasts admits there is a certain variability in the development of such holes from year to year, noting that while it resembles the one from 2018, it “is definitely in the upper part of the pack of the last 15 years or so”.

Researchers say the 2020 event has been caused by a strong polar vortex, which is a wind phenomenon that keeps stratospheric temperatures above Antarctica cold, causing the hole to grow. Warmer temperatures in Antarctica last year, by contrast, helped bring about a record-low ozone hole size, as scientists explained at the time.

"It's important to recognise that what we're seeing [in 2019] is due to warmer stratospheric temperatures”, Paul Newman, the chief scientist for Earth Sciences at NASA's Goddard Space Flight Centre in Greenbelt, Maryland, noted about the shrinking ozone hole last year.

As an ozone hole over Antarctica either shrinks or grows as time passes, gas concentrations inside the hole fall when temperatures in the stratosphere go down. When this happens - specifically, when polar stratosphere clouds form at temperatures below –78°C (–108.4°F), chemical reactions ruin ozone molecules when solar radiation takes hold.

"With the sunlight returning to the South Pole in the last weeks, we saw continued ozone depletion over the area”, Peuch noted, further drawing parallels between the 2019 and this year’s events.

"After the unusually small and short-lived ozone hole in 2019, which was driven by special meteorological conditions, we are registering a rather large one again this year, which confirms that we need to continue enforcing the Montreal Protocol banning emissions of ozone depleting chemicals”.

The Montreal Protocol was a key achievement in recent international environmental activity, as it aims to phase out the manufacturing of harmful chlorofluorocarbons (CFCs) – chemicals previously used in refrigerators, packaging, and sprays – that destroy ozone molecules in sunlight and fuel harmful depletion of the ozone layer which serves as a shield against deadly ultraviolet radiation.


https://www.sciencealert.com/the-ozone-hole-over-antarctica-has-grown-to-one-of-its-largest-sizes-in-recent-times

Sunday, 29 March 2020

Large hole in ozone layer in Arctic


Rare ozone hole opens over 
Arctic — and it’s big

Cold temperatures and a strong polar vortex allowed 
chemicals to gnaw away at the protective ozone layer in 
the north.


27 March, 2020
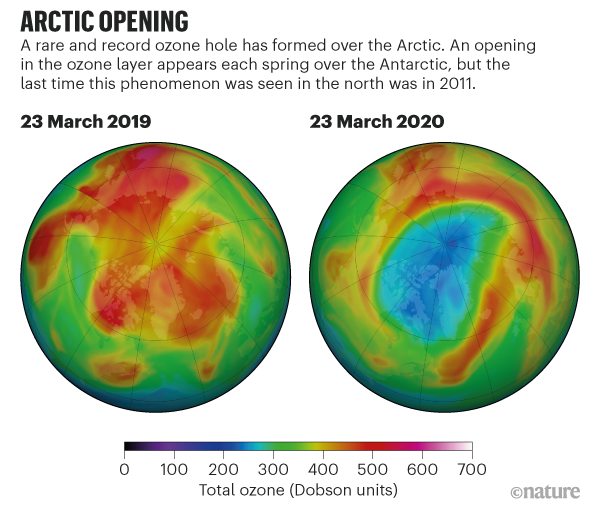
A vast ozone hole — likely the biggest on record in the north — has opened in the skies above the Arctic. It rivals the better-known Antarctic ozone hole that forms in the southern hemisphere each year.
Record-low ozone levels currently stretch across much of the central Arctic, covering an area about three times the size of Greenland (see ‘Arctic opening’). The hole doesn’t threaten people’s health, and will probably break apart in the coming weeks. But it is an extraordinary atmospheric phenomenon that will go down in the record books.
“From my point of view, this is the first time you can speak about a real ozone hole in the Arctic,” says Martin Dameris, an atmospheric scientist at the German Aerospace Center in Oberpfaffenhofen.


Source: NASA Ozone Watch

The hole’s formation

Ozone normally forms a protective blanket in the stratosphere, about 10 to 50 kilometres above the ground, where it shields life from solar ultraviolet radiation. But each year in the Antarctic winter, frigid temperatures allow high-altitude clouds to coalesce above the South Pole. Chemicals, including chlorine and bromine, which come from refrigerants and other industrial sources, trigger reactions on the surfaces of those clouds that chew away at the ozone layer.
The Antarctic ozone hole forms every year because winter temperatures in the area routinely plummet, allowing the high-altitude clouds to form. These conditions are much rarer in the Arctic, which has more variable temperatures and isn’t usually primed for ozone depletion, says Jens-Uwe Grooß, an atmospheric scientist at the Juelich Research Centre in Germany.
But this year, powerful westerly winds flowed around the North Pole and trapped cold air within a ‘polar vortex’. There was more cold air above the Arctic than in any winter recorded since 1979, says Markus Rex, an atmospheric scientist at the Alfred Wegener Institute in Potsdam, Germany. In the chilly temperatures, the high-altitude clouds formed, and the ozone-destroying reactions began.
Researchers measure ozone levels by releasing weather balloons from observing stations around the Arctic (including the Polarstern icebreaker, which is frozen in sea ice for a year-long expedition). By late March, these balloons measured a 90% drop in ozone at an altitude of 18 kilometres, which is right in the heart of the ozone layer. Where the balloons would normally measure around 3.5 parts per million of ozone, they recorded only around 0.3 parts per million, says Rex. “That beats any ozone loss we have seen in the past,” he notes.
The Arctic experienced ozone depletion in 1997 and in 20111, but this year’s loss looks on track to surpass those. “We have at least as much loss as in 2011, and there are some indications that it might be more than 2011,” says Gloria Manney, an atmospheric scientist at NorthWest Research Associates in Socorro, New Mexico. She works with a NASA satellite instrument that measures chlorine in the atmosphere, and says there is still quite a bit of chlorine available to deplete ozone in the coming days.

Is it dangerous?

Things would have been much worse this year if nations had not come together in 1987 to pass the Montreal Protocol, the international treaty that phases out the use of ozone-depleting chemicals, says Paul Newman, an atmospheric scientist at NASA’s Goddard Space Flight Center in Greenbelt, Maryland. The Antarctic ozone hole is now on its way to recovery — last year’s hole was the smallest on record — but it will take decades for the chemicals to completely disappear from the atmosphere.
The Arctic ozone hole isn’t a health threat because the Sun is just starting to rise above the horizon in high latitudes, says Rex. In the coming weeks, there is a small chance the hole might drift to lower latitudes over more populated areas — in which case people might need to apply sunscreen to avoid sunburn. “It wouldn’t be difficult to deal with,” Rex says.
The next few weeks are crucial. With the Sun slowly getting higher, atmospheric temperatures in the region of the ozone hole have already started to increase, says Antje Inness, an atmospheric scientist with the European Centre for Medium-Range Weather Forecasts in Reading, UK. Ozone could soon start to recover as the polar vortex breaks apart in the coming weeks.
“Right now, we’re just eagerly watching what happens,” says Ross Salawitch, an atmospheric scientist at the University of Maryland in College Park. “The game is not totally over.”

Not so cold in the Arctic right now


Thursday, 12 September 2019

A rapid decrease in the Antarctic ozone hole. Really


Revisiting ozone depletion in Antarctica and the Tropics

A couple of days ago CAMS published an article in which they point to a very unusual ozone hole, one which they claim points to a reduction in the size of the ozone layer.


Is this credible despite the scientific consensus?

Meanwhile the high levels of ozone in the tropics as well as very high measurements of ultra-violet radiation is under-reported or ignored.

Here is my report:


CAMS monitors a very unusual 2019 ozone hole


This is an excellent report from Margo who has been monitoring this - 

Looking at Ozone - (June 24, 2018)

Part one:


Part two: 


Record levels of solar ultraviolet measured in South America


Ozone layer not recovering over populated areas, scientists warn


The Ozone Layer Recovery Lie And Climate Engineering Denial, Both Are Breaking Down


Record Shattering UV Radiation Levels Finally Confirmed


Record levels of solar ultraviolet measured in South America


Declining Humidity Is Defying Global Warming Models


Ozone Depletion, Global Warming & Geoengineering: Prof David Karoly (December 2015)


Ozone NOT Protected Scientists Say


Friday, 6 September 2019

Geoengineering and Ozone Depletion


I wish to acknowledge my gratitude to Margo of Margo's Healing Corner.  She has been tirelessly monitoring the situation with global ozone for about a year and is the source of my understanding on this.

If the ozone hole is “healing” 


why are levels in Antarctica 

so low?


Copernicus - Ozone forecast


Geoengineering is Destroying the Ozone Layer


This is an previous item I have done

Is the Ozone Layer Collapsing?


Ozone Layer Collapse, A Former NASA Contract Engineer Warns Of Planetary Omnicide ( Dane Wigington )


From Wikipedia - Ozone depletion


Disturbing losses of protective ozone near Earth’s equator may be tied to short-lived chemicals


The ozone layer is thinning in places around the equator


Remember the Ozone Hole? Now There's Proof It's Healing.


Scientists find evidence that the hole is finally shrinking, thanks to the phasing out of harmful chemicals 30 years ago.


Ozone Hole Shrinks to Record Low


https://www.livescience.com/27049-ozone-hole-shrinks-record-low.html?fbclid=IwAR0_oHyILhnyfCCvyqTMW9LQto6btJC8JzRqWQfR6_vkUN2SOS8qEXHK41o

This BBC item refers to fraud in the reporting of greenhouse gasses (rather than CFC's) that are used in refrigeration.

'Dodgy' greenhouse gas data threatens Paris accord

mountain


This young chap gives a pretty good overview
Geoengineering and Ozone Depletion


Ozone Depletion, Global Warming & Geoengineering: Prof David Karoly (December, 2015)