Pacific
Ocean monitoring stations around the world are now calling for a
50-67 percent chance of El Nino later
this year. A warming of the Eastern Pacific that, should it emerge,
is likely to result in record atmospheric and ocean temperatures as
the human greenhouse gas heat forcing emerges, once more, from the
oceans. But, so far, the Eastern Pacific remains in a somewhat cool
ENSO-neutral state. It is a trend that should lead to global
atmospheric temperature averages somewhat hotter than the ocean
surface. A trend that should not show ocean temperatures spiking,
with atmospheric values rising at a slower rate.
But
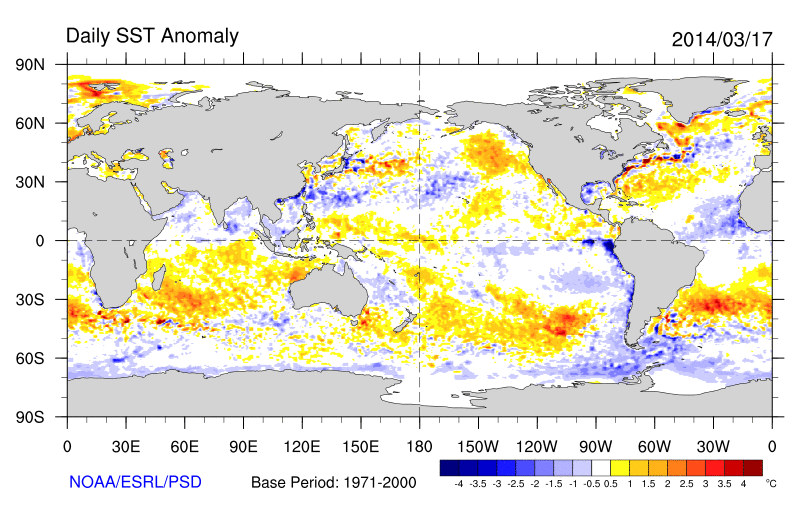
over the past week, according to both GFS model assessments and NOAA
observational data, average global ocean surface temperatures have
been surging.
(Sea
surface temperature anomaly from the already warmer than normal 1971
to 2000 base period. Image source: NOAA.)
Large
zones of well above average sea surface temperature now cover vast
regions of the global ocean system so that anomalous heat now is
plainly the dominant feature. Pools of hotter than typical water
where averages range from 1 to 4 C above normal now appear off both
coasts of South America, through the Indian Ocean between Africa and
Australia, off the East Coast of the United States, south of Alaska
and in a zone stretching from Norway to Svalbard. By contrast only
small cool zones remain in the Eastern Pacific, in the passage
between South America and Antarctica, in a swatch of the Tropical
Atlantic near Africa, and in isolated regions of the Central and
Western Pacific.
Arctic
Warmth Drives Temperatures Higher
But
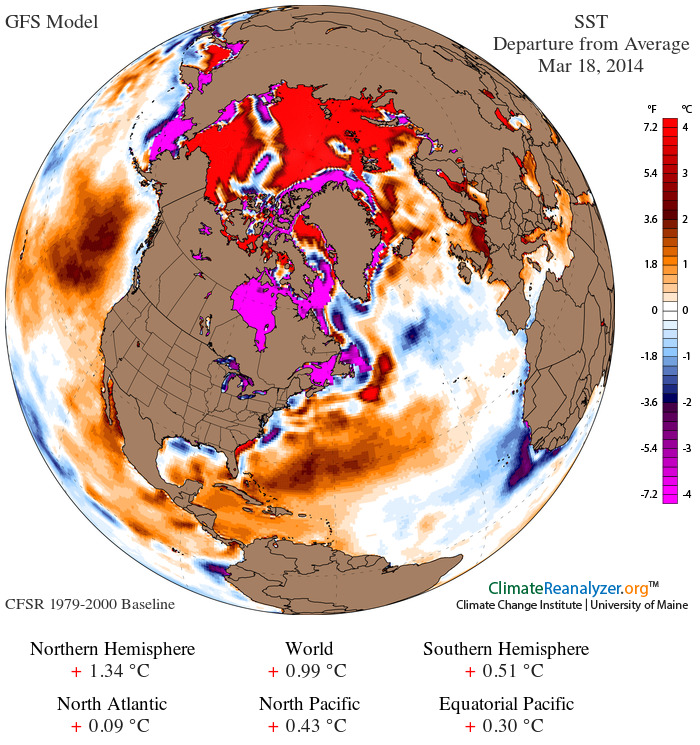
the zone of hottest temperatures appear, according to GFS model data
below, in the Arctic, where much of the surface waters and ice sheet
are warmer than average by 4 C or more. This heat bleed from the
Arctic Ocean tips Northern Hemisphere values far above average and is
a primary contributor to Arctic atmospheric temperatures in the range
of 3-4 C above average (1979-2000) for mid to late March.
During
the past few days, the effect of this warm surface was enough to
drive temperature anomalies for the oceans higher than .9 degrees
Celsius above the 1979 to 2000 global average according to GFS
observational data. Understanding that the 1979 to 2000 global sea
surface temperature (SST) average was already about .28 C above the
1880s average,we
are now seeing SST daily values in excess of 1.18 C above 1880s
averages before El Nino comes into play.
(Sea
surface temperature anomaly for March 18, 2014 vs the, already warmer
than normal, 1979-2000 average. Image source: University
of Maine.)
Even
more impressive are the sea surface temperature values seen during
the past two days (March 17-18) — hitting a .99 C positive anomaly
or +1.27 C above 1880s values.
For
comparison, the global sea surface temperature average for 2013,
according to the National
Climate Data Center,
was .42 degrees Celsius above the 1880s average and the hottest year
for ocean surface temperatures, 2003, was .52 degrees Celsius hotter
than the 1880s average. The average for the past two days, should the
GFS observation stand, is +.75 above the highest annual average on
record.
Daily
values for even the entire ocean system can show rather large swings,
but this high temperature trend is somewhat new and has been ongoing
now for about a week.
Oceans
dumping heat into the atmosphere without El Nino
By
contrast, global atmospheric temperatures within the first two
meters, according to the same GFS data, are, on March 18, .69 C above
the 1979-2000 average. It is a reading .3 C below current sea surface
temperature values. Yet it is also a reading about 1 C over 1880s
values and about .3 C above annual global high temperature records
set in 2010.
With
ocean surface temperatures higher than 2 meter air temperatures, it
appears the ocean is now dumping some of its latent heat back into
the atmosphere through radiative transfer. This is a situation
opposite of what has been observed for much of the past 13-14 years
running when Pacific Decadal Oscillation (PDO) went negative and the
oceans underwent rapid warming as they sucked up atmospheric heat.
What
we now observe in the preliminary GFS data is evidence that the ocean
is dumping a bit of this stored and massive volume of heat back into
the atmosphere. And we are seeing significant positive oceanic and
atmospheric heat forcing well before any major level of Eastern
Pacific Ocean warming and associated El Nino have come into play.
Last
week, Gulf of Mexico sea surface temperatures off Tampa Bay were
outrageously hot. On July 10, the ocean temperature measure hit 93
degrees Fahrenheit (34 Celsius). By the 11th, temperatures had warmed
still more. And by the 12th, ocean surfaces had hit a sweltering 95 F
(35 C).
(NOAA shows
extreme sea surface temperatures at Old Port in Tampa, FL. Hat tip
toMichael
Lowry.)
It’s
rare that you ever see ocean waters anywhere on Earth become so hot.
And when you do, it’s often in places like the Red Sea or the
Persian Gulf — not the Gulf of Mexico. But in the new world driven
to increasingly extreme warmth by human fossil fuel emissions, the
potential heat bleeding off of ocean surfaces has jumped by quite a
bit.
And
it’s not just true with Tampa Bay. According
to Michael Lowry,
a hurricane specialist at The Weather Channel, the whole of the Gulf
of Mexico recorded its hottest average daily July sea surface
temperature at 86.3 F (30.1 C).
Atlantic
Basin Sees Record July Heat
The
record ocean heat extends still further. National
Hurricane Center storm
specialist Eric
Blake earlier
today noted that the entire Atlantic Basin west of longitude 60° W
is the hottest it’s ever been during any hurricane season,
including the record storm year that was 2005. In other words, a huge
zone of ocean stretching from the far eastern edge of the Caribbean,
encompassing all of the Gulf of Mexico and running up the entire
eastern seaboard of the US and on to just east of Bermuda is now
seeing the hottest July ocean temperatures ever experienced in our
modern records.
(Sea
surface temperatures hit record ranges for the western North Atlantic
during recent days. CDAS image via Eric
Blake.)
Overall
ocean surface temperatures range from 0.5 to 1 C above average for
the Caribbean, 0.5 to 2.5 C above average for the Gulf of Mexico and
1 to 6 C above average for the coastal US Atlantic. These
temperatures compare to an already hotter-than-normal 1981-to-2010
average, so departures from the 20th-century average would be even
greater.
Record
Ocean Heat to Strengthen 2016 Atlantic Hurricanes?
Hot
ocean temperatures are fuel for the powerful storms we call
hurricanes. But it’s not the only ingredient. Low-pressure
formation at the surface, a lift in the atmosphere, high pressure
aloft, widely available moisture, and a lack of wind shear are all
atmospheric assists that aid in storm formation. So far during July,
a dearth of these other factors has resulted in no storms as of yet
for the month.
2016,
however, has already seen four named tropical storms —
including the odd winter Hurricane Alex and three tropical storms
which spun up during June. And given the extreme ocean surface heat
in the Northwestern Atlantic, some agencies are beginning to call for
the potential for more and possibly powerful storms on the way.
The
main driving elements for hurricane formation in the Atlantic are the
SST values present in the Atlantic itself, the predicted wind shear
conditions in the region, and the SST pattern found in the Pacific
related to the timing of the transition from El Niño to La Niña in
the equatorial Pacific Ocean. Model predictions anticipate that the
second part of this 2016 season will be more active as La Niña
intensifies in the Pacific and becomes one of the main drivers of
activity for the Atlantic.
As
a result of the combined extreme Atlantic Basin heat and the
predicted emergence of La Niña conditions in the equatorial
Pacific, some
hurricane monitors are upping the number of storms predicted for
2016.
Colorado State is now forecasting 15 named storms as opposed to its
earlier 13. However, its prediction for the number of major
hurricanes has remained the same at two, with one affecting the US.
(Models
predict what appears to be a very healthy tropical wave emerging off
the west coast of Africa by July 28. If a tropical cyclone results
that tracks into record warm western Atlantic waters, peak storm
intensity near the US could be quite extreme. Hat tip tometeorologist
Ryan Maue for
the ECMWF infrared
forecast capture.)
However,
predicted warm-water formation in the Pacific off Mexico could dampen
Atlantic storms by pushing in more dry air and developing a higher
degree of wind shear than is typical during a La Niña year. In
addition, large African dust flows currently over the tropical
Atlantic also may tend to suppress storm formation.
Given
the ambiguous conditions noted above, the situation still appears to
be a bit of a crapshoot. That said, those extreme sea surface
temperatures near the US will likely continue to ramp up through
August. And that’s a situation that creates a potential where
storms approaching the US rapidly intensify as they hit those
record-hot waters. Overall, it’s a pretty dicey environment for
forecasters and one that has been wagged in no small amount by
conditions related to human-forced warming.
Sea surface temperatures were
as high as 15.8°C or 60.4°F near Svalbard on November 7, 2015, a
13.7°C or 24.7°F anomaly. Let this sink in for a moment. The water
used to be close to freezing point near Svalbard around this time of
year, and the water now is warmer by as much as 13.7°C or
24.7°F.
Above
image further shows that sea surface temperature anomalies as high
as 6.7°C or 12.1°F were recorded on November 7, 2015, off the
coast of North America, while anomalies as high as 6°C or 10.9°F
were recorded in the Bering Strait. NOAA
analysis shows
that the global sea surface in September 2015 was the warmest on
record, at 0.81°C (1.46°F) above the 20th century average of
16.2°C (61.1°F). On the Northern Hemisphere, the anomaly was
1.07°C (1.93°F).
How
did temperatures get so high near Svalbard? The answer is that ocean
currents are moving warm water from the Atlantic Ocean into the
Arctic Ocean. The ocean is warmer underneath the sea surface and at
that location near Svalbard warm water from below the surface
emerges at the surface. Ocean
Heat The
oceans are warming up rapidly, especially the waters below the sea
surface. Of all the excess heat resulting from people's
emissions, 93.4%
goes into oceans.
Accordingly, the temperature of oceans has risen substantially over
the years and - without action - the situation only looks set to get
worse.
NOAA's
ocean heat content figures for 0-2000 m are very worrying, as
illustrated by the image below.
The
image below was created with data for January through to March,
while adding non-linear trendlines for ocean heat at depths of 0-700
m and 0-2000 m.
While
growth of ocean heat content for 0-700 m appear to follow a
polynomial trend, growth of ocean heat content for 0-2000 m appears
to be rising even more strongly, following an exponential
trend.
The danger is that, as ocean heat continues to grow,
ocean currents will keep carrying ever warmer water from the
Atlantic and Pacific Oceans into the Arctic Ocean.
Merely
watching temperatures at the surface of the ocean may underestimate
the warming that is taking place below the sea surface. At the sea
surface, evaporation takes place that cools the water. Furthermore,
melting of sea ice and glaciers will make that a layer of cold
freshwater spreads at the surface, preventing much transfer of heat
from the ocean to the atmosphere, as discussed at this
earlier post.
The blue-colored areas on the Northern Hemisphere on the top image
are partly the result of this meltwater. There is another reason why
these areas are relatively cool, i.e. sulfates, as further discussed
in the section below. Sulfate
Particulates,
in particular sulfate, can provide short-term cooling of the sea
surface. Large amounts of sulfate are emitted from industrial areas
in the east of North America and in East Asia. On the Northern
Hemisphere, the Coriolis
effect makes
that such emissions will typically reach areas over the nearby ocean
to the east of such industrial areas, resulting in the sea surface
there being cooled substantially, until the particulates have fallen
out of the sky. Since the sulfate is emitted on an ongoing basis,
the cooling effect continues without much interruption.
This
sulfate has a cooling effect on areas of the sea surface where ocean
currents are moving warm water toward the Arctic Ocean. Because the
sea surface gets colder, there is less evaporation, and thus less
heat transfer from the ocean to the atmosphere during the time it
takes for the water to reach the Arctic Ocean. As a result, water
below the sea surface remains warmer as it moves toward the Arctic
Ocean. TheThreat
Ocean
heat will increasingly threaten to reach the seafloor and unleash
huge methane eruptions from destabilizing clathrates. Such large
methane eruptions will then warm the atmosphere at first in hotspots
over the Arctic and eventually around the globe, while also causing
huge temperature swings and extreme weather events, contributing to
increasing depletion of fresh water and food supply, as further
illustrated by the image below, from an earlier
post.
Climate
Plan
The
situation is dire and calls for comprehensive and effective action,
as discussed at the Climate
Plan.
Arctic
sea ice extent and especially concentration are now growing rapidly,
as illustrated by the Naval Research Lab animation on the
right.
This means that the sea ice is effectively sealing off
the water of the Arctic Ocean from the atmosphere, reducing the
chances of transfer of ocean heat from the water to the atmosphere.
Conversely, the risk grows that ocean heat will reach the
seafloor.
Furthermore, this seal makes that less
moisture evaporates from the water, which together with the change
of seasons results in lower hydroxyl levels at the higher latitudes
of the Northern Hemisphere, in turn resulting in less methane being
broken down in the atmosphere over the Arctic.
Rising
Ocean Heat
Water
temperatures are very high in the Arctic. Above image shows Arctic
sea surface temperature anomalies as at September 24, 2015. The risk
of ocean heat reaching the Arctic Ocean seafloor has increased
significantly over the years, due to rising ocean heat, as
illustrated by the graph below, showing August sea surface
temperature anomalies on the Northern Hemisphere over the years.
Ocean
heat is increasing because people's emissions are making the planet
warmer and more
than 93% of
the extra heat goes into the oceans.
Ocean temperatures
have been measured for a long time. Reliable records go back to at
least 1880. Ever since records began, the oceans were colder than
they are now. Back in history, there may have been higher
temperature peaks - the last time when it was warmer than today,
during the Eemian Period, peak temperature was a few tenths of a
degree higher than today. In many ways, however, the situation now
already looks worse than it was in the Eemian. "The warm
Atlantic surface current was weaker in the high latitude during the
Eemian than today", says
Henning Bauch.
Furthermore, carbon dioxide levels during the Eemian were well under
300 ppm. So, there could well have been more pronounced seasonal
differences then, i.e. colder winters that made that the average
ocean temperature didn't rise very much, despite high air
temperature in summer. By contrast, today's high greenhouse levels
make Earth look set for a strong ocean temperature rise.
And
indeed, this is illustrated by above image, showing a polynomial
trendline that points at a rise of almost 2°C by 2030. This
trendline is contained in ocean temperature data from 1880 for the
August Northern Hemisphere sea surface temperature anomalies. Cold
Freshwater 'Lid' on North Atlantic
Note
that the above graph only shows sea surface temperatures. Underneath
the surface, water can be even warmer. The Gulf Stream reaches its
maximum temperatures off the North American coast in July. It can
take almost four months for this heat to travel along the Gulf Coast
and reach the Arctic Ocean, i.e. water warmed up off Florida in July
may only reach waters beyond Svalbard by October or November.
The
image below shows that on August 22, 2015, at a location near
Florida marked by the green circle, sea surface temperatures were as
high as 33.4°C (92.1°F), an anomaly of 3.8°C (6.8°F).
The
image below shows sea surface temperatures on August 22, 2015, as an
indication of the huge amount of ocean heat has accumulated in the
Atlantic Ocean off the coast of North America.
The
huge amounts of energy entering the oceans translate into higher
temperatures of the water and of the air over the water, as well as
higher waves and stronger winds.
Ocean
heat carried by the Gulf Stream from Florida via the North
Atlantic into the Arctic Ocean.
The
image on the right shows that on August 25, 2015, sea surface
temperatures near Svalbard were recorded as high as 17.3°C
(63.1°F), as marked by the green circle, a 12.1°C (21.8°F)
anomaly.
This indicates that ocean heat did reach that
location from underneath the sea surface. In other words, subsurface
temperatures of the water carried along by the Gulf Stream can be
substantially higher than temperatures of the water at the surface,
and this can be the case for the water all the way from the coast of
North America to the Arctic Ocean.
The Gulf Stream keeps
pushing much of this very warm water north, into the Arctic Ocean,
where it threatens to unleash huge methane eruptions from the Arctic
Ocean seafloor.
What
is making the situation worse is depicted in the images below. From
2012, huge amounts of freshwater have run off Greenland, with the
accumulated freshwater now covering a huge part of the North
Atlantic, as illustrated by the image below.
Since
it's freshwater that is now covering a large part of the surface of
the North Atlantic, it will not easily sink in the very salty water
that was already there. The water in the North Atlantic was very
salty due to the high evaporation, which was in turn due to high
temperatures and strong winds and currents. As said, freshwater
tends to stay on top of more salty water, even though the
temperature of the freshwater is low, which makes this water more
dense. The result of this stratification is less evaporation in the
North Atlantic, and less transfer of ocean heat to the atmosphere,
and thus lower air temperatures than would have been the case
without this colder surface water.
There
have been suggestions that, as meltwater cools the surface of the
North Atlantic, this will slow down the Gulf Stream. However, the
amount of extra heat that enters the oceans keeps growing and this
will keep warming the waters carried by the Gulf Stream underneath
the surface of the North Atlantic into the Arctic Ocean. As global
warming continues to heat up the oceans, this freshwater at the
surface makes that less of this ocean heat can be transferred from
the water to the atmosphere in the North Atlantic, since the
freshwater is acting like a lid. Similarly, the Arctic sea ice is
acting as a seal over the Arctic Ocean, as seasons change. In
conclusion, the highest temperatures of the water of the Arctic
Ocean, especially at greater depth, are yet to be reached this year.
Above
image illustrates that, while Arctic sea water at the surface
reaches its highest temperatures in the months from July to
September, water at greater depth reaches its highest temperatures
only in October through to the subsequent months.
Methane
Eruptions from Arctic Ocean Seafloor In the Arctic Ocean,
this more salty newly-arriving warm water will tend to dive under
the freshwater that has formed from the melting of sea ice over the
past few months. The danger is thus that warmer water will be pushed
into the Arctic Ocean at lower depth, and that it will reach the
seafloor of the Arctic Ocean.
Huge
amounts of methane are contained in sediments on the Arctic Ocean
seafloor. Ice acts like a glue, holding these sediments together and
preventing destabilization of methane hydrates.
Warmer
water reaching these sediments can penetrate them by traveling down
cracks and fractures in the sediments, and reach the hydrates. The
image on the right, from a study
by Hovland et al.,
shows that hydrates can exist at the end of conduits in the
sediment, formed when methane did escape from such hydrates in the
past. Heat can travel down such conduits relatively fast, warming up
the hydrates and destabilizing them in the process, which can result
in huge abrupt releases of methane.
Heat can penetrate cracks
and conduits in the seafloor, destabilizing methane held in hydrates
and in the form of free gas in the sediments.
Elsewhere,
methane hydrates will typically be located at great depth, making it
more difficult for ocean heat to reach them. In the Arctic, much of
the water is very shallow. The East Siberian Arctic Shelf (ESAS) is
on average only 50 m deep, making it easier for heat to reach the
seafloor and also making that methane that escapes will have to
travel through less water, reducing the chances that methane will be
broken down by microbes on the way up through the water.
Furthermore, hydroxyl levels are very low over the Arctic, making
that the methane will not quickly be broken down in the atmosphere
over the Arctic either.
The
big melt in Greenland and the Arctic in general is causing further
problems. Isostatic adjustment following melting can contribute to
seismic events such as earthquakes, shockwaves and landslides that
can destabilize methane hydrates contained in sediments on the
Arctic Ocean seafloor.
Above
image shows methane levels as high as 2554 parts per billion, on the
morning of September 23, 2015, in the bottom panel, and strong
methane releases over the ESAS, as indicated by the solid
magenta-colored areas in the top panel, on the afternoon of the
previous day at lower altitude. These are indications of methane
releases from the seafloor of the Arctic Ocean. Strong winds over
the ESAS, as the image below shows, may have contributed, by mixing
warm water down to the seafloor.
On
the morning of September 25, 2015, methane reached levels as high as
2629 ppb, while mean global levels were at record high 1846 ppb. The
video below shows strong winds over the Arctic for the period
September 26 to October 3, 2015
Air
Temperature Rise NOAA
data show
that the year-to-date land surface temperature in July was 1.47°C
above the 20thcentury average on the Northern Hemisphere in 2015. A
polynomial trendline based on these data points at yet another
degree Celsius rise by 2030, on top of the current level, which
could make it 3.27°C warmer than in 1750 for most people on Earth
by the year 2030, as illustrated by the image below.
The
image below shows a non-linear trend that is contained in the
temperature data that NASA has gathered over the years, as described
in an earlier
post.
A polynomial trendline points at global temperature anomalies of
over 4°C by 2060. Even worse, a polynomial trend for the Arctic
shows temperature anomalies of over 4°C by 2020, 6°C by 2030 and
15°C by 2050, threatening to cause major feedbacks to kick in,
including albedo changes and methane releases that will trigger
runaway global warming that looks set to eventually catch up with
accelerated warming in the Arctic and result in global temperature
anomalies of 16°C by 2052.
The
situation is dire and calls for comprehensive and effective action,
as discussed at the Climate
Plan.

 Posts
Posts