Showing posts with label carbon monoxide. Show all posts

Friday, 27 May 2016

Carbon monoxide emissions from Siberian forest fires

Russia Emits Carbon Monoxide May 2016


Eastern Russia is emitting a lot of Carbon monoxide. This animation covers the period from May 1 to May 26, 2016.


Peat bogs giving off methane.


Via Facebook, Harold H Hensel

"Methane 05 23 2016

The pink is methane over 2000 ppb over West Siberian Peat Bogs. Over 1250 ppb is considered unlivable. Climate scientists Dr. James Hansen calculated the heat balance for methane.

He calls it energy balance. !250ppb is where the amount of heat captured or absorbed by the greenhouse gas methane equals the amount of heat that dissipates into space. 1250ppb is the stable balanced level.

More than 1250 ppb and methane builds up more heat than what dissipates. Over 1250 ppb and earth heats up. Too thick of a blanket.


The entire map is red or pink. We are headed toward an overheated and unlivable planet."

Sunday, 13 March 2016

Wednesday, 2 March 2016

California Dreaming: Instrumentation Error Seems illogical

This was the news release put out by NASA in response to observations of high carbon monoxide readings over the western United States

News release from NASA
Erroneous CO emissions over California cause unrealistic CO concentration in GEOS-5 model


March 1, 2016

IMPORTANT NOTICE: Elevated carbon monoxide (CO) concentrations over California in the GEOS-5 products since February 25, 2016, are incorrect. They are a consequence of unrealistic emissions derived from satellite observations of fires, which led to elevated concentrations of atmospheric CO (as well as other species).

NASA's EOS-Terra spacecraft entered safe mode on February 18, 2016, during an inclination adjustment maneuver. This caused the MODIS instrument to enter safe mode, with the nadir and space-view doors closed. When the Terra MODIS transitioned back to science mode on February 24, 2016, the operating temperatures for the SWIR and LWIR (Short-wave Infrared and Longwave infrared) focal planes have not yet stabilized. As a consequence, some data products have been severely degraded. This includes the "Fire Radiative Power" fields that are used by GEOS-5 to compute emissions of CO, CO2, and carbonaceous aerosols by biomass burning.

GMAO is working to correct this problem. The GEOS-5 analyses will be re-run from February 24, 2016, using only the EOS-Aqua MODIS data, in order to exclude the unrealistic CO emissions. EOS-Terra observations will be re-introduced once the instrument has stabilized.


With my lack of technical and scientific knowledge I was beginning to feel a bit like a conspiracy theorist in questioning NASA's explanation of instrumentational errors to deny the high readings.

So I am very pleased to have the company of Paul Beckwith who rejects the official explanation for very similar reasons to me. I believe he is spot-on.

Paul is no radical as we know. 

I sincerely hope someone will take up Paul's suggestion and do some investigation.

Questioning the NASA version of events
California Dreaming, Instrumentation Error Seems illogical


1 March, 2016


I took the day off to break ice, shop, get my hair cut, and see friends. What a day to take off:).  I stand by both of my videos released on February 29th on the California gas emissions on the major fault lines.

In my opinion NASA’s explanation below makes no sense whatsoever. I am actually amazed that this was claimed, since to me it is not consistent with the images.  Obviously, I will generate more videos to support my views.  

For starters:

1) They only mention CO, and say nothing about CO2 and SO2.
2) The emissions are spatially located over the fault-lines; how could fires aggregate in these regions?
3) There was an Earthquake in New Zealand around Feb 29th that showed CO release.
4) They are trying to say the error was just over California. Really? Was the data wrong over the whole globe?

5) I discussed the idea of “instrumentation error” in my second video yesterday. In my opinion, the explanation from NASA does not address any of the points in my video, which I stand by 100%.
If NASA had said that there was a gamed simulation that got into the data set that would have seemed more realistic to me–still implausible, in my opinion, but harder to prove wrong.  Facebook friends and others, please help me out by doing the following:
A) Go to the USGS site and pick an Earthquake that occurred within the last few months, say over 5 and anywhere in the world.

B) Go to 
Earth NullSchool and look at the CO, CO2 and SO2 data for a few weeks before and after the quake.

C) Share your findings, positive or negative below this post and throughout social media.

D) Do it quickly, in case the Earth NullSchool site is potentially compromised.

Thanks. The fact that NASA is claiming “instrumentation” makes me think even more that my videos are correct. Remember that I am not claiming that a quake will occur. See the conclusion of my second video yesterday to hear my thoughts.
———- ———-
Why was nothing said at all for five days?  By NASA, scientists, satellite engineers, climatologist?  Why was nothing said at all


The CO emission spike - the final word

These are my own reflections:

So, it was all unreal. The "claims" (which were really observations as I understand) were "questionable" at best and it never happened. it was all a technical fault?
I don't believe!

"So Gavin Schmidt, head of NASA, the guy who dissed Shakhova, Semiletov and Prof Wadhams to fend off criticism of his modelling - tells us that the Nullschool readings were a "glitch". These readings showed a huge spike and a gradual fall-off of levels.

That in my mind is not consistent with a glitch. If so,how could we ever trust the satellite readings or Nullschool again.

Schmidt is a political animal and who's to say that political considerations don't trump over scientific objectivity.

Who's to say that if methane readings go up exponentially that that too would be a "glitch" or they wouldn't just stop taking readings?"

That's my 2 cents for the morning.


CO2 emissions spike – was it just a glitch?


Considering that all the wildfire and human potential sources for the CO pulse are unlikely to produce the spike in the Nullschool data, that we have no warning of potential impending geological activity from the major agencies, and that we have had no other reports from related agencies to confirm the spike, we should also consider that there may well be something wrong with the monitor. Artifacts can appear in the satellite model data and it’s not unheard of to get a spike reading due to other signals impacting how physical models interpret sensor data.
Carbon Monoxide Hourly Observations San Bernandino
(Hourly carbon monoxide observations in Central San Bernardino do not match high surface CO measures recorded by the GEO5 model. Similar lower atmospheric readings come from station observations throughout Southern and Central California. Image source: CaliforniaAMQD.)
To this point, lack of confirmation at ground reporting stations for high CO readings appearing in the GEO5 monitor increase the likelihood that these high peak readings were a glitch or an artifact in the physical data. A cursory view of local warnings shows no local CO air quality alerts for the areas indicated in the Nullschool data set (You can view a list of the local monitors here). Analysis of this data also shows much lower CO readings from these stations in the range of 400 to 1200 parts per billion — quite a bit lower than what the GEO5 monitor is showing.
So what we have is one model showing a very high CO spike, but none of the related ground monitors picking it up. Since there are hundreds of ground stations in this region, it seems quite a bit less likely that there is something wrong with each of the readings coming from these stations than from the GEO 5 model itself.
This begs the question — was there some kind of false positive that confused GEO 5? Was there some other signal that tripped the model to show such a high reading? But to these points, a general lack of overall confirmation from the hundreds of ground sensors scattered across the region seems to point to the likelihood that such elevated readings in the GEO 5 monitor were a glitch, an artifact, or a false reading for this atmospheric level.
UPDATED: Final Confirmation From Earth Nullschool — It’s A Re-Calibration Glitch

Earth Nullschool — the site that produces the above satellite data has listed a final confirmation. The measure used to interpret atmospheric data was in the process of being re-calibrated and produced a stronger than typical signal. In other words, high CO readings for this region were a glitch. They note:
“It’s pure coincidence that at MOPITT resumed data collection over western North America while its operating temperature was still stabilizing. Had the instrument’s temperature remained unstable for a few days, it would have looked like the whole globe was erupting gas. If MOPITT has started collecting data over the south pole, open ocean, or some other obscure location, I doubt anyone would have noticed and made a big fuss. MOPITT uses light collected in the infrared part of the spectrum. Based on Terra’s system status, the CO, CO2 and SO2 data collected by MOPITT on the 25th and 26th of February should be highly suspect. On the Earth map, the CO, CO2, and SO2 levels spike sometime between 1pm and 4pm Pacific time on Feb. 25th, which is between 2100 UTC on the 25th and 0000 UTC on the 26th. This is precisely during the time window when MOPITT’s operating temperature is still unstable.”
In addition, Dr. Gavin Schmidt, head of GISS NASA, has confirmed the glitch in his twitter feed which you can read here. Bryan, a poster here and blogger over at Of Tech and Learning, did a bang up analysis on the issue last night, which you can read here.

Earlier Sam Carana came up with an alternative explanation


What made carbon dioxide, carbon monoxide and sulfur dioxide levels skyrocket over California?

The image shows levels as high as 990 ppm the day after, i.e. on February 26, 2016. I earlier posted images showing carbon monoxide levels as high as 46,931 ppb and I also spotted sulfur dioxide levels as high as 743.72 µg/m3 on that day.

So, what caused this?

One theory is that this was caused by seismic activity, with large amounts of carbon dioxide, carbon monoxide and sulfur dioxide being released from fractures running along faultlines.

Here's another theory. On February 18, 2016, state officials announced that the Aliso Canyon leak was permanently plugged. Since the natural gas could no longer escape there, pressure started to build up inside the reservoir, until one or more new holes formed elsewhere from where the natural gas started to escape abruptly into the atmosphere, which likely started in the evening of February 25, 2016.

So, here is what I think could have happened. Huge methane emissions resulted from the new leak(s) and the methane started to oxidize into carbon dioxide. The oxidation resulted in hydroxyl depletion and this meant there was less hydroxyl around to oxidize carbon monoxide and sulfur dioxide, resulting in carbon monoxide and sulfur dioxide levels skyrocketing as well

Don't worry (sic). Nothing ever happened at all and  besides the Indian paper was "questionable at best"

Here's a sceptical blog post.

Bad Data – Carbon Monoxide Eruption Over Western North America Not Real


The internet has been in a tizzy over the over the possibility that this sudden and dramatic output of CO, as well as CO2 and SO2, signifies that a large earthquake is imminent on the west coast. The basis for these claims is a paper that appeared in the journal Applied Geochemistry authored by Dr. Ramesh Singh titled, “Satellite detection of carbon monoxide emission prior to the Gujarat earthquake of 26 January 2001.” Most of the blogs have been linking to this page on NatureIndia.com.


I’ve read the journal paper, and it’s claims are questionable at best. However the merits of the paper are irrelevant because there was no major gas emission on February 25th.


For some reason, no one seems to be questioning the data upon when Nullschool.net’s Earth map is based. Stuff happens and sometimes, though not often, scientific instruments can malfunction. ….

I wonder if the same people  who would contend who noticed this and put out the alert  are just irresponsible 'scaremongers' would regard those who blow the whistle on the methane clathrate gun in a similar vein.

I strongly suspect they would.

.....

Dutchsinse has now commented

3/01/2016— LARGE CARBON (CO) MONOXIDE GAS RELEASE ALONG THE WEST COAST — ASEISMIC PRECURSOR SEEN IN ACTION


Hundreds of my viewers have contacted me regarding a large sudden (and strange ) Carbon Monoxide gas eruption across the West Coast of the United States.

This is the latest reading -also a glitch? - from Nullschool, showing the CO dissipating offshore.


Tuesday, 1 March 2016

Media coverage of carbn monoxide spike in California

Is this the only coverage in the media that this has got?


Can we pause the Bernie-Hillary wars for a moment? Major Carbon Monoxide Explosion West Coast


Daily Kos,
29 February, 2016

Breaking news. No one at this point seems to know what is going on but early thoughts suggest a major earthquake may occur at any time. I have to dash to work shortly, and hopefully a new story will be written by some of the brilliant scientific minds on Daily Kos that will provide updates and analysis. Why isn’t the mainstream media all over this story? Thank God for the green roots for breaking this story.
 Some theory on a possible earthquake connection. www.natureasia.com/…
Earth emits a burst of carbon monoxide (CO) a few days before an earthquake, according to geophysicist Ramesh Singh. He and co-workers from France and the United States report that this gas could be used as one of the precursor signals for an earthquake early warning system.
The scientists used data from an American satellite and analysed changes in carbon monoxide at different altitudes. "The carbon monoxide shows enhancement in concentration a few days prior to the earthquake," Singh said.
snip
According to the scientists, CO gas is forced out of the earth due to the build up of stress prior to the earthquake "influencing the hydrological regime around the epicentre."
Be careful California, and review your disaster plans. Better safe than sorry.
From Robert Scribbler:  robertscribbler.com/...
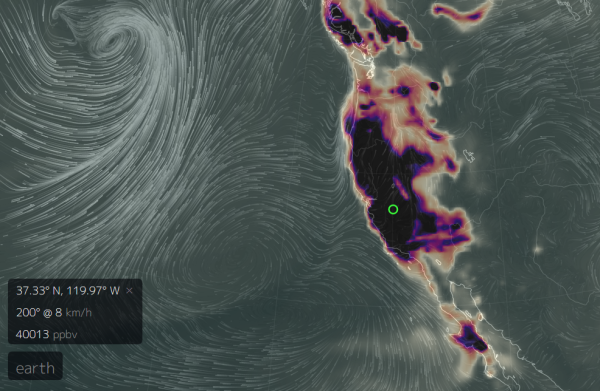
On February 26, The Global Forecast System model recorded an intense and wide-ranging carbon monoxide (CO) spike over the US West Coast. A region stretching from British Columbia, through Washington and Oregon, and on over most of California experienced CO readings ranging from about 5,000 parts per billion over the mountains of Southwestern Canada to as high as 40,000 parts per billion over Southern California. Very high peak readings appear to have occurred from Northern California near Eureka and the southern edge of the Cascadia Subduction Zone and along a line south and eastward over much of Central California to an extreme peak zone just north and west of Los Angeles near Palmdale along the San Andreas Fault Line.


Paul Beckwith talks about the carbon monoxide spike in California


Paul Beckwith has just made a video with a lecture about the CO and CO2 emissions spike in California

California Faultlines Rupture Releasing CO, CO2 and SO2

On February 25 between 16:00 and 19:00 there appeared to be a rupture of the major faultlines on the West Coast of the US. The gases CO, CO2 and SO2 were measured to skyrocket, stay very high (indicating ongoing emissions) for at least 18 hours and then slowly dissipate. The spatial pattern of the emissions followed the "tuning fork" pattern of the major faultlines.


Monday, 29 February 2016

More on the carbon monoxide spike

From Malcolm Light via Facebook
"It is pretty obvious. We are running out of time faster and faster as the 5 year deadline approaches for the subsea Arctic atmospheric methane blowout and terminal firestorm."

Carbon Monoxide Spikes to 40,000 Parts Per Billion over California on February 26 — What the Heck is Going On?


28 February, 2016

On February 26, The Global Forecast System model recorded an intense and wide-ranging carbon monoxide (CO) spike over the US West Coast. A region stretching from British Columbia, through Washington and Oregon, and on over most of California experienced CO readings ranging from about 5,000 parts per billion over the mountains of Southwestern Canada to as high as 40,000 parts per billion over Southern California. Very high peak readings appear to have occurred from Northern California near Eureka and the southern edge of the Cascadia Subduction Zone and along a line south and eastward over much of Central California to an extreme peak zone just north and west of Los Angeles near Palmdale along the San Andreas Fault Line.

40000 ppbv
(Very large CO spike over Western North America near major geological features on February 26, 2016. Image source: Earth Nullschool.)

For reference, these readings were between 50 and 265 times above typical background CO levels of about 150 parts per billion and up to twelve times higher than secnd highest peak readings over polluted regions of China during the same period.Human-based carbon monoxide sources are not generally known to produce spike readings so high and so wide-ranging. Nor are wildfires (of which there were no reports for this region). The primary suspect for this preliminary observation, therefore, is geological. As the spike occurs over large fault lines, volcanoes, and above other active geological features along the US and Canadian West, it appears that activity within these features may have produced a brief if intense burp of this gas. Sulfur dioxide (SO2) readings — another geological gas — were also elevated, with peak readings again appearing in Southwestern California.
It’s worth noting that no major US or Canadian geological organization has yet made any report on this particularly large CO spike. However, a piece of scientific research in Nature Asia, by K. S. Jayaraman notes that major CO and SO2 spikes may be an indication that future earthquake activity is on the way. 

Singh said that CO levels were taken by an instrument onboard NASA’s Terra satellite — launched in 2009 — circling the earth in a polar orbit at a height of 705 km. The instrument measures CO concentrations at different heights and also computes the total amount of the gas in a vertical column of air above the earth surface.
Analysis of the satellite data showed a large peak in CO concentrations during January 19 and 20 — a week before the main earthquake event.On January 19, the total CO in the vertical column was also higher than usual. After the 26 January earthquake the concentration of the gas dropped.
According to the scientists, CO gas is forced out of the earth due to the build up of stress prior to the earthquake “influencing the hydrological regime around the epicentre.”
This particular bit of research appears to have had no confirmation or further comment in the sciences at this time. So the predictive usefulness of large CO spikes prior to earthquakes remains quite uncertain. And, as noted above, no major geological information outlet has made any warning or comment on earthquake risk so far. Thus the current very large West Coast CO spike near major fault lines remains a bit of a mystery.
Links:
Hat tip to Mike
Hat tip to MlParrish
Hat tip to WeHappyFew

Carbon Monoxide Spikes to 27,000+ Where "Usual" is only around 150 on West Coast - May Signal Coming MASSIVE Earthquake


27 February, 2016

"Unprecedented" and "dangerous" levels of Carbon Monoxide are being released into the atmosphere from seismic faults.  The levels are so bad, they're dangerous! 
People on the West coast may find they are having trouble breathing and feel strangely tired.  Some folks may notice the surface of their skin taking on a bright red appearance; the signs of Carbon Monoxide poisoning.
Scientists are working feverishly to try to determine the cause, but, they say a consensus is quickly developing:  The earth itself is emitting this gas and it is being released into the atmosphere via seismic fault lines; cracks in the earth's surface where tectonic plates rub together.
If levels continue to rise as they presently are, people could be overcome, pass out and die from this.
As of 11:00 PM eastern US time on 27 February, 2016, there is no other place on the entire planet with Carbon Monoxide levels this bad or this widespread.  It is completely unprecedented!
 Readers can see the levels for themselves, LIVE, by clicking HERE
To give you an indication of how rare and how severe this is, take a look at the screen shots below.
In this location, surface level Carbon Monoxide is 27,121 in an area where the "usual" level is around 150.!


Compare the reading above to a different area, below (circled OUTSIDE the "bloom") and you'll see barely any reading at all (123 ppbv):

According to the Consumer Product Safety Commission:
Because CO is odorless, colorless, and otherwise undetectable to the human senses, people may not know that they are being exposed. The initial symptoms of low to moderate CO poisoning are similar to the flu (but without the fever). They include:

  • Headache
  • Fatigue
  • Shortness of breath
  • Nausea
  • Dizziness
High level CO poisoning results in progressively more severe symptoms, including:

  • Mental confusion
  • Vomiting
  • Loss of muscular coordination
  • Loss of consciousness
  • Ultimately death
Symptom severity is related to both the CO level and the duration of exposure. For slowly developing residential CO problems, occupants and/or physicians can mistake mild to moderate CO poisoning symptoms for the flu, which sometimes results in tragic deaths. For rapidly developing, high level CO exposures (e.g., associated with use of generators in residential spaces), victims can rapidly become mentally confused, and can lose muscle control without having first experienced milder symptoms; they will likely die if not rescued.

 NOT MAN MADE

It is important to emphasize this "bloom" of Carbon Monoxide is not man-made.  It is not possible for human activity to cause this type of staggering increase over such an enormous area.  It is almost like the planet itself is attacking the people out there; even though it would be absurd to think the planet would "attack" anyone.
Why such an emission of deadly Carbon Monoxide would suddenly spew forth from inside the earth is unknown at this time.  But it is clear on its face, that in order for this to be taking place, something changed underground on a continental scale.  Something moved or cracked along the entire west coast of North America.  That is the ONLY logical explanation for this event.  What it means for the future we just don't know.

Carbon monoxide may signal earthquake

Earth emits a burst of carbon monoxide (CO) a few days before an earthquake, according to geophysicist Ramesh Singh, pictured left. He and co-workers from France and the United States report that this gas could be used as one of the precursor signals for an earthquake early warning system.
The scientists used data from an American satellite and analyzed changes in carbon monoxide at different altitudes. "The carbon monoxide shows enhancement in concentration a few days prior to the earthquake," Singh said.
Singh, who was formerly with the Indian Institute of Technology in Kanpur, is currently in the physics department of Chapman University in California, USA. The project was funded by the Indo-French Centre for the Promotion of Advanced Research in New Delhi.
The researchers discovered the connection between CO emission and earthquake by analyzing satellite remote sensing data collected around the time when a 7.6 magnitude earthquake shook Gujarat in western India nine years ago killing about 20,000 people and rendering thousands homeless.
Singh said that CO levels were taken by an instrument onboard NASA's Terra satellite — launched in 2009 — circling the earth in a polar orbit at a height of 705 km. The instrument measures CO concentrations at different heights and also computes the total amount of the gas in a vertical column of air above the earth surface.
Analysis of the satellite data showed a large peak in CO concentrations during January 19 and 20 — a week before the main earthquake event. On January 19, the total CO in the vertical column was also higher than usual. After the 26 January earthquake the concentration of the gas dropped.
According to the scientists, CO gas is forced out of the earth due to the build up of stress prior to the earthquake "influencing the hydrological regime around the epicenter."
Singh said an anomalous increase in land surface temperature a few days prior to Gujarat earthquake — as inferred from the data of NASA's other satellite MODIS — is also related to the CO emission. "The increase of column CO and concentrations of CO may have enhanced the land surface temperature," he said.
"The anomalous changes in CO concentrations prior to the main earthquake event and enhancement of temperature of the earth surface observed from MODIS satellite data give an indication of coupling between land and atmosphere," the scientists report. Singh said observation by other researchers of a sudden increase in water vapour in the atmosphere and changes in the ionosphere a few days prior to the Gujarat earthquake all seem to be connected.
According to the report, all these observations including the latest discovery of CO emission show the existence of a 'strong coupling' between land-atmosphere-ionosphere. "The integration of all these parameters in a seismically active region therefore looks a potential approach to understand earthquake processes and may provide reliable information about an impending earthquake," the researchers conclude.

References 

  1. Singh, R.P. et al. Satellite detection of carbon monoxide emission prior to the Gujarat earthquake of 26 January 2001. Appl. Geochem. doi: 10.1016/j.apgeochem.2010.01.014(2010)