Posts
Posts


A
report from the Arctic as the sun sets over the North Pole - 16
October, 2018
Until Margo is able to do another of her updates on the Arctic ice I am going share what I can see with my own eyes by looking at the same set of data I look at every time.
I have tried, this year to avoid reactions like "there is going to be a blue sea event", or "No there's not. We have bought ourselves another year".
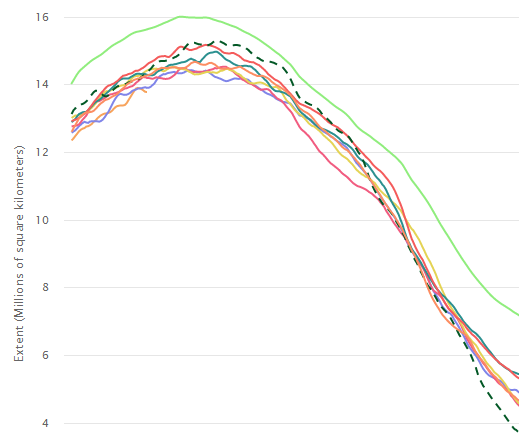
The first thing that stands out is that the sea ice extent has not changed that very much since the official end of the melt season almost a month ago.

In this short video I pick up on some features that stand out for me from looking at today's images on NASA Worldview.
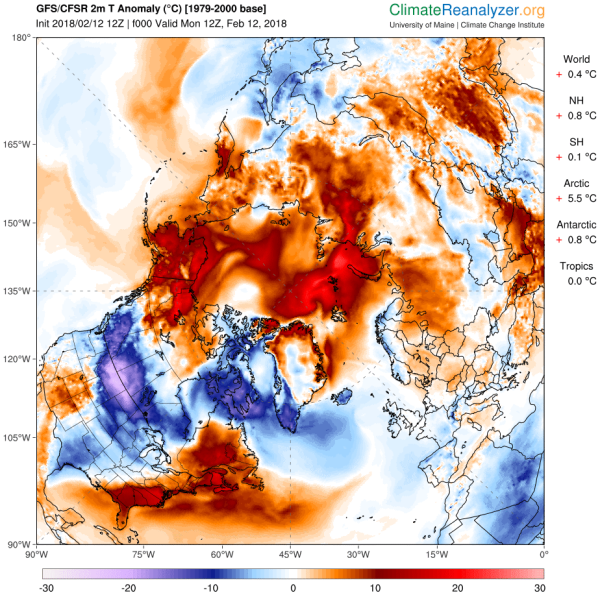
As can be seen clearly here temperatures are much, much warmer than the historical average.
Looking at the data from NASA Worldview we can see that temperatures at the Pole vary from 264K (-9C) to 254K (-20C)

Here is a generalised view from today. Most areas are covered in thick cloud as they have for several days.


Once again we have these strange clouds which I do not find it difficult to imagine that some sort of microwave or weather modification has been used. I still cannot think of a simple and credible reason why it should be like this

Algal blooms in the Arctic?
Yesterday I posted the following article without comment which suggested that the Arctic sea ice decline is driving phytoplankton into the North.

This
true-color image, captured by the NOAA-20 satellite on July 30, 2018,
shows a large phytoplankton bloom in the Barents Sea. Credit: NOAA
Environmental Visualization Laboratory
I decided to consult Sam Carana of the Arctic News for his views on this. He came back quickly with an answer that accorded with what my own views were:
"Looks
like algae to me. Phytoplankton includes algae, bacteria and more.
Terminology can be confusing. Cyanobacteria are sometimes considered
to be algae. I guess there will be ships taking samples reporting
soon."
The
various species of algae are vastly different from each other, not
only in pigmentation, but in cellular structure, complexity, and
chosen environment 4,5. As such, algal taxonomy is still under
debate, with some organizations classifying algae under different
kingdoms, including Plantae, Protozoa and Chromista 4,6,8,9. While
the overarching kingdom classification is not always agreed upon, the
species, genus, family, class and phylum of each alga generally are
6.
To
further complicate this nomenclature, single-celled algae often fall
under the broad category of phytoplankton.
Here are some of the photos of the region showing the phenomenon.
From the 14 October.....

And from a similar period from last year, 2017.
It is therefore not totally new but relates to precisely this time of the year.

The official data confirms what we have been saying - and that there has been no or very little) refreeze.

Despite moving into the northern winter, part from a narrow strip north of Canada and Greenland there is nowhere in the Arctic where the thickness is greater than 1-1.5 meters.

First,
the latest available figures at ground level from CAMS (Monday, 15
October)

Here are some other figures (from NOAA)...

"Here is the data for the year-to-date on methane from Mount Loa. In my time there has been a habit on the part of NOAA to scrub out readings that deviate from the norm as here."

And from Barrow, Alaska...
"Looks
like NOAA has stopped erasing the Barrow Methane data. Let's face it,
nobody believes the trimmed down Data that Boulder leaves us after
they erase all of the high readings as they have been doing since
2015."
---
Joe Neubarth, via Facebook

Here are some data from 469 mb

Remember, this is the peak reading from a hot spot on the chart.
It is not the average. NOAA screws around with the average and tries
to eliminate the highest readings that are usually over the eastern
Siberian area or Greenland. There is another hot spot that they avoid
to make certain they lower the first two hot spots.
They will on
occasion use a White Out to make it appear that the satellite missed
an orbit over Alaska or over other parts of Siberia or China if there
is too much pink in the atmosphere.
---Joe Neubarth, via Facebook
This is from CAMS from approximately the same altitude - 500 hPa (approx. 19,000 feet (or 6,000 meters)