Showing posts with label global waming. Show all posts

Monday, 19 October 2020

High wave heights in the Arctic Ocean


High wave heights 

throughout the Arctic Ocean


Thee are waves throughout the Arctic Ocean of between 6 and 10 feet in height demonstrating the atlantification of the ocean and explaining why the ice is very slow in re-forming.


No one is talking about it.


Tuesday, 8 May 2018

Major heat wave in the Arctic

Even when he's not talking about electric cars I no longer see Robertscribbler as a totally honest player

Arctic Ocean Deep in the Grips of May Temperature Spike; Beastly Summer Melt Season on the Way?

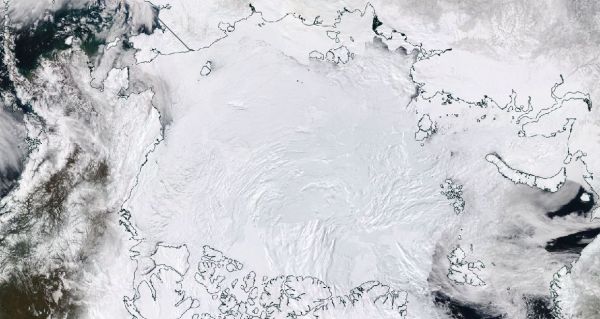
The Arctic Ocean as it appeared from space on May 6, 2018. Image source: NASA Worldview.
7 May, 2018

The Arctic sea ice is presently at its second lowest extent ever recorded in most of the major monitors. However, May is shaping up to be far, far warmer than normal for the Arctic Ocean region. If such high temperatures over this typically-frozen part of our world continue for much longer than a couple of weeks at this key time of year, precipitous summer melt is sure to follow.

******
During recent years there has been much speculation about when the Arctic Ocean will start to experience ice-free summers as fossil fuel related industries pump higher and higher volumes of greenhouse gasses into the atmosphere. In the early-to-mid 2000s, scientific consensus was that melt would tend to be more gradual and ice-free summers would hold off until the final decades of the 21st Century when the world was around 3-4 C warmer than 19th Century averages.
But the Earth System is far more sensitive to temperature increases than the early forecasts expected. Major Arctic sea ice losses surprised the world during September of 2007 and subsequently in the same month of 2012. Now, it is obvious that a pattern of far more rapid sea ice melt has taken hold. And the scientific consensus appears to have settled on a more likely and much nearer date around the early 2030s — when the world will have warmed by about 1.6 degrees Celsius.

However, when it comes to sea ice, nothing is certain at this time. Any single Arctic year in which temperatures spike — particularly during normal melt season — could result in the losses that we once expected to occur much later in time.

There are many factors that will ultimately determine when a summer ice free state occurs. Warm winters are a major one. And the past two years (2017 and 2018) have seen Arctic winters in which temperatures hit some ridiculous high extremes. But another major factor is the set-up to Arctic summer that takes place during the window months of May and June.

Neven, one of our best Arctic Sea Ice watchers (you can check his blog out here), notes:
May and June are very important for the rest of the melting season. Not only do we now see these warm air intrusions, but high pressure maintains its presence over parts of the Arctic as well (which means relatively cloudless skies -> insolation -> melt onset and melt pond formation -> preconditioning of the ice pack -> melting momentum that gets expressed during July and August, regardless of the weather)… We have to wait and see what happens, step by step, but this isn’t a good start for the ice.
If May and June are unusually warm, particularly over the Arctic Ocean, then the sea ice — which is already greatly weakened — is bound to face an extended period of above-freezing temperatures. If such a period stretches for 5 months from May through September rather than the typical 4 months (June to September), then we are more likely to see the Arctic Ocean briefly flip into an ice-free or near ice-free state for the first time in human history.
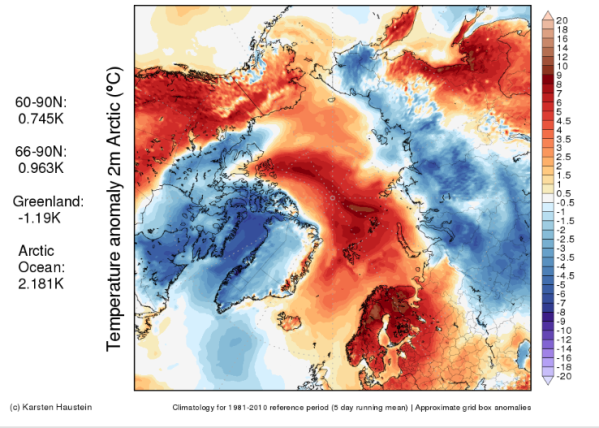
(The coming week is expected to feature between 1 and 10 C above average temperatures for locations across the Arctic Ocean. These are very strong warm departures during May. Last week saw similar extreme warm departures. And we are already starting to see sea ice losses pile up. Image source: Global and Regional Climate Anomalies.)

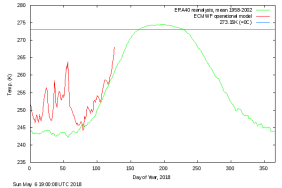
This year, May is shaping up to be much, much warmer than normal for the High Arctic. Already, a large May temperature spike has occurred (see right image below). A temperature spike which is predicted to continue for at least the next ten days.

Not to put too fine a point on it, but this severe warming trend might end up presenting a bit of a problem. The extended period of melt mentioned above may begin in force — setting off a chain of feedbacks that could tip the Arctic Ocean into a far less frozen or even an ice-free state (under absolute worst case scenarios) this year.
To be clear, this is not a forecast that such a condition is bound to occur during 2018. It is just an analysis of underlying trends and a statement that risks are higher if such trends as we now observe continue. Late May could flip to a cooler than normal regime. June could be cooler and cloudier than normal (as happened during 2016 and 2017). And if that happens again, we may be spared.
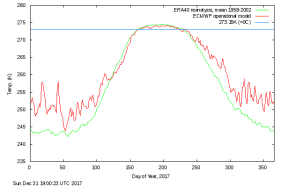
(Average Arctic temperatures for 2017 [left] and 2018 [right]. The red line depicts the yearly temperature trend. The green line depicts the Arctic climatological average for 1958-2002 [which was already warmer than normal]. Note the big temperature spike in the right hand graph. That’s where we are now. Image source: DMI. For further reference, see Zack Labe‘s composite temperature analysis for the 80 North region.)

However, we are already on a much higher ramp for spring temperatures in the northern polar region than during 2017. And though 2016 saw a slightly warmer than normal spring near the pole, the May 2018 spike already far exceeds anything we saw at that time. So much, in fact, that present temperatures for May 6 are comparable to those typically seen during early June from the 80 degree N Latitude line to the Pole.

This higher ramp and related record warmth is already accelerating melt. Sea ice losses over recent days have greatly picked up and we are getting closer to record low daily ranges. If melt accelerates to a point, the greatly expanded darker ocean surfaces will draw in more heat from the sun’s rays during June — potentially overcoming the impact of the increased early summer cloudiness we have seen during recent years. Such a scenario, if it continues to develop, would be a nightmare from the climate change perspective.


Friday, 10 November 2017

A third world problem has come to southern Europe

Climate Change Related Drought Bakes the Iberian Peninsula

Suddenly what was once thought to be a problem confined to the third world has arrived in southern Europe.”
Euronews.


Robertscribbler,
9 November, 2017


We’ve been taught that human-caused climate change through fossil fuel burning only affects poor people. That it only affects the third world. That if you’re rich, or if you live in places like the U.S. and Europe, you’re safe — or at least safer.


We’ve been misinformed.


Climate Change in Our Front Yard


Here, on this blog, again and again, we’ve been warning that climate change impacts EVERYONE. That no-one is really safe from either its direct or systemic impacts. From the subsistence farmer in Africa to the Wall Street hedge fund manager, the damage is ultimately equally bad.

The reason is that the worsening climate change related impacts of sea level rise, extreme weather, acidifying and anoxic oceans are ultimately so far reaching that you can’t call any place on Earth realistically safe from harm. And even if you do avoid the barrage of these varied impacts personally, the damage from rising levels of warming is eventually so deep and widespread that there is serious risk of collapse to the various systems civilization relies on to function — like water, power, transportation, and food supply.


(Despite popular misconception, the wealthier countries of the world are not immune to or even really very resilient to the impacts of climate change. We are seeing this start to bear out now in numerous places to include Southeastern Europe. Namely, the Iberian Peninsula where drought is severely impacting Portugal and Spain. Image source: Global Drought Monitor.)
Though the effects may well be milder at the present 1.2 C warming than they would be at 2 C, 3 C, 5 C or more, they are starting to hit now. And they are hitting indiscriminately across broad regions from Canada, to California, to New York City, to New Orleans, to Brazil, to Bangladesh, to Russia, to Puerto Rico, to India and China, and to more far-flung and wildly varied locations than we can list here. The systemic collapse of Puerto Rico due to a global warming amplified hurricane, can be seen as a relative microcosm to what’s in store for broader global civilization if we don’t get our act together in reducing carbon emissions zero and then net-negative , limiting future warming to more manageable levels, and hardening societies to warming related impacts as rapidly as possible.


Severe Drought in Spain and Portugal


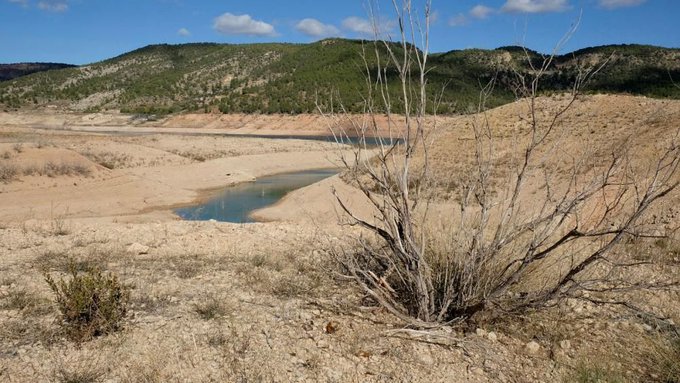
This week, just one more story of catastrophic climate change related impacts focuses on the Iberian Peninsula in Europe. 2017 is presently Spain’s third driest year on record. Following an abnormally dry 4-year period, the situation is starting to get critical. The Douru River, which is basically the Spanish wine-growing region’s Mississippi, is 60 percent dry. Massive reservoirs like the Cuerda del pozo are empty. Hydroelectrical supplies have been cut by 58 percent. And wildfires and crop failures have run rampant with the worst grape harvest in decades leading to a global shortage of wine.
View image on Twitter
In Portugal, the driest October in 20 years has spurred a government campaign to conserve water — asking people to turn off the taps immediately rather than leave them running. In some places of the country, water is having to be shipped in by truck as local sources fail. The Prime Minister of the country is stating that a water miracle is needed to relieve drought conditions.


These impacts follow a deadly wildfire outbreak in October that killed 44 people and injured 71. One of the region’s worst on record that adds to the context of fires like the Fort McMurray Fire in Alberta and the recent Northern California wildfires that destroyed more than 10,000 buildings.


Rain in the Forecast, But Global Warming Will Bring Worsening Droughts to the Region


Human-caused global warming increases the likelihood of extreme drought by increasing the rate of both precipitation and evaporation. Because this effect is uneven, as the world warms, the prevalence tips toward the extremes. In other words, more of the rain we receive falls less frequently but in heavier events. In addition, rising temperatures enhance the onset and intensity of drought.


For Spain and Portugal, climate zones are moving north. This means that desert-like temperatures and conditions from across the Med in the Sahara are more frequently invading. A reality that most of Southern Europe will eventually face if the Earth continues to warm. That said, forecasts for this winter call for some relief in the form of increased precipitation. For Spain and Portugal, it couldn’t come too soon. But with conditions having been consistently drier than normal over recent years, it will take a very significant pattern change to alleviate presently severe conditions.


Hat tip to BobinSpain

Thursday, 2 November 2017

Extreme conditions at BOTH poles

If you can sleep well after reading the following I would regard you as being dim-witted or insensitive.

Extreme Warming at the Poles this Week — Arctic and Antarctic Temperatures to Rise to 20-30 C Above Average in Some Locations


1 November, 2017
Human-caused climate change via fossil fuel burning produces a number of stranger things. And some of the weirdest happen to occur in the polar regions of our world.
One of the foremost of these odd impacts is called polar amplification. Under polar amplification, the warming effects of elevated greenhouse gasses are concentrated at the poles. This is due to reduced reflectivity (albedo) from smaller snow and sea ice concentrations, due to the increased intensity of the greenhouse effect in colder and darker regions, and due to increased energy transfer from lower latitudes into upper latitudes due to weakening of the polar Jet Stream.

Over the next week, this kind of polar amplification is predicted to generate very extreme warm temperatures for both poles of our world.
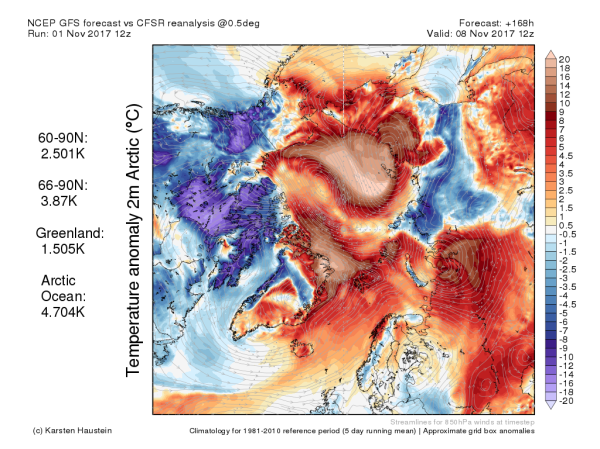
(Warm winds blowing into the Arctic will produce far above average temperatures this week. Image source: Global and Regional Climate Anomalies.)

In the Arctic, temperatures in both Northern Greenland and on the Siberian side of the Arctic Ocean are predicted to hit ranges higher than 20 degrees Celsius above average (36 degrees Fahrenheit) with some readings over Northeastern Siberia striking near the 30 C above average mark by early next week (54 degrees F). This will produce near or above freezing temperatures over both Siberia and sections of the Arctic Ocean above the 80 degree North Latitude line. Overall, temperatures are predicted to average as high as 4.4 C above average for the entire Arctic. A very considerable warm temperature departure consistent with the heightened levels of global warming the world has been experiencing during recent years.

In the Antarctic, where temperature variance should be moderating as austral spring shifts toward summer, the exact opposite is occurring. Very warm temperatures hitting more than20 C above average are expected to sweep across East Antarctica this week and ultimately cross over to West AntarcticaAbove freezing or near freezing temperatures in some coastal regions including coastal West Antarctica and over the Amery Ice Shelf in East Antarctica will accompany far warmer than normal, but still below freezing, temperatures inland.

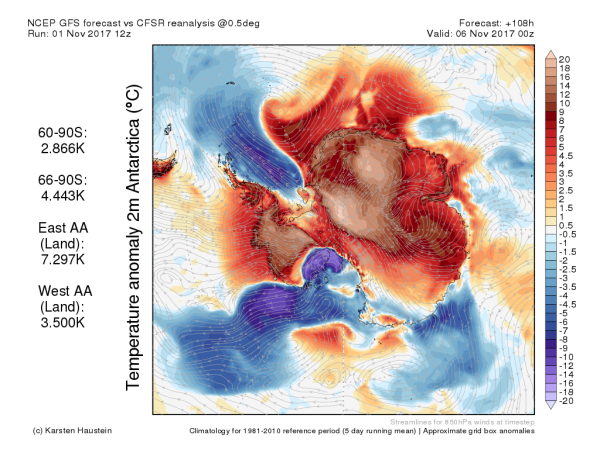
(Even as the Arctic is predicted to heat up, the Antarctic is also expected to experience much warmer than normal conditions. Image source: Global and Regional Climate Anomalies.)

Overall temperatures for East Antarctic land masses will hit an amazing 7 C above averageeven as temperatures for West Antarctic land masses rise to 5.1 C above average for later this week.

Primary atmospheric drivers for these warming events are large synoptic warm wind patterns drawing above average temperatures into both the Arctic and Antarctic. In the Arctic, winds crossing hundreds of miles of warm Pacific Ocean in association with the back side of a high pressure system moving over the Bering Sea will draw these very warm temperatures northward. In the Antarctic, warm winds funneling southward from Australia will reinforce the influence of a strong high pressure dome over East Antarctica even as another strong synoptic warm wind pattern feeds into West Antarctica off the Pacific and Southern Oceans later in the week.

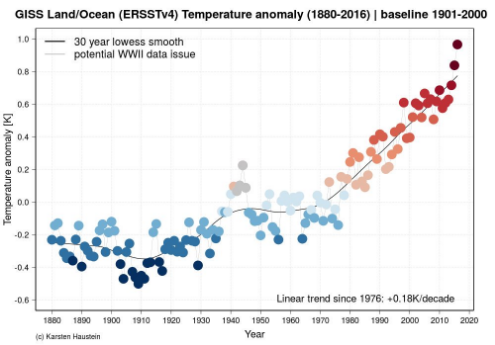
It’s very early for temperatures over parts of Antarctica to be pushing above freezing. And it’s rather late for such similar temperatures to be continuing to invade so far north into the Arctic. So much warmth will have an ongoing deleterious impact to both sea and land ice as well as snow cover. Contributing to the overall pattern of warming and melt we’ve seen for both Antarctica and the Arctic during recent years as global temperatures have risen into a range from 1 C to 1.2 C above 1880s averages.
Links:


Friday, 21 July 2017

A farewell to ice - from Torstein Viddal

From my friend, Torstein Viddal


Winter Blue Ocean Update 900
RIP IPPC

Torstein Viddal


Monday, 19 June 2017

A new scientic paper from Natalia Shakhova and Igor Semiletov


In their discussion Paul Beckwith and Alex Smith of Radio Eco Shock made reference to a paper being released in June that talks of an eightfold increase in methane emissions in Siberia.

Have methane emissions in
East Siberian Shelf increased 800%?

Here is the discussion 

Listen to "New paper by Semiletov and Shakhova on methane hydrates" on Spreaker.

And the Reddit item they refer to- 

Eight times higher is like an 800% increase. Natalia Shakhova and Igor Semiletov will release a paper soon detailing this explosive data. This duo have been studying methane emission in the arctic for nearly 20 years. They first brought this to our attention in 2011, and were roundly poo pooed by computer model jocks, Gavin Schmidt and Michael Man. Thanks dylanoliver233.


Thanks to Robert Leisure for finding what looks like the latest paper.

These are his notes- 


Is this it? 
Published: 9 June 2017 , Natalia Shakhova, and Igor Semiletov
The East Siberian Arctic Shelf, the world’s largest and shallowest shelf (covering 2.1 × 10⁶ km2) containing the largest area of sub-merged permafrost, contains vast CH4 deposits as subsea permafrost, CH4 hydrates, and natural gas reservoirs. Reservoir estimates are ∼ 10 000 Gt (1 Gt = 1015 g) of CH4 hydrates.
Atmospheric release of just 0.5 % of the Arctic shelf hydrate CH4 will cause abrupt climate change.


Sonar gas flux estimation by bubble insonification: application to methane bubble flux from seep areas in the outer Laptev Sea


Ira Leifer1,Denis Chernykh2,3, Natalia Shakhova3,4, and Igor Semiletov2,3,4
1 Bubbleology Research International, Solvang, CA 93463, USA
2 Russian Academy of Science, Pacific Oceanological Institute, Vladivostok, Russia
3 Tomsk Polytechnic University, Tomsk, Russia
4 University Alaska Fairbanks, International Arctic Research Center, Fairbanks, AK 99775, USA
Received: 23 Jun 2016 – Discussion started: 07 Jul 2016
Revised: 06 Feb 2017 – Accepted: 06 Feb 2017 – Published: 09 Jun 2017

Abstract. Sonar surveys provide an effective mechanism for mapping seabed methane flux emissions, with Arctic submerged permafrost seepage having great potential to significantly affect climate. We created in situ engineered bubble plumes from 40 m depth with fluxes spanning 0.019 to 1.1 L s−1 to derive the in situ calibration curve (Q(σ)). These nonlinear curves related flux (Q) to sonar return (σ) for a multibeam echosounder (MBES) and a single-beam echosounder (SBES) for a range of depths. The analysis demonstrated significant multiple bubble acoustic scattering – precluding the use of a theoretical approach to derive Q(σ) from the product of the bubble Ïƒ(r) and the bubble size distribution where r is bubble radius. The bubble plume Ïƒ occurrence probability distribution function (Ψ(σ)) with respect to Q found Ψ(σ) for weak Ïƒ well described by a power law that likely correlated with small-bubble dispersion and was strongly depth dependent. Ψ(σ) for strong Ïƒ was largely depth independent, consistent with bubble plume behavior where large bubbles in a plume remain in a focused core. Ψ(σ) was bimodal for all but the weakest plumes.


Q(σ) was applied to sonar observations of natural arctic Laptev Sea seepage after accounting for volumetric change with numerical bubble plume simulations. Simulations addressed different depths and gases between calibration and seep plumes. Total mass fluxes (Qm) were 5.56, 42.73, and 4.88 mmol s−1 for MBES data with good to reasonable agreement (4–37 %) between the SBES and MBES systems. The seepage flux occurrence probability distribution function (Ψ(Q)) was bimodal, with weak Ψ(Q) in each seep area well described by a power law, suggesting primarily minor bubble plumes. The seepage-mapped spatial patterns suggested subsurface geologic control attributing methane fluxes to the current state of subsea permafrost.


Citation: Leifer, I., Chernykh, D., Shakhova, N., and Semiletov, I.: Sonar gas flux estimation by bubble insonification: application to methane bubble flux from seep areas in the outer Laptev Sea, The Cryosphere, 11, 1333-1350, https://doi.org/10.5194/tc-11-1333-2017, 2017.

The paper is available in PDF HERE

Natalia Shakhova appeared in the following video about a month ago


Methane takes the quick way out - 

Here is another paper published this month

K. Andreassen1,*, A. Hubbard1, M. Winsborrow1, H. Patton1, S. Vadakkepuliyambatta1, A. Plaza-Faverola1, E. Gudlaugsson1, P. Serov1, A. Deryabin2, R. Mattingsdal2, J. Mienert1, S. Bünz1
2 June, 2017

Methane takes the quick way out

Accounting for all the sources and sinks of methane is important for determining its concentration in the atmosphere. Andreassen et al. found evidence of large craters embedded within methane-leaking subglacial sediments in the Barents Sea, Norway. 
They propose that the thinning of the ice sheet at the end of recent glacial cycles decreased the pressure on pockets of hydrates buried in the seafloor, resulting in explosive blow-outs. 
This created the giant craters and released large quantities of methane into the water above.
Science, this issue p. 948

Abstract

Widespread methane release from thawing Arctic gas hydrates is a major concern, yet the processes, sources, and fluxes involved remain unconstrained. 
We present geophysical data documenting a cluster of kilometer-wide craters and mounds from the Barents Sea floor associated with large-scale methane expulsion. 
Combined with ice sheet/gas hydrate modeling, our results indicate that during glaciation, natural gas migrated from underlying hydrocarbon reservoirs and was sequestered extensively as subglacial gas hydrates. 
Upon ice sheet retreat, methane from this hydrate reservoir concentrated in massive mounds before being abruptly released to form craters. We propose that these processes were likely widespread across past glaciated petroleum provinces and that they also provide an analog for the potential future destabilization of subglacial gas hydrate reservoirs beneath contemporary ice sheets.


Thursday, 20 April 2017

Methane gas bubbles under permafrost

7,000 massive methane gas bubbles under the Russian permafrost could explode anytime

Scorching March brings Arctic temperatures up to 20°F warmer than normal.


17 April, 2017

This discovery is especially worrisome for three reasons. First, methane traps 86 times as much heat as CO2 over a 20-year period. Thawing permafrost creates both CO2 and methane (CH4), but most models of thawing permafrost assume only CO2 is created. If, as it appears, a lot of methane is being generated, then we’ll see even more extra warming than scientists have projected.
Second, a recent study found global warming will defrost much more permafrost than we thought.Third, the permafrost has already been warming at an alarming rate. In general, the Arctic warms twice as fast as the planet as a whole.
Last summer saw “an abnormally warm summer in 2016 on the Yamal peninsula” of Siberia where many of these bubbles have been found, notedthe Russian Academy.
But in March, Siberia again saw stunning temperatures, according to NASA’s latest monthly report. Globally, it was the second hottest March on record, losing out only to March 2016. Parts of Siberia and the Arctic were as much as 12.1°C (22°F) above the 1951–1980 average.
Finally, you may be wondering if the United States has any of these methane land mines, what are called “exploding” or “alternative” pingos. (A regular pingo is “mound of earth-covered ice,” so they don’t generally explode.)
Vladimir E. Romanovsky, a permafrost decay expert at the University of Alaska in Fairbanks, told the Washington Post that the methane-filled alternate pingos are “definitely related to warming,” and could appear in Canada or Alaska.
It is just a matter of time when some of those craters appear in North America as well,” Romanovsky said. Already, several pingos have emerged “right under the Alaskan pipeline,” the scientist said. If one of those bulges turned out to be an alternative pingo, that’s not good news, either


Wednesday, 5 April 2017

Abrupt climate change - 04/04/2017

The Gulf Stream is heating up as the 2017 El Niño strengthens


The Gulf Stream is heating up as the 2017 El Niño strengthens, fueled by record low global sea ice extent, which means a lot of extra heat is getting absorbed globally.


Over the next half year, increasingly warm waters will be carried by the Gulf Stream from the coast of North America to the Arctic Ocean.

As this warmer water arrives in the Arctic Ocean, there will no longer be the buffer of sea ice there to consume the heat, as was common for the past thousands of years and more. Additionally, warmer water looks set to arrive in an Arctic Ocean heated up like we've never seen before, as so much of the sunlight reaching the surface of the Arctic Ocean doesn't get reflected back into space anymore.

Where can all this extra heat go? Sea ice will start sealing off much of the surface of the Arctic Ocean by the end of September 2017, making it hard for more heat to enter the atmosphere. The extremely dangerous situation is that it looks like much of the extra heat will instead reach sediments at the seafloor of the Arctic Ocean that contain huge amounts of methane in currently still frozen hydrates.


Arctic Sea ice is breaking up and flowing through Bering Strait


Arctic Sea Ice 04 02 2017. While the "flock" has been squabbling, Bering Sea ice has been breaking up and Arctic Sea ice is breaking up. Arctic Sea ice is flowing through the Bering Strait, almost unnoticed.

Here we go again - first state of emergency of new wildfire season


Within five hours today, the area swept by the raging fires expanded by one and a half times, reaching more than 2,000 hectares.

The weather in the Siberian region is dry, warm and windy.

The local Ministry of Natural Resources reported 20 epicentres of wildfires.

323 firefighters were involved, and 66 units of equipmentdeployed to stop the fires.

A state of emergency was declared in Chitinsky and Khiloksky districts of the region

So Far, 2017 is in the Running to be the 4th Consecutive Hottest Year on Record


We haven’t quite gotten to the global ‘year without a winter’ yet. But it sure looks like we’re heading in that direction –fast.

Due to the highest volume of heat-trapping gasses hitting the Earth’s atmosphere in all of the past 4-15 million years combining with a warming of Pacific Ocean surface waters, the period of 2014 through 2016 saw an unprecedented three consecutive record hot years. With Pacific Ocean waters cooling during late 2016, it appeared that 2017 would become ‘just’ the 2nd to 5th hottest year ever recorded. But that was before the waters off South America’s west coast began to blaze with unexpected heat during early 2017 even as temperatures at the poles climbed to surprisingly warm levels.....


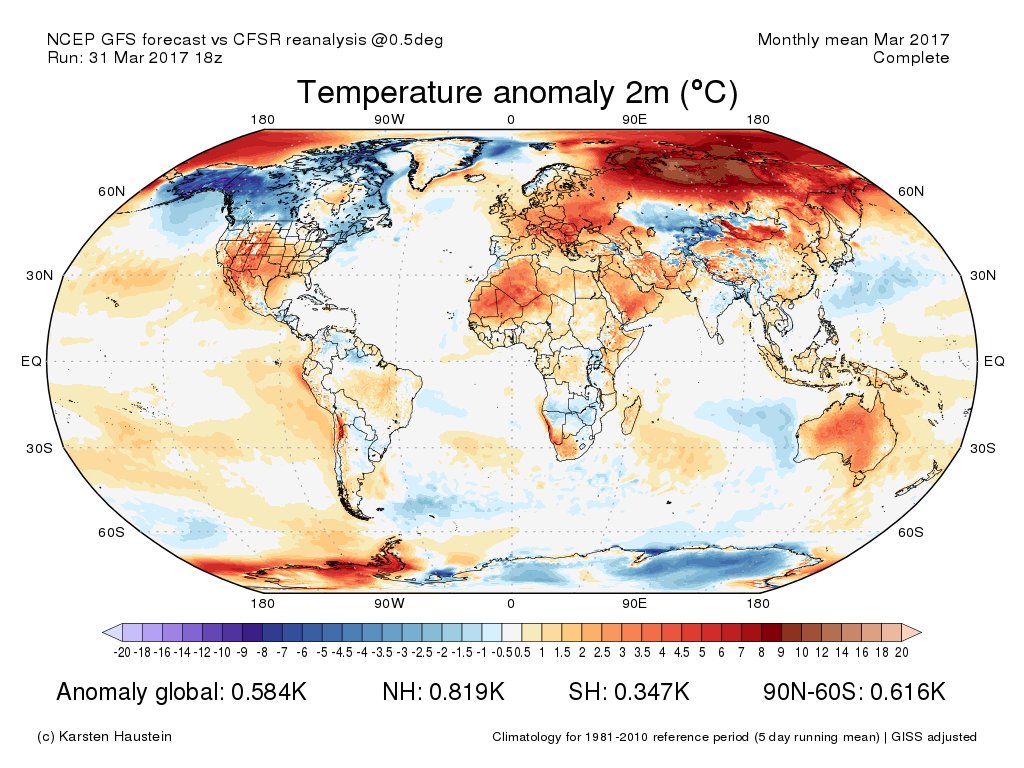
Looking ahead, early indications are that March was also around 1.3 C hotter than 1880s. If a first or second hottest March on record pans out as indicated by early NCEP and GFS model reanalysis, then the first three months of 2017 will come in nearly 0.1 C hotter than all of last year.

Both, March GFS analysis & NCEP reanalysis 0.03K warmer than Feb. Corresponds to +1.07K in Easily 2nd warmest March

During the present human-forced warming trend, it has tended to take about ten years for a global temperature increase of 0.15 degrees Celsius to occur. And that rate of warming is about 30 times faster than the warming that occurred at the end of the last ice age. Since 2013, the world has warmed 0.25 C — which could jump to 0.3 to 0.35 C in the period of 2013 to 2017 if the present trend for this year continues.


Southeast England, which includes the capital, had the warmest month since records began in 1910, according to the U.K.’s Met Office. The average temperature of 9.2 degrees Celsius (49 degrees Fahrenheit) equaled a record set in 1957, the year the Soviet Union launched Sputnik 1, the first human-made object in space. The U.K. overall had its fifth-warmest March on record.

The trend is supposed to continue into April across the whole of Europe, according to meteorologists surveyed by Bloomberg. An early start to summer could raise the risk of drought and further reduce heat and power prices, which have plunged since February.

April “is looking very dry across Iberia,” said Claire Kennedy-Edwards, a senior meteorologist at Atlanta-based The Weather Co. “Very dry springtime conditions over Iberia, resulting in soil moisture deficits, can lead to a greater risk of heat wave events over Europe.”


March was 1.8 degrees Celsius (3.2 Fahrenheit) warmer than average, according to the Met Office. It was also unusually bright, with 21 percent more hours of sunshine than usual. Precipitation was near normal levels except in Wales, where 164.7 millimeters (6.5 inches) of rain fell, 141 percent of the seasonal norm.


For Colombia, The Rain Bombs of Climate Change Fell in the Dark of Night


As the lower atmosphere becomes warmer, evaporation rates will increase, resulting in an increase in the amount of moisture circulating throughout the troposphere (lower atmosphere). An observed consequence of higher water vapor concentrations is the increased frequency of intense precipitation events… — NASA’s Earth Observatory
******
Just off the coasts of Colombia, Ecuador and Peru, the Pacific Ocean has been abnormally warm of-late. For the past month, sea surface temperatures have ranged between 3 and 5 degrees Celsius above average. This excess heating of the ocean surface, facilitated by human-forced climate change, has pumped a prodigious volume of moisture into the atmosphere of this coastal region. Southerly winds running along the western edge of South America have drawn this moisture north and eastward — feeding into the prevailing storms that originate on the Atlantic side of South America and track eastwards.
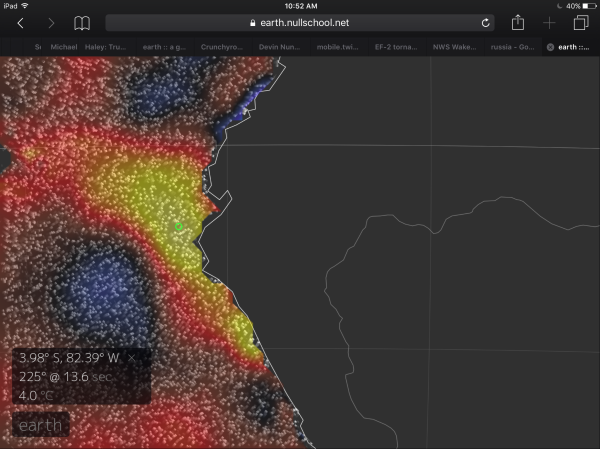
(Sea surface temperature anomaly map from Earth Nullschool shows 4 degree Celsius above average ocean surfaces just off-shore of Ecuadore and Colombia. These extremely warm waters have helped to fuel very severe storms over Peru and Colombia during recent weeks. Such warm ocean waters are not normal and their highest peak temperatures are being increased by a human-forced warming of the Earth, primarily through fossil fuel burning. Image source: Earth Nullschool.)

Lately, these systems have blown up to enormous size as they’ve run across the Andes or collided with pop-up storms along the coast. And the amount of rainfall coming out of the resulting monster thunderstorms has been devastating. In Peru, hundreds of thousands of people have been rendered homeless by these deluges which have caused the tragic loss of 100 souls, destroyed thousands of buildings, 200 bridges, and 2,000 miles of highway. For the state, the estimated damage toll from this ongoing climate disaster is now 6 billion dollars.

Friday night, a member of this new breed of monster thunderstorms, pumped to greater intensity by the moisture bleed off the record warm ocean waters, unloaded a total of a half-month’s worth of rainfall in just a few hours upon the small Colombian city of Mocoa. More than five inches fell in 1-2 hours on a region where three rivers run out of the mountains toward this community of 40,000. The deluge arrived in the darkness. Its ferocious intensity unleashed a massive flood of boulders, mud, and water as the combined rivers leapt their banks and invaded the town. A nearby hillside, unable to retain integrity beneath this merciless assault of the elements, gave way — burying a large section of Macoa in rubble......


Himalayan Melt 1984 to 2016