Showing posts with label el- Nino. Show all posts

Tuesday, 20 June 2017

May was the second hottest on record

World Climate Stays in Uncharted Territory as May of 2017 Hits Second Hottest on Record


19 June, 2017

We’re currently in what should be a relatively considerable temperature trough following a strong 2015-2017 El Nino. But the globe hasn’t really cooled off that much.

In contrast, during the two year period following the 1998 super El Nino, annual global temperature averages subsequently cooled by around 0.2 C to about 0.64 C warmer than 1880s averages as a strong La Nina swept in. This post El Nino cooling provided some respite from harmful global conditions like increasingly prevalent droughts, floods, fires and coral bleaching events set off by the 1998 temperature spike. It did not, however, return the world to anything close to average or normal temperature conditions.
Warming Out of Context

(So far, 2017 temperature averages for the first five months have remained disturbingly close to what should have been an El Nino driven peak in 2016. Temperatures remaining so warm post El Nino are providing little respite from this peak warming. Meanwhile, the longer La Nina conditions hold off, the more extreme and out of context the post-2013 period looks from a global weather/climate perspective even relative to the significant warming occurring from the late 1970s through the early 2010s. Note the steep temperature spike following 2013 in the graph above. This should flatten out, step-wise, as La Nina conditions ultimately push against the larger surface warming trend [driven primarily by fossil fuel burning]. We thus await La Nina with baited breath… Image source: NASA.)

During 2015 and 2016, the world was forced to warm much more intensely than during the 1998 event as very high and rising greenhouse gas concentrations (400 ppm CO2 +) met with another strong El Nino and what appeared to be a very widespread ocean surface warming event. Temperatures peaked to a troubling 1.2 C hotter than 1880s averages during 2016. An annual peak nearly 0.4 C warmer than the 1998 temperature spike. But unlike the period following the 1998 event, it appears that 2017 will probably only back off by about 0.1 degrees Celsius at most.

This counter-trend cooling delay is cause for some concern because a larger portion of the global surface heat added in during the 2015-2016 El Nino appears to be remaining in the climate system — which is lengthening some of the impacts of the 2015-2016 temperature spike and putting the world more firmly outside of the weather and climate contexts of the 19th and 20th Centuries.
(2017 temperatures aren’t trailing too far behind 2016’s record spike. A trend that is, so far, considerably warmer than 2015, which was the second hottest year on record. Image source:NASA.)

Record heat, drought, rainfall events, unusual storms, coral bleaching, glacial melt, wildfires, sea ice melt and other effects related to extreme global temperature will, therefore, not abate as much as some would have hoped. Furthermore, though current science does not appear to identify a present perturbation in the ENSO cycle (which may produce more El Ninos as the world warms), monitoring of that cycle for warming-related change at this time seems at least somewhat appropriate.
Second Hottest May on Record

According to NASA, May of 2017 was 0.88 degrees Celsius hotter than its 20th Century baseline — or 1.1 C warmer than 1880s averages when the world first began a considerable warming trend clearly attributable to fossil fuel burning and related human carbon emissions. This reading is just 0.05 C shy of the record warmest May of 2016. It’s also slightly warmer than the now third warmest May (0.01 C warmer) of 2014. And all of the top four warmest Mays in the present NASA record have now occurred since 2014.
(NASA’s second hottest May on record brought above normal temperatures to much of the globe. Disturbingly, the most extreme temperature departures above average occurred in the vulnerable Coastal regions of Antarctica. Small regions including parts of the North Pacific, the Northern Polar Region, the extreme South Atlantic, and the Central U.S. experienced below average temperatures. But these outliers were few and far between. Image source:NASA.)

Add May of 2017 into the present 2017 running average and you get a total of 1.19 C warmer than 1880s conditions. This is the second warmest first five months on record following 2016 at a very considerable 1.38 C above 1880s. It is, however, just about 0.01 C behind 2016’s annual average of 1.2 C above late 19th Century global temperatures.

It’s worth noting that most of the temperature spike attributable to the 2015-2016 El Nino occurred beginning in October of 2015 and ending in April of 2016. Somewhat milder months comparable to April and May 2017 averages followed from June through December of 2016. So a continuation of present trends could leave 2017 rather close to the 2016 spike.
Forecast Trends

GFS model guidance for June shows somewhat cooler global conditions than in May. If this trend continues we will likely see the month range from 0.7 to 0.82 C above NASA’s baseline. If the GFS summary is accurate and this meta-analysis is correct, then June of 2017 will likely range between 1st and 4th warmest on record. Meanwhile, ENSO (El Nino Southern Oscillation) neutral conditions should tend to keep 2017 as a whole in the range of 1.07 C to 1.2 C hotter than 1880s averages — beating out 2015 as the second hottest year on record and keeping the globe in what basically amounts to uncharted climate territory.
Links:


Tuesday, 1 September 2015

The Dying Earth - 08/31/2015

Three Category 4 Hurricanes in the Pacific Ocean: How Rare Is That?

Hurricanes Kilo, Ignacio and Jemina in the Pacific Ocean on August 30, 2015.

30 August, 2015


A very rare meteorological event occurred Saturday evening into early Sunday morning when three Category 4 hurricanes were ongoing simultaneously in the Pacific Ocean.

At 11 p.m. EDT Saturday, Huricane Kilo (135 mph) was located well southwest of the Hawaiian Islands followed by Hurricane Ignacio (140 mph) to the east of Hawaii and Hurricane Jimena (140 mph) in the eastern Pacific. Kilo was the last of the trio to reach Category 4 status, doing so on Saturday evening. For reference, hurricanes with maximum sustained winds of 130-156 mph are classified as Category 4, which is the second highest category on the Saffir-Simpson Hurricane Wind Sale.

However, by 5 p.m. EDT Sunday both Kilo and Ignacio had begun to weaken and were classified as Category 3 hurricanes, while Jimena maintained its Category 4 status.

This is the first recorded occurrence of three Category 4 hurricanes in the central and eastern Pacific basins at the same time. In addition, it's also the first time with three major hurricanes (Category 3 or stronger) in those basins simultaneously, according to hurricane specialist Eric Blake of the National Hurricane Center.

This satellite image shows the three Category 4 hurricanes in the Pacific Sunday morning (Kilo - left, Ignacio - center, Jimena - right).


Three Category 4 hurricanes on Sunday morning in the Pacific. Kilo (left), Ignacio (center) and Jimena (right).  (NASA)

Dr. Phil Klotzbach of Colorado State University and blogger for wunderground.com said in a tweet on Saturday that this was also the first time the central Pacific, bounded by the International Date Line and 140 degrees west longitude, has had two major hurricanes (Kilo and Ignacio) ongoing at the same time. This piles on to what has already been a record hurricane season in the central Pacific basin.


Blake said on Aug. 21 that Loke was the record fifth named storm to form in the central Pacific basin this season. The others were Ela, Halola, Iune and Kilo. In addition, three eastern Pacific storms have tracked through the basin, including Guillermo, Hilda and Ignacio. 

NOAA's 2015 Central Pacific hurricane season outlook cited El Nino's tendency for reduced wind shear and more storm tracks coming from the eastern Pacific as reasons to expect an active season in the central Pacific Bain.

The Pacific tropical activity can be attributed, in part, to impressively warm ocean water.

El Nino is an anomalous, yet periodic, warming of the central and eastern equatorial Pacific Ocean. For reasons still not well understood, every 2 to 7 years, this patch of ocean warms for a period of 6 to 18 months.

The eastern Pacific basin also typically sees an increase in named storms during a moderate to strong El Nino thanks to diminished vertical wind shear.

The opposite is true in the Atlantic basin, since wind shear tends to increase in a moderate to strong El Nino, particularly in the Caribbean Sea.

Hurricane Igor is featured in this Sept. 14, 2010, image photographed by an Expedition 24 crew member on the International Space Station. (NASA) 


Godzilla Rises. Stunning El Nino Forecasts are Literally Off the Chart


25 August, 2015


enso_plume0815

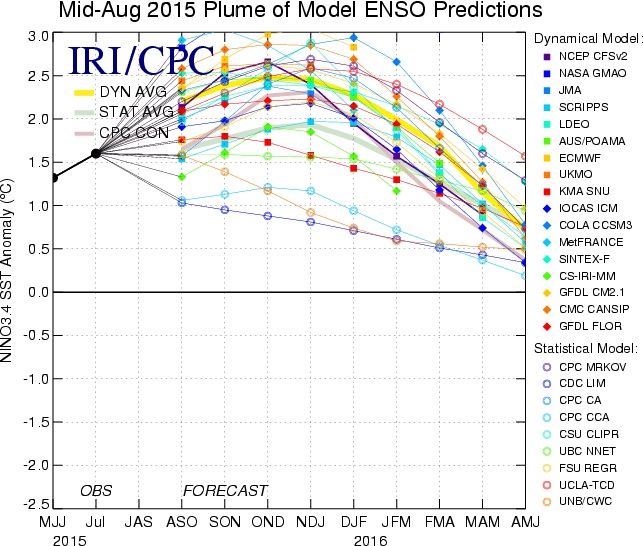
Above, NOAA has published a graph of modeling predictions from various professional groups looking at the developing El Nino event in the Pacific.
The dark line that starts at the left is actual observations of what we see so far in unusually warm surface water in the central and eastern pacific.  The various colored lines that proceed to the right are the different attempts at predictions. As you can see, they are running hot – very hot, to the point of sailing off the top of the chart…

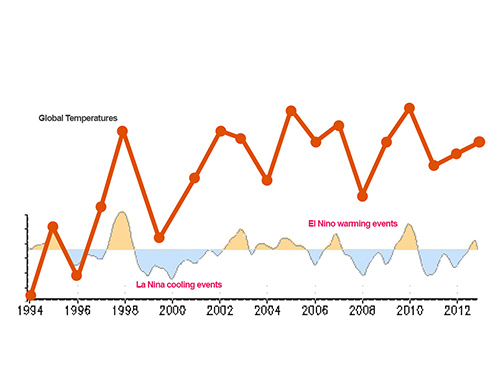
As you can see from this diagram, global temperatures tend to get a bounce in El Nino years, while La Nina years exert a cooling influence.
EL NIÑO is Spanish for…The Niño!” joked Chris Farley on a 1997 episode of Saturday Night Live, a sketch comedy programme. The skit was memorable for its absurdity but it did not do much to explain “The Niño”. It aired during the devastating 1997-1998 El Niño, which caused at least $35 billion in destruction and 23,000 deaths globally. A new El Niño is now brewing. NASA satellite pictures indicate this year’s could be even bigger than the 1997-1998 one, the strongest on record. So what is El Niño?
godzillarises
Spanish for “little boy”, El Niño was so named by Peruvian fishermen in the 1600s in honour of the Christ child. They observed that periodically around Christmastime, Pacific waters grew warmer and fish vanished, migrating to cooler waters. Unlike hurricanes, El Niño is not an individual weather event, it is a climate pattern. In non-Niño years trade winds, which blow east to west, push warm equatorial water into the western Pacific, allowing cold water from the deep ocean to well up in the eastern Pacific. During a Niño, those winds slacken. The warm water that is normally pushed westward pools right across the Pacific Ocean. Water temperature increases, and increased heat and moisture rise into the atmosphere, altering wind and storm patterns. If ocean-surface temperatures are between 0.5 to 1°C above average during a three-month window, America’s National Oceanic and Atmospheric Administration (NOAA), a federal agency, deems it a Niño. The current one could produce temperatures 2°C higher than average, or more.


sst_anom0815


Dahr Jamail has written his latest on abrupt climate change.


The World on Fire: Record-Breaking Wildfires, Greenland Melting and Earth's Hottest Month Ever


A massive wall of wildfire smoke, blowing in from record-breaking fires in Eastern Washington, covers Puget Sound and Seattle. (Photo: Dahr Jamail)
A massive wall of wildfire smoke, blowing in from record-breaking fires in eastern Washington State, covers Puget Sound and Seattle. (Photo: Dahr Jamail)

When I go up into the mountains, I'm used to being afforded magnificent views of alpine meadows filled with wildflowers, crystal-clear mountain streams, glaciers tucked under the shoulders of high valleys, stratified ridges arcing into the sky, and views so far into the distance one can sense the curvature of earth.
But on August 22, as I carefully climbed my way toward one of the high summits of Eastern Olympic National Park, the solace of the mountains eluded me due to an ominous sign. The view east - toward what has now officially become the largest complex of wildfires in history for Washington State, where over one-quarter million acres have burned - was dominated by a large, greyish-white plume of smoke that stretched as far north and south as I could see.
At first it appeared as a large storm cloud layer, which was confusing given that the weather-folk had called for a stable high-pressure ridge over western Washington through the weekend. But as I continued through the morning, the large white wall neared and slowly began enveloping the entire eastern mountains of the Olympics, and my eyes began to burn as I smelled the smoke.
By the time I reached the summit of my climb, the view south was already obscured by the smoke as it began to fully infiltrate Olympic National Park

For rest of the article GO HERE

Smoke from West coast fires


Unprecedented.

Drifting wildfire smoke from the West coast states, covers the Midwest today, from Hudson Bay in northern Canada, all the way through the Midwest to the Gulf of Mexico.


Arctic Ocean 08 31 2015. 


Storm approaching is visible in the upper left hand corner

Western Wildfire Smoke Has Drifted Over the Atlantic

Terra image of wildfire smoke over the Atlantic

Smoke from the treacherous western wildfires of both the U.S. and Canada has wafted across country and out to sea.  In this natural-color satellite image collected by the Moderate Resolution Imaging Spectroradiometer (MODIS) aboard the Terra satellite on August 29, 2015, remnants of the smoke are swirling out above the Atlantic Ocean.  Prince Edward Island can be seen in this image as well as New Brunswick and Nova Scotia.

NASA image courtesy Jeff Schmaltz, MODIS Rapid Response Team. Caption: NASA/Goddard, Lynn Jenner


Arctic sea ice extent on August 28, 2015, was less than 5 million square km


Midday on Lake Baikal – like sunrise on the planet Crematorium

Полдень на БАЙКАЛЕ, как восход на планете Крематория.


Volunteers save lake Baikal from the fire: "the scale of the disaster is enormous, burning everything!"


Hurricane Fred hits Cape Verde islands


A hurricane with winds of up to 140km/h (85mph) has hit the island nation of Cape Verde, off the coast of West Africa


Friday, 17 July 2015

Typhoon Nangka hits Japan

Hot Ocean Hurls Nangka’s 1 Meter Rains At Japan; Storm Chases Arctic Heat Delivery Later This Week

This week, a screaming hot Pacific basin hurled six tropical cyclones northward.

16 July, 2015

These cyclones spawned off the back of a building monster El Nino which is predicted to reach strong-to-record intensity by later this year. They also contributed to setting a record for number of cyclones formed in the Northern Hemisphere so early in the year. In the Western Pacific, one of these Cyclones — Typhoon Chan Hom — slammed into Shanghai on July 10th and 11th, delivering high waters, high winds and floods.

Now, another cyclone — Typhoon Nangka — is venting its fury on Japan.
Nangka bears down on Japan
(Nangka takes aim on Japan in this MODIS satellite shot. Image source: LANCE-MODIS.)

A few hours ago, Nangka made landfall near Muroto City. Over the past 24 hours, Nangka had weakened from a category 3 storm packing 115 mile per hour intensity, blustering ashore as a minimal Typhoon with 75 mile per hour maximum sustained winds. Nangka is interacting with a frontal boundary, which interfered with the storm’s circulation even as it injected massive amounts of moisture into Nangka’s encircling thunderstorms. This increased moisture loading — likely also enhanced by global temperatures that are now in the range of 1 C hotter than 1880s averages together with moisture bleeding off an anomalously warm Pacific — is resulting in forecasts for up to 1 meter of rainfall as Nangka continues to churn over Japan.

Nangka’s eyewall and strong south to north winds are running smack into Japan’s ocean facing mountains. The combined high moisture loading and the lifting action of winds running up the mountains are pumping up Nangka’s thunderstorms to extraordinary intensity. Weather radar from earlier today showed hourly rainfall rates peaking at an extreme 3.15 inches per hour near Shikoku. There, after hours of this intense pounding, rainfall totals have hit as high as 23 inches (UPDATE: Kamikitayama village had reported 27 inches of total rainfall as of 5:20 AM local time.)

These heavy rains are expected to continue for the next 24-48 hours with very severe additional totals predicted for a number of regions. Expected new rainfall amounts include:
  • Kinki and Tōkai: 600 millimeters (~24 inches)
  • Shikoku island: 600 millimeters (31 inches)
  • Kantō region: 400 to 500 millimeters (16 to 20 inches)
  • Chūgoku region: 300 to 450 millimeters (12 to 16 inches)
  • Tōhoku region: 250 to 350 millimeters (10 to 14 inches)
Extraordinary additional rains that will bring with them the risk of severe flash flooding and landslides to the mountainous slopes of Japan.
Nangka At Tail End of Warm, Wet Wind Invasion of Arctic Later This Week
As Nangka continues northward, it will become wrapped up in a trough, helping to feed a larger synoptic pattern of moisture and air flow from south to north. The trough, in turn, is projected to rush northward into the Bering Sea. By Monday, a dipole pattern set up between the trough running through the Bering and the Ridiculously Resilient Ridge to the east will pull warm air up from the tropical Pacific and catapult it toward the already weakened ice of the Bering, Chukchi and Beaufort seas.
image
(Long wave north to south synoptic pattern projected to draw warm air and water into the Pacific side of the Arctic over the next 3-6 days. Image source: Earth Nullschool.)

In the above image from Earth Nullschool and based on GFS models, we can see the strong south to north synoptic wind pattern predicted to set up. Flowing from a region near Hawaii, these winds are predicted to pull tropical airs over thousands of miles, run them up through the Bering and into the High Arctic.
In conjunction with this warm air invasion, a head of hot water now at a +5 C positive anomaly in the Chukchi will be driven northward running directly into highly fractured and disassociated ice floes. It’s a weather pattern that is a continuation of consistent warmth hitting the sea ice on the Pacific side of the Arctic. One that is driven both by El Nino and by a human greenhouse gas based amplification of heat in the polar zones. This combination has generated a kind of Achilles heel for Arctic sea ice on the Pacific side for 2015. With another hit coming to this area and with sea ice already in a somewhat tenuous state due to the continued impacts of warm air near Greenland, a Greenland high and a related dipole continuing to nudge the ice toward the Fram Strait, risks rise that current sea ice measures ranging at 4th lowest in area and 7-9th lowest in extent could take a further tumble.
Links:
Hat tip to Greg


Wednesday, 15 July 2015

June, 2015 the warmest on record

The Hothouse Yet Worsens — Japan Meteorological Agency Shows June of 2015 Was Warmest on Record

14 July, 2014

The global June temperature measures are starting to come in and indications are that this past month was a brutally hot east.

According to Japan’s Meteorological Agency, June beat previous all-time hot temperatures of 0.68 C above the 20th Century average set just last year (2014) by 0.08 C. Coming in at 0.76 C above the global 20th Century average and about 0.96 C above 1880s values, this past June was the hottest since Japan began taking measures in 1891. By comparison, El Nino years 2010 and 1998 came in as tied for third hottest at 0.51 C above 20th Century average levels respectively.

June 2015 hottest on record
(Severe global heat during 2015 continues with a record hot June. Image source: Japan Meteorological Agency.)

As we can clearly see in the Japan measure, June-to-June temperatures show a steady increase from 1890 onward with most recent years warming substantially above trend line. A visible pace of warming directly at odds with recent false rumors of a global warming ‘hiatus.’ Meanwhile, the nearly 1 C worth of global warming since record keeping began in 1891 has proceeded at a pace roughly 25 times faster than the warming that occurred at the end of the last ice age.

Record June heat caps off a record hot first half of 2015 amidst a still strengthening El Nino in the Equatorial Pacific as well as numerous heat-related weather events across the globe. In the US, a continuation of a severe western drought drove Lake Mead below the rationing line for the first time in its history. California extended extreme drought conditions and a record fire outbreak consumed more than 2 million acres of forest, tundra and permafrost in Alaska. In South America, water rationing continued in Brazil’s most populous city of Sao Paulo as severe drought conditions pervaded over much of South America, Central America and the Caribbean. In India and Pakistan severe heat and humidity pushed wet bulb temperatures to dangerous levels — setting off two mass casualty events that left thousands dead and tens of thousands hospitalized. Northern Hemisphere sea ice hit third lowest extent on record and an odd blob of hot water in the Northeastern Pacific continued to harm marine life as waters grew more stratified and toxic due to heat-related causes.


image
(Very hot temperature anomalies throughout the Eastern Pacific running from Equator to Northern Hemisphere Pole were a major contributor to record-breaking global heat during June. Still warming waters in the Equatorial zone are likely to pump still more heat into an atmosphere overburdened with human greenhouse gas emissions through at least early 2016. Image source: Earth Nullschool.)

So far, with El Nino still building and with global CO2 levels rising to a record 404 parts per million in May, 2015 is leading 2014 as the hottest year on record by a significant 0.07 to 0.1 C margin. Substantial westerly wind bursts during late June and through mid July have increased the likelihood that the 2015 El Nino will be a strong to record-breaking event — backing still more ocean warmth into an already over-heated atmosphere. As such, there is a strong potential that record warm global readings will maintain current intensity or even worsen through to the end of this year.

Links:


Hat tip to Wili