If
you want some real analysis rather than some half-baked opinions that
you find on Facebook then read this.
Deflationary
Collapse Ahead?
26
August, 2015
Both
the stock market and oil prices have been plunging. Is this “just
another cycle,” or is it something much worse? I think it is
something much worse.
Back
in January, I wrote a post called Oil
and the Economy: Where are We Headed in 2015-16? In
it, I said that persistent very low prices could be a sign that we
are reaching limits of a finite world.
In fact, the scenario that is playing out matches up with what I
expected to happen in my January post. In that post, I said
Needless to say, stagnating wages together with rapidly rising costs of oil production leads to a mismatch between:
The amount consumers can afford for oil
The cost of oil, if oil price matches the cost of production
This
mismatch between rising costs of oil production and stagnating wages
is what has been happening. The unaffordability problem can be hidden
by a rising amount of debt for a while (since adding cheap debt helps
make unaffordable big items seem affordable), but this scheme cannot
go on forever.
Eventually,
even at near zero interest rates, the amount of debt becomes too
high, relative to income. Governments become afraid of adding more
debt. Young people find student loans so burdensome that they put off
buying homes and cars. The economic “pump” that used to result
from rising wages and rising debt slows, slowing the growth of the
world economy. With slow economic growth comes low demand for
commodities that are used to make homes, cars, factories, and other
goods. This slow economic growth is what brings the persistent trend
toward low commodity prices experienced in recent years.
A
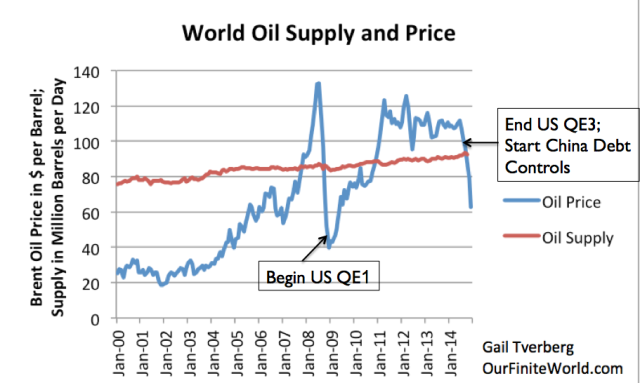
chart I showed in my January post was this one:
Figure
1. World Oil Supply (production including biofuels, natural gas
liquids) and Brent monthly average spot prices, based on EIA data.
The
price of oil dropped dramatically in the latter half of 2008, partly
because of the adverse impact high oil prices had on the economy, and
partly because of a contraction in debt amounts at that time. It
was only when banks were bailed out and the United States began its
first round of Quantitative Easing (QE) to get longer term interest
rates down even further that energy prices began to rise.
Furthermore, China ramped up its debt in this time period, using its
additional debt to build new homes, roads, and factories. This also
helped pump energy prices back up again.
The
price of oil was trending slightly downward between 2011 and 2014,
suggesting that even then, prices were subject to an underlying
downward trend. In mid-2014, there was a big downdraft in prices,
which coincided with the end of US QE3 and with slower growth in debt
in China. Prices rose for a time, but have recently dropped again,
related to slowing Chinese, and thus world, economic growth. In part,
China’s slowdown is occurring because it has reached limits
regarding how many homes, roads and factories it needs.
I
gave a list of likely changes to expect in my January
post.
These haven’t changed. I won’t repeat them all here. Instead, I
will give an overview of what is going wrong and offer some thoughts
regarding why others are not pointing out this same problem.
Overview
of What is Going Wrong
- The big thing that is happening is that the world financial system is likely to collapse. Back in 2008, the world financial system almost collapsed. This time, our chances of avoiding collapse are very lim.
- Without the financial system, pretty much nothing else works: the oil extraction system, the electricity delivery system, the pension system, the ability of the stock market to hold its value. The change we are encountering is similar to losing the operating system on a computer, or unplugging a refrigerator from the wall.
- We don’t know how fast things will unravel, but things are likely to be quite different in as short a time as a year. World financial leaders are likely to “pull out the stops,” trying to keep things together. A big part of our problem is too much debt. This is hard to fix, because reducing debt reduces demand and makes commodity prices fall further. With low prices, production of commodities is likely to fall. For example, food production using fossil fuel inputs is likely to greatly decline over time, as is oil, gas, and coal production.
- The electricity system, as delivered by the grid, is likely to fail in approximately the same timeframe as our oil-based system. Nothing will fail overnight, but it seems highly unlikely that electricity will outlast oil by more than a year or two. All systems are dependent on the financial system. If the oil system cannot pay its workers and get replacement parts because of a collapse in the financial system, the same is likely to be true of the electrical grid system.
- Our economy is a self-organized networked system that continuously dissipates energy, known in physics as a dissipative structure. Other examples of dissipative structures include all plants and animals (including humans) and hurricanes. All of these grow from small beginnings, gradually plateau in size, and eventually collapse and die. We know of a huge number of prior civilizations that have collapsed. This appears to have happened when the return on human labor has fallen too low. This is much like the after-tax wages of non-elite workers falling too low. Wages reflect not only the workers’ own energy (gained from eating food), but any supplemental energy used, such as from draft animals, wind-powered boats, or electricity. Falling median wages, especially of young people, are one of the indications that our economy is headed toward collapse, just like the other economies.
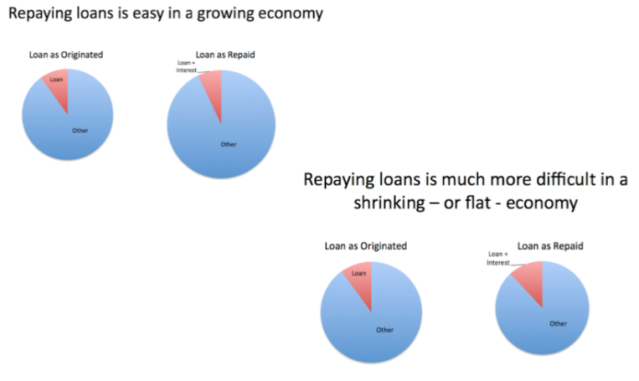
- The reason that collapse happens quickly has to do with debt and derivatives. Our networked economy requires debt in order to extract fossil fuels from the ground and to create renewable energy sources, for several reasons: (a) Producers don’t have to save up as much money in advance, (b) Middle-men making products that use energy products (such cars and refrigerators) can “finance” their factories, so they don’t have to save up as much, (c) Consumers can afford to buy “big-ticket” items like homes and cars, with the use of plans that allow monthly payments, so they don’t have to save up as much, and (d) Most importantly, debt helps raise the price of commodities of all sorts (including oil and electricity), because it allows more customers to afford products that use them. The problem as the economy slows, and as we add more and more debt, is that eventually debt collapses. This happens because the economy fails to grow enough to allow the economy to generate sufficient goods and services to keep the system going–that is, pay adequate wages, even to non-elite workers; pay growing government and corporate overhead; and repay debt with interest, all at the same time. Figure 2 is an illustration of the problem with the debt component.
Figure
2. Repaying loans is easy in a growing economy, but much more
difficult in a shrinking economy.
Where
Did Modeling of Energy and the Economy Go Wrong?
- Today’s general level of understanding about how the economy works, and energy’s relationship to the economy, is dismally low. Economics has generally denied that energy has more than a very indirect relationship to the economy. Since 1800, world population has grown from 1 billion to more than 7 billion, thanks to the use of fossil fuels for increased food production and medicines, among other things. Yet environmentalists often believe that the world economy can somehow continue as today, without fossil fuels. There is a possibility that with a financial crash, we will need to start over, with new local economies based on the use of local resources. In such a scenario, it is doubtful that we can maintain a world population of even 1 billion.
- Economics modeling is based on observations of how the economy worked when we were far from limits of a finite world. The indications from this modeling are not at all generalizable to the situation when we are reaching limits of a finite world. The expectation of economists, based on past situations, is that prices will rise when there is scarcity. This expectation is completely wrong when the basic problem is lack of adequate wages for non-elite workers. When the problem is a lack of wages, workers find it impossible to purchase high-priced goods like homes, cars, and refrigerators. All of these products are created using commodities, so a lack of adequate wages tends to “feed back” through the system as low commodity prices. This is exactly the opposite of what standard economic models predict.
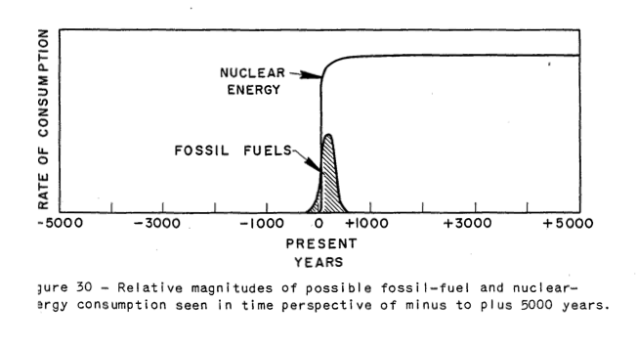
- M. King Hubbert’s “peak oil” analysis provided a best-case scenario that was clearly unrealistic, but it was taken literally by his followers. One of Hubbert’s sources of optimism was to assume that another energy product, such as nuclear, would arise in huge quantity, prior to the time when a decline in fossil fuels would become a problem.
The
way nuclear energy operates in Figure 2 seems to me to be pretty
much equivalent to the output of a perpetual motion machine, adding
an endless amount of cheap energy that can be substituted for fossil
fuels. A related source of optimism has to do with the shape of a
curve that is created by the sum of curves of a given type. There is
no reason to expect that the “total” curve will be of the same
shape as the underlying curves, unless a perfect substitute (that
is, having low price, unlimited quantity, and the ability to work
directly in current devices) is available for what is being
modeled–here fossil fuels. When the amount of extraction is
determined by price, and price can quickly swing from high to low,
there is good reason to believe that the shape of the sum curve will
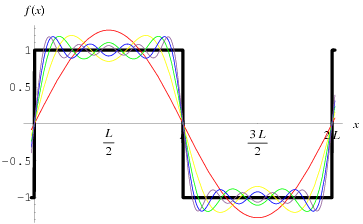
be quite pointed, rather than rounded. For example we know that a
square wave can be approximated using the sum of sine functions,
using Fourier Series (Figure 4).
- The world economy operates on energy flows in a given year, even though most analysts today are accustomed to thinking on a discounted cash flow basis. You and I eat food that was grown very recently. A model of food potentially available in the future is interesting, but it doesn’t satisfy our need for food when we are hungry. Similarly, our vehicles run on oil that has recently been extracted; our electrical system operates on electricity that has been produced, essentially simultaneously. The very close relationship in time between production and consumption of energy products is in sharp contrast to the way the financial system works. It makes promises, such as the availability of bank deposits, the amounts of pension payments, and the continuing value of corporate stocks, far out into the future. When these promises are made, there is no check made that goods and services will actually be available to repay these promises. We end up with a system that has promised very many more goods and services in the future than the real world will actually be able to produce. A break is inevitable; it looks like the break will be happening in the near future.
- Changes in the financial system have huge potential to disrupt the operation of the energy flow system. Demand in a given year comes from a combination of (wages and other income streams in a given year) plus the (change in debt in a given year). Historically, the (change in debt) has been positive. This has helped raise commodity prices. As soon as we start getting large defaults on debt, the (change in debt) component turns negative, and tends to bring down the price of commodities. (Note Point 6 in the previous section.) Once this happens, it is virtually impossible to keep prices up high enough to extract oil, coal and natural gas. This is a major reason why the system tends to crash.
- Researchers are expected to follow in the steps of researchers before them, rather than starting from a basic understudying of the whole problem. Trying to understand the whole problem, rather than simply trying to look at a small segment of a problem is difficult, especially if a researcher is expected to churn out a large number of peer reviewed academic articles each year. Unfortunately, there is a huge amount of research that might have seemed correct when it was written, but which is really wrong, if viewed through a broader lens. Churning out a high volume of articles based on past research tends to simply repeat past errors. This problem is hard to correct, because the field of energy and the economy cuts across many areas of study. It is hard for anyone to understand the full picture.
- In the area of energy and the economy, it is very tempting to tell people what they want to hear. If a researcher doesn’t understand how the system of energy and the economy works, and needs to guess, the guesses that are most likely to be favorably received when it comes time for publication are the ones that say, “All is well. Innovation will save the day.” Or, “Substitution will save the day.” This tends to bias research toward saying, “All is well.” The availability of financial grants on topics that appear hopeful adds to this effect.
- Energy Returned on Energy Investment (EROEI) analysis doesn’t really get to the point of today’s problems. Many people have high hopes for EROEI analysis, and indeed, it does make some progress in figuring out what is happening. But it misses many important points. One of them is that there are many different kinds of EROEI. The kind that matters, in terms of keeping the economy from collapsing, is the return on human labor. This type of EROEI is equivalent to after-tax wages of non-elite workers. This kind of return tends to drop too low if the total quantity of energy being used to leverage human labor is too low. We would expect a drop to occur in the quantity of energy used, if energy prices are too high, or if the quantity of energy products available is restricted.
- Instead of looking at wages of workers, most EROEI analyses consider returns on fossil fuel energy–something that is at least part of the puzzle, but is far from the whole picture. Returns on fossil fuel energy can be done either on a cash flow (energy flow) basis or on a “model” basis, similar to discounted cash flow. The two are not at all equivalent. What the economy needs is cash flow energy now, not modeled energy production in the future. Cash flow analyses probably need to be performed on an industry-wide basis; direct and indirect inputs in a given calendar year would be compared with energy outputs in the same calendar year. Man-made renewables will tend to do badly in such analyses, because considerable energy is used in making them, but the energy provided is primarily modeled future energy production, assuming that the current economy can continue to operate as today–something that seems increasingly unlikely.
- If we are headed for a near term sharp break in the economy, there is no point in trying to add man-made renewables to the electric grid. The whole point of adding man-made renewables is to try to keep what we have today longer. But if the system is collapsing, the whole plan is futile. We end up extracting more coal and oil today, in order to add wind or solar PV to what will soon become a useless grid electric system. The grid system will not last long, because we cannot pay workers and we cannot maintain the grid without a financial system. So if we add man-made renewables, most of what we get is their short-term disadvantages, with few of their hoped-for long-term advantages.
Conclusion
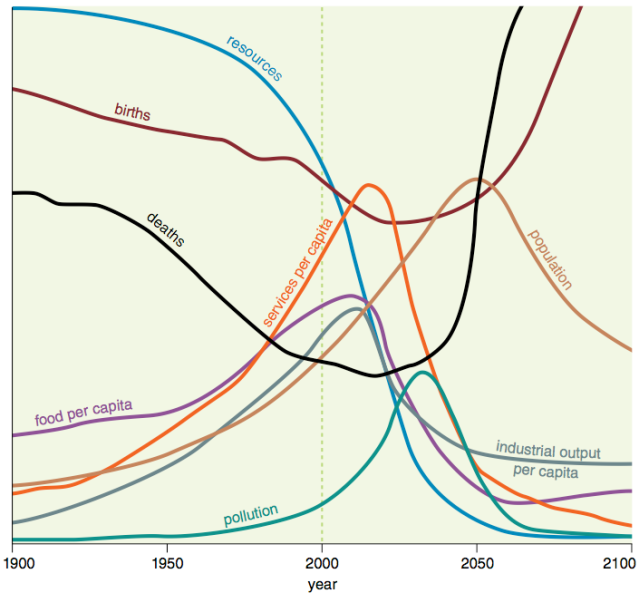
The
analysis that comes closest to the situation we are reaching today is
the 1972 analysis of limits of a finite world, published in the book
“The
Limits to Growth”
by Donella Meadows and others. It models what can be expected to
happen, if population and resource extraction grow as expected,
gradually tapering off as diminishing returns are encountered. The
base model seems to indicate that a collapse will happen about now.
Figure
5. Base scenario from 1972 Limits to Growth, printed using today’s
graphics by Charles Hall and John Day in “Revisiting Limits to
Growth After Peak
Oil” http://www.esf.edu/efb/hall/2009-05Hall0327.pdf
The
shape of the downturn is not likely to be correct in Figure 5. One
reason is that the model was put together based on physical
quantities of goods and people, without considering the role the
financial system, particularly debt, plays. I expect that debt would
tend to make collapse quicker. Also, the modelers had no experience
with interactions in a contracting world economy, so had no idea
regarding what adjustments to make. The authors have even said that
the shapes of the curves, after the initial downturn, cannot be
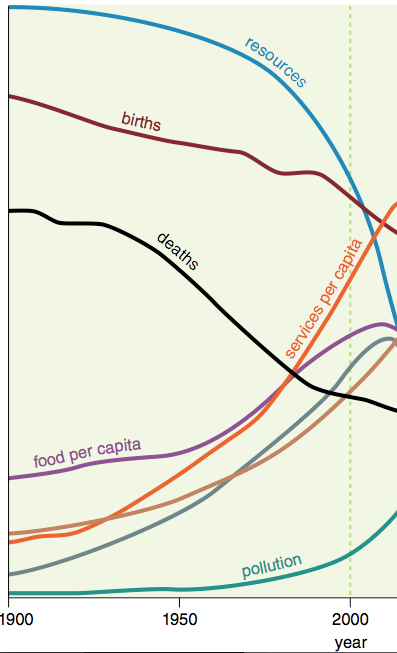
relied on. So we end up with something like Figure 6, as about all
that we can rely on.
Figure
6. Figure 5, truncated shortly after industrial output per capita
(grey) and food per capita turns down, since modeled amounts are
unreliable after that date.
If
we are indeed facing the downturn forecast by Limits
to Growth modeling,
we are facing a predicament that doesn’t have a real
solution. We can make the best of what we have today, and we can try
to strengthen bonds with family and friends. We can try to diversify
our financial resources, so if one bank encounters problems early on,
it won’t be a huge problem. We can perhaps keep a little food and
water on hand, to tide us over a temporary shortage. We can study our
religious beliefs for guidance.
Some
people believe that it is possible for groups of survivalists to
continue, given adequate preparation. This may or may not be true.
The only kind of renewables that we can truly count on for the long
term are those used by our forefathers, such as wood, draft animals,
and wind-driven boats. Anyone who decides to use today’s
technology, such as solar panels and a pump adapted for use with
solar panels, needs to plan for the day when that technology fails.
At that point, hard decisions will need to be made regarding how the
group will live without the technology.
We
can’t say that no one warned us about the predicament we are
facing. Instead, we chose not to listen. Public officials gave a
further push in this direction, by channeling research funds toward
distant theoretically solvable problems, instead of understanding the
true nature of what we are up against. Too many people took what
Hubbert said literally, without understanding that what he offered
was a best-case scenario, if we could find something equivalent to a
perpetual motion machine to help us out of our predicament


Hi Robin. Thanks for your great blog. In terms of financial crisis. I think the "black" swan is the Brazilian drought. It will set in motion a financial collapse that is hard for most people to see. Suppose a major city runs out of water, GDP in Brazil falls precipitously, the leveraged banks collapse, systemic risk in the country arises. There is contagion to other places with similar situations which include the US (California). I think there is no need to elaborate further, but 2008 might be all over again, just substitute housing prices decline with water shortages, and Lehmann with Sao Paulo.
ReplyDelete