Showing posts with label temperature. Show all posts

Saturday, 11 May 2019

Temperatures in upper South Island NZ are up 6 or 7 degrees above "average"

Temperatures in upper South Island NZ are up 6 or 7 degrees above normal and pasture growth's up 30 to 40 percent
The last time we had a "normal" winter in Wellington with frosts was in 2003 (15 years ago).


The media reports the news as if temperatures that are 6 or 7 degrees Centigrade above “average” are not even worth reporting on. Instead we get wishful thinking such as “winter is on its way”.

A farmer in Marlborough says he's in the land of milk and honey... but at the same time he admits it's eerily concerning as temperatures are up 6 or 7 degrees above normal and pasture growth's up 30 to 40 percent. It's not surprising that winter feed crops are looking fantastic as soil temperatures are a warm 12 degrees at 10 centimetres. Rams on lower hill country properties have completed their task. Ewes have gone onto on winter rotation and despite them eating all the grass in front of them it's popping up just as quickly behind. In vineyards pruning's about to get underway.”


https://www.radionz.co.nz/programmes/regional-wrap/story/2018694497/regional-wrap

Thursday, 7 March 2019

What does tthe IPCC leave out of the equations?


HOW MUCH WARMING IS THERE NOW?

Sam Carana, via Facebook

According to NOAA's calculations, we're currently at 500 CO₂e. NOAA adds: 

"Because we seek an index that is accurate, only direct forcing from these gases has been included. Model-dependent feedbacks, for example, due to water vapor and ozone depletion, are not included. Other spatially heterogeneous, short-lived, climate forcing agents, such as aerosols and tropospheric ozone, have uncertain global magnitudes and also are not included here to maintain accuracy."


How much warming do you think there is, when including all feedbacks, indirect effects and further warming elements?

This appeared in comments


No photo description available.

NOAA includes 5 major gases (CO₂, CH₄, N₂O, CFC-12 and CFC-11) and 15 halogenated gases (CFC-113, CCl₄, CH₃CCl₃, HCFCs 22, 141b and 142b, HFCs 134a, 152a, 23, 143a, and 125, SF₆, and halons 1211, 1301 and 2402). 

The figure of 500 CO₂e is arrived at when taking NOAA's column for total CO₂e in Table 2, which goes up to 2017, and extending this by means of a linear trend, as in attached image.

Wednesday, 6 February 2019

January 2019 third hottest on record: 2018 the hottest

January clocks third hottest January ever on record


NZ Herald,

6 February, 2019


Kiwis have been feeling the heat - but last month was only the third hottest January with 2018 still holding the record for the hottest month ever.


The monthly climate summary for January released by the National Institute of Water and Atmospheric Research (Niwa) shows the nationwide average air temperature last month was 18.8C.

But despite Kiwis sweltering and some places experiencing a heatwave at the end of last the week, January 2018 holds the record the country's hottest month since records began in 1909 with an average temperature of 20.3C.

It's certainly been hot with the six main centres - Auckland, Tauranga, Hamilton, Wellington, Christchurch and Dunedin - all recording a mean temperature well above their average.

Niwa Auckland climate scientist Nava Fedaeff said last January was exceptionally warm and broke all records.

"Obviously we've just come out a heat wave so it's certainly been very hot at the end of the month, January last year was actually much hotter - consistently hotter."

Fedaeff said while February was starting off hot there would be a few more "ups and downs" than January.

Likewise Auckland, Tauranga, Hamilton and Wellington all recorded rainfall well below normal.

But some parts of the country cracked their mean air temperature records with Kerikeri (21.3, up 2.2C) , Rotorua (20.1C, up 2.6C), Mahia (20.3C, 2C), Kaikoura (19C, up 2.3C) and Cheviot (19.8C, up 3.1C) all claiming their hottest month ever.

Hanmer Forest in the South Island was the hottest place to be in January with a temperature of 38.4C recorded on 31 January.

"That's actually New Zealand's 18th warmest temperature ever recorded so it was a very hot day."

Maximum January air temperature records were broken in a raft of places including Kerikeri (27.5C, up 3.2C), Kaikohe (25.7C, up 2.8C), Whangārei (26.7C, up 2.2), Whitianga (27.9C, up 4C), Te Puke (26.4C, up 2.8C), Whakatāne (26.7C, up 2.7C), Rotorua (26C, up 3.6C), Takaka (26C, up 3C), Motueka (27C, up 3.7C0, Appleby (25.7C, up 3.3C), Blenheim (27.8C, up 3.6C), Hanmer Forest (27.4C, up 4C), Kaikoura (24C, up 3.6C), Waiau (27.1C, up 2.9C). Cheviot (26.8C, up 3.7C) and Mokohinau (23.8C, up 1.6C).

Appleby and Richmond also recorded the 350 hours of sunshine making it the sunniest month ever recorded in the South Island.

New Plymouth holds the national record with 356 hours of sunshine in January 2015.

Parts of the country were also extremely dry with rainfall well below normal in all parts of the country except Napier and Hastings.

Masterton had just 6mm of rain and recording its driest month on records since its records began in 1926. Cape Reinga also only captured 4mm of rain making it its second driest month since its records began 100 years ago.

Monday, 28 January 2019

Making sense of media coverage of a heatwave

This is the most important fact to come out of this - not the high temperatures.

In Richmond,near Nelson a minimum temperature record of 24.3 degrees Celsius has been set.


A new record for MINIMUM temperature set in Nelson


Temperatures reached 33.8 in Richmond, Nelson today, 3 degrees short of the record

The highest recorded temperature in Nelson is 36.3 °C (97 °F), the lowest −6.6 °C (20 °F).

Temperatures have not got even close to the previous record, set in 1973 in Rangiora.


February 7, 1973 was a stinker – our hottest day ever. That day, eight out of 10 of the hottest temperatures experienced in New Zealand were recorded.

According to Niwa, the top 10, all above 39 degrees Celsius, were mainly recorded in Canterbury. The highest was 42.4C in Rangiora. 
The only top temp that wasn't recorded in Canterbury was the second-highest – 42.3C in Jordan, Marlborough.

In my mind it is not these records but the huge increase in average temperatures that is significant.

Until today (27C) the temperatures in Lower Hutt (from my own measurements) have not exceeded 25 deg C; neither have they gone below 20 deg C except on several isolated occasions.

Last night's minimum was 22 degrees Celsius

Yesterday's average maximum is today's minimum temperature.

Wednesday, 13 June 2018

Another temperature record set in America


The U.S. just had its warmest May in history, blowing past 1934 Dust Bowl record


7 June, 2018

Almost every tract of land in the contiguous United States was warmer than normal in May, helping to break a Dust Bowl-era record.

The month’s average temperature 0f 65.4 degrees swept by the previous high mark of 64.7 degrees set in 1934. Temperatures were more than 5 degrees above normal, according to the National Oceanic and Atmospheric Administration, which published a May U.S. climate assessment Wednesday.

The 1934 record was impressive, enduring for decades even as the climate has warmed because of increasing greenhouse gases in the atmosphere. One of the main reasons May 1934 was so hot was because it was so dry, posting the least precipitation for the month on record. When the land surface is dry, it heats up faster.

A combination of drought and farming practices had left fields bare of vegetation in 1934, resulting in “an estimated 35 million acres of formerly cultivated land had been rendered useless for farming,” according to History.com.

The parched conditions were so severe that on May 11 “a massive dust storm two miles high traveled 2,000 miles to the East Coast, blotting out monuments such as the Statue of Liberty and the U.S. Capitol,” History.com wrote.

In May 2018, temperatures soared to record levels even without as much help from dry soils. Precipitation was a hair above normal averaged over the nation. Maryland, hit by major floods in Frederick and Ellicott City, had its wettest May on record. So did Florida. Asheville, N.C., posted 14.68 inches of rain, its wettest month in history.

The National Weather issued a flash flood emergency for Ellicott City, Md., on May 27, after 3-6 inches of rain fell in just two hours. (JM Rieger, Taylor Turner, David Bruns/The Washington Post)


Parts of the country, including the south-central United States, New England and the Pacific Northwest, were drier than normal, but overall the percentage of the nation affected by drought fell more than 2 percent during the month.

[In the Northeast, just a few hundred miles separate record wet and dry]

Rather than dry soil, the record warmth this past May can be traced to the jet stream, the high-altitude current that separates cold air from warm air. It lifted north of the U.S.-Canadian border for much of the month, allowing widespread abnormally warm air to flood northward.

(NOAA, adapted by Capital Weather Gang)

It’s also fair to say that rising greenhouse gas concentrations, which have pushed May temperatures higher over time and now even above those torrid Dust Bowl years, contributed to the record temperatures.

The average temperature over the Lower 48 states in May, 1895-2018. (NOAA)
The toasty pattern presented a massive contrast from April, which ranked the 13th-coldest on record, more than 2 degrees below average.

Eight states had their warmest May on record: Virginia, Arkansas, Illinois, Indiana, Kentucky, Missouri, Ohio and Oklahoma.

Across the nation, more than 8,500 warm-temperature records were set at weather stations during the month, compared with 460 cold records. On May 28, Minneapolis notched its earliest 100-degree reading on record.

[Weather whiplash: Midwest catapults from coldest April to hottest May on record; Minneapolis notches earliest 100.]

Thanks to May’s record-setting warmth, the nation posted its 22nd-warmest spring (March through May) in records that date back to 1895, more than offsetting the cold April.


The nation just witnessed its warmest May on record, but, it turns out, that month was only one small piece of a much longer and historically unprecedented stretch of warmth.

Data from the National Oceanic and Atmospheric Administration indicate that the past 36-, 48-, and 60-month periods rank warmest on record for the Lower 48, in records that date to 1895.

Because weather patterns vary somewhat at random, not every month during this unrivaled warm era set a record for warmth. April even ranked as the 12th-coldest on record as the jet stream plunged south for much of the month. But that brief, cool excursion was more than offset by the record-warm May.

More often than not, months have been warmer than normal if not record-challenging. Averaging them, the warmth of the recent 3-, 4-, and 5-year periods has no match.


Average temperature ranking for the Lower 48 states over the past 48 months. Dark red indicates warmest on record. Orange indicates much warmer than normal. (NOAA)

This collection of months is a reflection of long-term climate warming, set in motion by rising concentrations of greenhouse gases in the atmosphere.

The four warmest years on record (2015, 2017, 2016 and 2012) have occurred since 2012, and eight of the 10 warmest years have happened since 1998. Our nation has warmed at a rate of between 0.3 to 0.4 degrees per decade since the 1980s.

[Climate change in the United States presented in 123 red, white and blue stripes]

We should expect future groups of months and years to set more records. “The annual average temperature of the contiguous United States is projected to rise throughout the century,” says the Climate Science Special Report of the federal government’s Fourth National Climate Assessment.

The average temperature for the period 2021 to 2050 is predicted to be between 2.5 and 2.9 degrees warmer than the period from 1976 to 2005. “Notably, a 2.5°F (1.4°C) increase makes the near-term average comparable to the hottest year in the historical record (2012),” the report said. “In other words, recent record-breaking years may be ‘common’ in the next few decades.”


Wednesday, 20 July 2016

Record heat in 2016 leaving 20h century far behind

Global Heat Leaves 20th Century Temps ‘Far Behind’ — June Another Hottest Month on Record


We’ve left the 20th century far behind. This is a big deal. — Deke Arndt, head of NOAA’s National Centers for Environmental Information

*****
19 July, 2016

One of the top three strongest El Ninos on record is now little more than a memory. According to NOAA, sea surface temperatures (SSTs) in the Central Equatorial Pacific hit a range more typical to La Nina conditions last week. This cool-pool formation follows a June in which ocean surfaces in this zone had fallen into temperatures below the normal range.

El Nino Gone
(El Nino had faded away by June and turned toward La Nina-level temperatures by late June and early July. Despite this Equatorial Pacific cooling, June of 2016 was still the hottest June on record. Image source: NOAA.)

But despite this natural-variability related cooling of the Equatorial Pacific into below-normal ranges, the globe as a whole continued to warm relative to previous June temperatures. According to NASA, last month was the hottest June in the global climate record.
NASA figures show the month was 0.79 degrees Celsius warmer than the 20th century baseline (1951 to 1980) average, edging out June of 2015 (when El Nino was still ramping up) by just 0.01 degree C to take the dubious position of the new hottest June ever recorded by human instruments. June 2016 was also about 1.01 C hotter than temperatures in the 1880s, at the start of NASA’s global climate record.

January to June — Anomalous Warmth Centers Over Arctic

June marks the 9th consecutive hottest month on record in the NASA data. In other words, on a month-to-month comparison, each month since October of 2015 was the new hottest of those months ever recorded. In addition, the six-month 2016 climate year period of January to June showed an average global temperature of about 1.31 C above 1880s averages — perilously close to the 1.5 degree C global climate threshold.
Record warm Earth
(Arctic heat dominated the first half of 2016 which is likely to end up being the hottest year ever recorded in the global climate record. Image source: Berkeley Earth.)

Distribution of this anomalous heat during this six-month period, despite the Equatorial warming pulse related to El Nino, was focused on the Arctic, as we can see in this Berkeley Earth graphical composite of the NASA temperature series above.

Warmest temperature anomalies for the period appear above the Barents and Greenland Seas boundaries with the Arctic Ocean and approach 12 C for the six-month period. During this period, this region has hosted numerous warm-wind invasions of the Arctic from the south. A second, similar slot of warm south-to-north air progression appears over Alaska.
Record June Warmth Most Apparent at Northern Continental Margins

During June, the Arctic as a whole remained much warmer than average, with the region from latitudes 80° to 90° North seeing a +0.8 C temperature departure in the NASA measure. The highest anomaly regions globally, however, were near the continental margins bordering the Arctic Ocean in the region of latitudes 70° to 75° North. Here temperatures ranged near 2 C above average.
June Zonal Anomalies
(According to NASA’s zonal anomaly measure, the northern continental margins showed the highest temperature anomalies globally. Image source: NASA GISS.)

Some parts of this region were particularly hot. These included the region of Russian Siberia near the Yamal Peninsula, which saw 4-8 C above average temperatures for the month, the Bering Sea and Northeastern Siberian region adjacent which saw 2-8 C above average temperatures, and the Canadian Archipelago which saw 2-4 C above average temperatures for the month.
Odd Warm-Air Slot Runs from Equator to West Antarctic Peninsula

Notable is that visible warm-air slots running from Tropics to Pole appear to remain intact in the Northeastern Pacific and over Central Asia in the Northern Hemisphere during early Summer. Meanwhile, an odd Southern Hemisphere warm-air slot appears to have developed during June in the region of the Southeastern Pacific.
June of 2016 Anomaly Map
(June of 2016 was the hottest June on record. This is what the anomaly map looked like. Image source: NASA GISS.)

This particular Equator-to-Pole heat transfer appears to have run as far south as the West Antarctic Peninsula and assisted in producing a 4-8 C above-average temperature spike there.

As the majority of the world remained hotter than normal during June of 2016, the only noted outlier cool region was Central and Eastern Antarctica which, in spots, saw 4 to 7.1 C below-average temperatures.
2016 is Blowing All Previous Years Away

Overall, as El Nino continues to shift toward neutral or La Nina states, global temperatures should remain lower than during peak periods seen earlier this year. It’s likely that over the coming six months, the very long period of new monthly global record temperatures we’ve seen will eventually be broken by a top-five- or top-10-hottest month.
Blowing heat records away Climate Central
(2016 is on track to blow all previous record hot years out of the water. See related article here.)

However, it appears that global heat has in total taken a big step up. As such, 2016 appears to be set to average near 1.14 to 1.25 C above 1880s levels. That would beat out previous hottest year 2015 by a big margin. To this point, Deke Arndt, head of NOAA’s National Centers for Environmental Information, recently noted in The Scientific American:
It’s important to keep perspective here. Even if we aren’t setting [monthly] records, we are in a neighborhood beyond anything we had seen before early 2015. We’ve left the 20th century far behind. This is a big deal.”
In other words, that’s about a decade’s worth of typical human-forced warming in just one year. If it shapes up that way, it basically blows all previous years out of the water. Pretty nasty to say the least.

Links/Attribution/Statements

Hat tip to Zack Labe
Hat tip to DT Lange


Sunday, 17 April 2016

Global temperature rise from 1890-1910 - 1.58°C or 2.84°F.

March temperature


Above image shows Land-Ocean (in red) and Land-only (in black) global monthly temperature anomalies compared to the average over the period 1951-1980.

Arctic News,
16 April, 2016


At the Paris Agreement, nations committed to strengthen the global response to the threat of climate change by holding the increase in the global average temperature to well below 2°C above pre-industrial levels and to pursue efforts to limit the temperature increase to 1.5°C above pre-industrial levels.

To see how much temperatures have risen compared to pre-industrial levels, a comparison with the period 1951-1980 does not give the full picture. The image below, created by selecting a smoothing radius of 1200 km, shows that the global temperature rise from 1890-1910 was 1.58°C or 2.84°F.


The temperature rise is even higher when looking at measurements from land-only stations. The image below compares the March 2016 temperature with the period from 1890-1910 (250 km smoothing), showing a Land-only anomaly of 2.42°C or 4.36°F.


Taking into account that temperatures had already risen by some 0.3°C (0.54°F) before 1900, this adds up to a total temperature rise on land in March 2016 of 2.72°C (4.9°F) from the start of the industrial revolution.In February 2016, NASA data show that it was 2.33°C (4.19°F) warmer on land (with 1200 km smoothing) than it was in 1890-1910, while it was 2.48°C (4.46°F) warmer for a 250 km smoothing radius for the land-only data. In an earlier post, a 2.3°C rise in February 2016 was used as one of several elements making up the total rise that could eventuate by the year 2026, assuming that no geoengineering will take place (image below).


The situation is dire and calls for comprehensive and effective action, as described in the 
Climate Plan.


Record March temperatures in the media

It on't make it onto CNN or Fox News but  there have been quite a few headlines.

Greenland’s Ice Sheet Is Melting So Fast Right Now, Scientists Thought It Was an Error


By Eric Holthaus

"5cf03a1e16Greenland’s melt season officially began on Monday—two months earlier than normal.     Danish Meteorological Institute

On Monday, Greenland began to melt. Parts of Greenland melt every year and the whole thing freezes again each winter, but lately, thanks to global warming, the melting has come earlier and then peaked in the summer at higher levels than usual.

Even in light of these trends, Monday’s melt was unlike anything the scientists studying Greenland have ever seen—it was so different, in fact, that they thought the data was wrong.

We had to check that our models were still working properly,” Peter Langen, a climate scientist at the Danish Meteorological Institute, told Polar Portal, a Danish government website which chronicles monitoring of the ice sheet. Sure enough, thermometers on and around the ice showed temperatures as high as 64 degrees Fahrenheit on Monday—more than 35 degrees warmer than normal for this time of year, and more typical of a warm day in July.

That’s… extraordinary. That freakish blue spike on the graph at the top of the page shows the fraction of the total Greenland ice sheet that melted this time around compared to the average numbers. It’s clear that, at least in recent history, nothing like Monday’s warm spell has ever happened before. Danish temperature recordsaround the coast of Greenland dating back to 1873 confirm this. The previous earliest start to the Greenland melt season, defined as the first day there is an area of melt greater than 10 percent of the total ice sheet's surface, was on May 5, 2010. Monday’s melt covered 12 percent of the ice sheet's surface area, and is similar, meteorologically speaking, to an event in July 2012 that resulted in some similarly iconic satellite imagery.* Here’s this week’s map, demonstrating the high temperatures:

Wthr_Anom_SM_EN_20160412Five-day average temperatures over Greenland have been about 10 degrees Celsius (18 degrees Fahrenheit) warmer than normal this week, with daily temperatures exceeding 20 degrees Celsius (36 degrees Fahrenheit) warmer than normal.
Danish Meteorological Institute

There is one likely potential meteorological explanation for the abnormal melt. Strong southerly winds over the past few days have brought a surge of moisture and warmth from the warmer than normal Atlantic, leading to a period of unseasonable rain on top of the ice. A recent study by Greenland scientist Jason Box showed that, for lower elevations of the ice sheet, this might lead to especially fast melting, which is exactly what seems to have happened.

That doesn’t make it any less bizarre. According to Mike MacFerrin, a University of Colorado climate scientist, “melt in Greenland, over this wide an area, this early in the season, is not supposed to happen.” The World Meteorological Organization, on Twitter, called the melt “too much, too early.”

"I'm in Kangerlussuaq now...crazy warm, lots of water in river, +16 C at Old Camp in the shade" from Trevor Popp in West Greenland

another Greenlandic friend "Nuuk is close to drowning in water, caused by rain and melted snow"


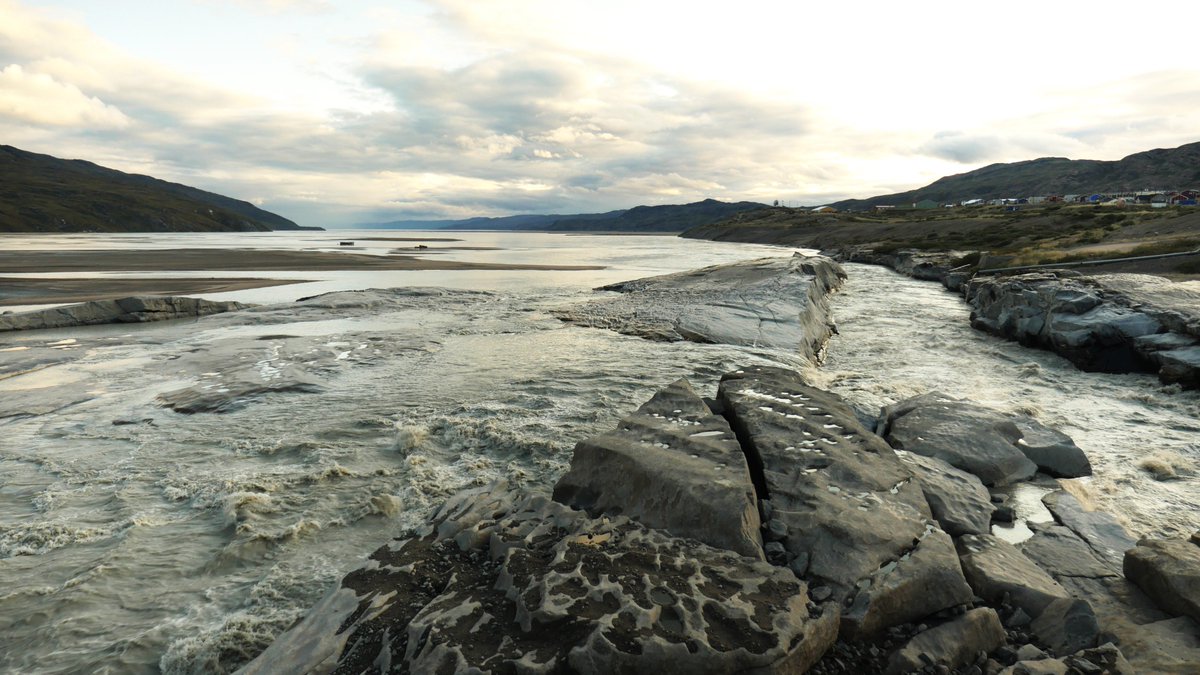
Glacier meltwater turns into raging river in Kangerlussuaq Greenland, where we gathered to prep for

So far for the climate system, 2016 has been a year unlike any other, especially in the Arctic, where this winter has been a blockbuster one for dwindling ice. El Niño may be playing a role, but for the most unusually warm temperatures on the planet to be concentrated in the Arctic is a hallmark signal of human-caused climate change. To be clear, this specific melt event in Greenland will likely only last until Thursday or Friday, when temperatures there (at least for awhile) should dip back below freezing.

Much warmer than normal temperatures for months on end have meant that for much of the frozen north, there essentially wasn’t a winter this year. In late December, parts of the Arctic were briefly warmer than Texas, southern California, and the Sahara. All across the Arctic, temperatures have shattered records and are causing scientists to scratch their heads.

continues to accumulate negative freezing degree day surface anomalies and fall more & more below the chart

The Arctic is in crisis,” said Ted Scambos of the National Snow and Ice Data Center at the University of Colorado in a recent summary of this winter’s unusually warm weather. “Year by year, it’s slipping into a new state.”

Taken together, all this evidence—Greenland’s ice melt, dwindling snow cover, melting permafrost, shrinking sea ice, and the worrying cold patch of ocean near Iceland—points in one direction: The Arctic as we’ve known it may be quickly shifting into a new, warmer reality.

It’s unraveling, every piece of it is unraveling, they’re all in lockstep together,” Rafe Pomerance, a former deputy assistant secretary of state who sits on the National Academy of Sciences’ Polar Research Board, recently told the Washington Post.

The implications of this sudden shift are still being worked out, but climate scientist James Hansen’s recent study provides a preview: We can look forward to faster sea level rise, stronger storms, and even a potential destabilization of global governance, should greenhouse gas emissions continue essentially unchecked. Of course, this week’s melt event in Greenland is just a single additional data point in this trove of evidence, but it’s a dramatic one. What we’re doing is not going unnoticed in the most vulnerable parts of the climate system, like the Arctic.

March 2016 Was Hottest on Record by Greatest Margin Yet Seen for Any Month


16 April, 2-16

Earth is on a roll.

Adding “yet another month to a new mountain chain of extreme global temperature peaks,” March 2016 was the warmest since at least 1891, according to the Japan Meteorological Agency (JMA).

"One stunning feature from the March 2016 temperature map was just how universally warm the month was," writes NOAA scientist. Photo credit: fuzzytractor/flickr/cc)“One stunning feature from the March 2016 temperature map was just how universally warm the month was,” writes NOAA scientist. Photo credit: fuzzytractor/flickr/cc)

Not only that, but, as February did, March broke the previous record by the greatest margin yet seen for any month. Compared to the 20th-century average, March was 1.07°C hotter across the globe, according to the JMA figures, while February was 1.04°C higher.

If April also sets a monthly record—and there’s no reason to think it won’t—”the Earth will have had an astonishing 12 month string of record-shattering months,” writes Andrew Freedman for Mashable.
Graph: Japan Meteorological AgencyGraph: Japan Meteorological Agency

The JMA’s findings are likely to be confirmed by forthcoming reports from the UK Met Office as well as NASA and NOAA, whose satellite data indicates last month was the warmest March in records dating to 1979.

Scientists have pinned the record warmth to a combination of human-caused climate changeand this year’s strong El Niño event.

Responding to the news, professor Michael Mann, a climate scientist at Penn State University,told the Guardian: “Wow. I continue to be shocked by what we are seeing.”

The [new data] is a reminder of how perilously close we now are to permanently crossing into dangerous territory,” Mann said. “It underscores the urgency of reducing global carbon emissions.”

As Common Dreams reported, last month’s NASA data showed that February 2016 was not only the hottest in recorded history, but it soared past all previous records, prompting scientists to describe the announcement as “an ominous milestone in our march toward an ever-warmer planet.”

Meanwhile, NOAA said last week that March 2016 was among the warmest on record for the contiguous United States, and that Alaska had seen “its warmest start to the year on record, while 32 states across the West, Great Plains, Midwest and Northeast were much warmer than average” between January and March.

What’s more, pointed out NOAA climatologist Deke Arndt in a blog post this week, “If you were alive during March 2016, and I’m betting you were, you witnessed U.S. history.”

One stunning feature from the March 2016 temperature map was just how universally warm the month was,” wrote Arndt. “Every one of the 357 climate divisions across the contiguous United States and Alaska ended up—at least—in the ‘warmer than normal’ category.”


We Just Crushed The Global Record For

Hottest Start Of Any Year

BY JOE ROMM 

CREDIT: NASA

NASA reports that this was the hottest three-month start (January to March) of any year on record. It beat the previous record — just set in 2015 — by a stunning 0.7°F (0.39°C). Normally, such multi-month records are measured in the hundredths of a degree

Last month was the hottest February on record by far. It followed the hottest January on record by far, which followed the hottest December by far, which followed the hottest November on record by far, which followed the hottest October on record by far. Some may detect a pattern here.


NASA's March temperature data was released Friday, showing that it was the planet's second-most unusually mild month on record, only somewhat cooler than February 2016. 

The NASA data shows the monthly global average temperature was 1.28 degrees Celsius, or 2.3 degrees Fahrenheit, above the 20th century average. 

According to NASA, six straight months from 2015 into 2016 have had a temperature anomaly of at least 1 degree Celsius. That had not happened in any month prior to this record warm stretch.

Data released on Thursday shows that March 2016 was the warmest March since at least 1891, making it the planet's 11th consecutive month to set a global temperature milestone.


Global average surface temperature anomalies for March 2016.  IMAGE: NASA

The data, from the Japan Meteorological Agency, as well as a separate analysis using computer model data, means that if April also sets a monthly record, the Earth will have had an astonishing 12 month string of record-shattering months.


Other agencies will soon weigh in with their own analysis of March's temperatures, including NASA, the National Oceanic and Atmospheric Administration (NOAA) and the UK Met Office, and their figures may differ slightly in ranking the month compared to the historical record. 

The cause of the record warmth, scientists say, is a combination of a record strong El Niño event in the tropical Pacific Ocean and the increasingly apparent effects of long-term human-caused global warming. 

The world was already setting more and more warm temperature records without the El Niño's assistance, but what El Niño has done was dial up the already elevated temperatures to damaging levels.

Right now, scientists around the world are witnessing the effects of this global fever. These include the third and longest-lasting global coral bleaching event, which is harming — and in some cases, killing — reefs from the Great Barrier Reef to the Florida Keys. 

In the Arctic, Greenland commenced its melt season more than one month early when a freak heat wave swept in earlier this week, sending temperatures skyrocketing into the low 60s Fahrenheit in southwest Greenland and breaking records all the way to the top of the ice sheet itself, more than 10,000 feet above sea level. 

In addition, Arctic sea ice set a record for the lowest winter maximum extent, potentially setting the ice pack up for a summer melt season with a largely open Arctic Ocean, depending on transient weather conditions

And the Guardian


Average global temperature was 1.07C hotter - beating last month’s previous record increase