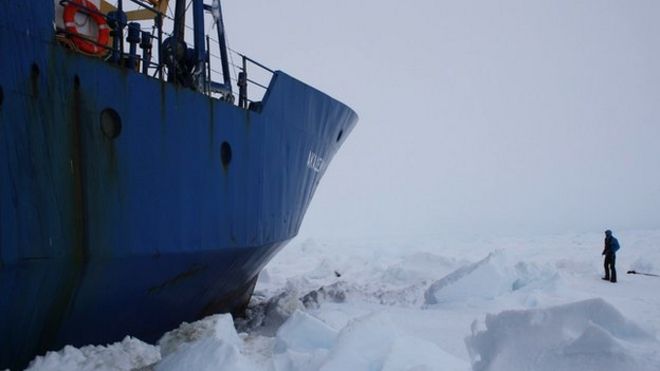
Back at Christmas, 2013 a Russian ship carrying climate researchers to Antarctica got stuck in ice off the coast and had to be rescued. The deniers were crowing at the time and there was much talk that sea ice in Arctic was contracting while in Antarctica it was expanding. Of course, the truth was that the ice was melting from below as it is in the Arctic so while the extent was increasing the thickness was decreasing.
As
the members of the Australasian Antarctic Expedition (AAE) reach the
end of their travels together, investigations will soon begin to
establish why their Russian expedition ship, the MV Akademik
Shokalskiy, became trapped in thick and extensive pack ice for 10
days.
The
ship's entrapment at Christmas time led to an Australian icebreaker
being diverted from its own operations hundreds of kilometres along
the coast and a Chinese icebreaker also coming to the rescue.
That
vessel ended up stuck in the ice itself for many days. A smaller
French icebreaker ship was also summoned to the scene. It retreated
when it became clear that the ice was much too thick for it to help.
The
52 members of the Australasian Antarctic Expedition were trapped
until 2 January when a helicopter team from the Chinese vessel
airlifted the scientists, tourists and operational staff to the
Aurora Australis This was in September, 2014 Antarctic Sea Ice Reaches New Record Maximum
By 2017 the headlines were changing and we had the lowest sea ice for the time.
At the very time that we were being told about the changes in Antarctica RNZ continued to push the fake line that "Antarctic ice is not melting like the Arctic".
And, coming back to now here is data for ice concentration and thickness for now.
And here is a conparison with the same time in 2015 (the 2013-14 data is not available).
It has to be pointed out that Antarctica is very different from the Arctic in that it is a large continent surrounded by ocean so that much of the ice disappears over summer. However the last two years have been records. Meanwhile, the situation in the Tasman Sea, between Australia and New Zealand are getting dire.
Because the Arctic and Antarctic are cold, dark, and remote, we often think these two places are nearly the same. However, they are quite different. One notable difference is that polar bears live only in the Arctic, and penguins live only in the Antarctic. But what about the differences in sea ice between the two regions?
Geography
Sea ice differs between the Arctic and Antarctic, primarily because of their different geography. The Arctic is a semi-enclosed ocean, almost completely surrounded by land. As a result, the sea ice that forms in the Arctic is not as mobile as sea ice in the Antarctic. Although sea ice moves around the Arctic basin, it tends to stay in the cold Arctic waters. Floes are more prone to converge, or bump into each other, and pile up into thick ridges. These converging floes makes Arctic ice thicker. The presence of ridge ice and its longer life cycle leads to ice that stays frozen longer during the summer melt. So some Arctic sea ice remains through the summer and continues to grow the following autumn. Of the 15 million square kilometers (5.8 million square miles) of sea ice that exist during winter, on average, 7 million square kilometers (2.7 million square miles) remain at the end of the summer melt season.
These images using satellite-derived sea ice concentration data show average minimum and maximum sea ice during March and September for the Arctic and Antarctic from 1979 to 2000. Seasons are opposite between the Southern and Northern Hemispheres; the South reaches its summer minimum in February, while the North reaches its summer minimum in September. (March is shown for both hemispheres for consistency.) The black circles in the center of the Northern Hemisphere images are areas lacking data due to limitations in satellite coverage at the North Pole. —Credit: National Snow and Ice Data Center, University of Colorado, Boulder, Colorado.
The Antarctic is almost a geographic opposite of the Arctic, because Antarctica is a land mass surrounded by an ocean. The open ocean allows the forming sea ice to move more freely, resulting in higher drift speeds. However, Antarctic sea ice forms ridges much less often than sea ice in the Arctic. Also, because there is no land boundary to the north, the sea ice is free to float northward into warmer waters where it eventually melts. As a result, almost all of the sea ice that forms during the Antarctic winter melts during the summer. During the winter, up to 18 million square kilometers (6.9 million square miles) of ocean is covered by sea ice, but by the end of summer, only about 3 million square kilometers (1.1 million square miles) of sea ice remain.
Thickness
Because sea ice does not stay in the Antarctic as long as it does in the Arctic, it does not have the opportunity to grow as thick as sea ice in the Arctic. While thickness varies significantly within both regions, Antarctic ice is typically 1 to 2 meters (3 to 6 feet) thick, while most of the Arctic is covered by sea ice 2 to 3 meters (6 to 9 feet) thick. Some Arctic regions are covered with ice that is 4 to 5 meters (12 to 15 feet) thick.
Patterns of Ice Extent
The above images reveal another notable difference in sea ice. The pattern of Antarctic maximum sea ice is roughly symmetric around the pole, forming a circle around Antarctica. In contrast, the Arctic is asymmetric, with much more ice in some longitudes than others. For example, sea ice off the eastern coast of Canada extends south of Newfoundland to 50 degrees north latitude, and ice off the eastern coast of Russian extends to Bohai Bay, China, at about 38 degrees north latitude. Conversely, in western Europe, the northern coast of Norway at 70 degrees north latitude (2,000 kilometers, or 1,243 miles, farther north than Newfoundland or Japan) generally remains ice-free. Ocean currents and winds explain these differences.
In the Antarctic, the currents and winds tend to flow without interruption around the continent in a west-to-east direction, acting like a barricade to warmer air and water to the north. In contrast, the Arctic region north of the Atlantic Ocean is open to the warmer waters from the south, because of the way the ocean currents flow. These warmer waters can flow into the Arctic and prevent sea ice from forming in the North Atlantic. The waters off the eastern coasts of Canada and Russia are affected by cold air moving off the land from the west. The eastern Canadian coast is also fed by southward-flowing cold water currents that make it easier for sea ice to grow.
Snow Cover over Sea Ice
Because the Arctic Ocean is mostly covered by ice and surrounded by land, precipitation is relatively rare. Snowfall tends to be low, except near the ice edge. Antarctica, however, is entirely surrounded by ocean, so moisture is more readily available. Antarctic sea ice tends to be covered by thicker snow, which may accumulate to the point that the weight of snow pushes the ice below sea level, causing the snow to become flooded by salty ocean waters.
Other Differences
Antarctic sea ice does not reach the South Pole, extending only to about 75 degrees south latitude (in the Ross and Weddell Seas), because of the Antarctic continent. However, Arctic sea ice can extend all the way to the North Pole. Here, the Arctic sea ice receives less solar energy at the surface because the sun's rays strike at a more oblique angle, compared to lower latitudes.
Water from the Pacific Ocean and several rivers in Russia and Canada provide fresher, less dense water to the Arctic Ocean. So the Arctic Ocean has a layer of cold, fresh water near the surface with warmer, saltier water below. This cold, fresh water layer typically allows more ice growth in the Arctic than the Antarctic.
Variations in Extent
Both Arctic and Antarctic sea ice extent are characterized by fairly large variations from year to year. The monthly average extent can vary by as much as 1 million square kilometers (386,102 square miles) from the year-to-year monthly average. In some months, the trends in Antarctic ice extent are statistically significant at the 95% level, although small.
According to scientific measurements, both the thickness and extent of summer sea ice in the Arctic have shown a dramatic decline over the past thirty years. This is consisistent with observations of a warming Arctic. This trend is a major sign of climate change in the polar regions and may be an indicator of the effects of global warming. (See Trends in the Environment section).
For more information on current sea ice conditions see the Arctic Sea Ice News & Analysis Web page. To read NSIDC press releases on recent Arctic sea ice minima, see the Arctic Sea Ice Press Announcements Archive on the Arctic Sea Ice News & Analysis Web page.
I
am feeling quite overwhemed by the rate of changes in Arctic and I
feel it quite viscerally when I get the following message from Kevin
Hester
"My
mate and Truthout Staff reporter Dahr Jamail emailed me this morning
and said he was back from Barrow in Alaska and he has blockbuster
data . Dahr found out it is worse than he thought and Dahr knows what
we know.
"Brace
for bad news".
We will have to wait a little longer to see what this data is.
The
news is all bad. None of it is good and it is deeply shocking to see
how quickly things are changing.
Many
thanks to all those who have posted information. I hope this can
increase clarity.
The
disappearing Arctic sea ice – update 08/11/2017
This is what Barrow, Alaska is looking like.
I am not sure where this is but it illustrates the rapid break-up of ice
These are sea temperature anomalies in the Arctic basin
And temperatures in the Canadian Arctic
Below
is a reality check on ice conditions from FJL (far right) up and over
the pole into the Chukchi, a piece of the most recent DTU/Saldo
mosaic from Sentinel-1AB active radar. It takes a click to
see as it is rather wide because of its vastly higher resolution. The
north pole is along the bottom centered in the black 'pole hole' that
the satellite cannot image. You can view these mosaics
at http://www.seaice.dk/latest/
AMSR2
sea ice concentration from UH does quite a good job on the same area
(click again), though ultimately 3125 m resolution won't stack up to
the ~100x higher resolution (30 m) of Sentinel. The latter though has
fairly narrow swaths so the ice can move or change -- especially
during storms -- over the 3 days needed to compile these mosaics.
August
8-11 high speed, 78 hours to cover the cyclone, I find I can see the
ice better.
The
next pulse of swell is currently forecast to be somewhat bigger and
longer period than the last one. This one is also taking aim at the
Beaufort Sea marginal ice zone:
1
day change in Bremen concentration. 3 versions attached: Original,
last under 90 filter, median filter (5 day period). Choose your
poison.
Pacific
continues to erode and contract towards the CAA, with anti-clockwise
motion in the direction of storm winds apparent throughout the
Arctic, as anticipated by Sterks' post above. Such large scale
coordinated motion cannot be good for the halocline. Finally here is explanation from Paul Beckwith
Warmth
and melting in the Arctic – update – 07/31/2017
After
following this for about 6 years I’m not that prone to shock but I
am shocked today.
Look
at the wind in the Central Arctic Basin, At nearly 40 km/hr it is
more than enough to churn up already thin ice.
The
winds near Bering Strait and above Siberia are nearly 70 km/hr!!
Combine
that with temrperature anamolies and make your own conclusions.
I
have reorientated the map to make it more comprehensible
The Arctic looks positively balmy!
Have a look at the temperature anomalies for the region....
Look at the Jet Stream winds.
Insane!
Now
for a verbal description.
«This
storm will spread out a lot of ice. It seems that other storms will
follow the same path forming a train, which can end breaking and
spreading the pack finishing on a similar shape as of 2016. Just that
this is thinner younger ice. The general circulation adds a small
push in the to-Atlantic direction. Expect sustainable decreases of
area, and extent for at least the first half of August. Bottom melt
won't stop until well into September or beyond.»
Arctic
sea ice is in a horrible state. On August 16, 2015, Arctic sea ice
extent was 5.786 million square km, the smallest extent on record
for this time of year except for the years 2007, 2011 and 2012, as
illustrated by the image on the right.
The situation today is
even worse than one might conclude when looking at sea ice extent
alone. Thick sea ice is virtually absent compared to the situation
in the year 2012 around this time of year, as illustrated by the
image below comparing sea ice thickness on August 16, 2012 (left)
with August 16, 2015 (right).
The
ice used to be over 4 m thick, or over 13 ft thick, north of
Greenland and the Canadian Archipelago. This thick multi-year ice
has been a feature of the Arctic sea ice for over 100,000 years. It
used to be there all year long, unlike the thinner ice that could
melt away entirely during the melting season.
The
disappearance of this thick multi-year ice is a major development.
Why? Until now, the thicker multi-year sea ice used to survive the
melting season, giving the sea ice strength for the next year, by
acting as a buffer to absorb heat that would otherwise melt away the
thinner ice. Without multi-year sea ice, the Arctic will be in a bad
shape in coming years, and huge amounts of heat that would otherwise
go into melting the ice will instead be warming up the Arctic Ocean,
further accelerating warming of its waters.
Absence of thick
sea ice makes it more prone to collapse, and this raises the
question whether the sea ice could collapse soon, even this year.
Sea ice works like a mirror. Without sea ice, sunlight that was
previously reflected back into space, will instead be absorbed by
the Arctic. Albedo changes in the Arctic alone could more than
double the net radiative forcing resulting from the emissions caused
by all people of the world, as calculated by Prof. Peter
Wadhams back
in 2012.
Furthermore,
there is a danger that loss of the sea ice will weaken the currents
that currently cool the bottom of the sea, where huge amounts of
methane may be present in the form of free gas or hydrates in
sediments. This danger is illustrated by the image below by Reg
Morrison, from an earlier
post.
Absence
of sea ice also goes hand in hand with opportunities for storms to
develop over the Arctic Ocean. Such storms could push the remaining
sea ice out of the Arctic Ocean. Such storms could also mix surface
heat all the way down to the seafloor, where methane could be
contained in sediments.
As
described in an earlier
post,
sea surface anomalies of over 5 degrees Celsius were recorded in
August 2007 (NOAA image right). Strong polynya activity caused more
summertime open water in the Laptev Sea, in turn causing more
vertical mixing of the water column during storms in late 2007, as
described in this study,
and bottom water temperatures on the mid-shelf increased by more
than 3 degrees Celsius compared to the long-term mean.
Indeed,
the danger is that heat will warm up sediments under the sea,
containing methane in hydrates and as free gas, causing large
amounts of this methane to escape rather abruptly into the
atmosphere.
The image on the right, from a study
by Hovland et al.,
shows that hydrates can exist at the end of conduits in the
sediment, formed when methane did escape from such hydrates in the
past.
Heat
can travel down such conduits relatively fast, warming up the
hydrates and destabilizing them in the process, which can result in
huge abrupt releases of methane.
Since waters can be very
shallow in the Arctic, much of the methane can then rise up through
these waters without getting oxidized. As the methane causes further
warming in the atmosphere, this will contribute to the danger of
even further methane escaping, further accelerating local warming,
in a vicious cycle that can lead to catastrophic conditions well
beyond the Arctic. For additional feedbacks in the Arctic, see
the feedbacks
page.
At
the same time, ocean heat is at a record high and there's an El Niño
that's still gaining strength. This ocean heat is likely to reach
the Arctic Ocean in full strength by October 2015, at a time when
sea ice may still be at its minimum. The image below shows sea
surface temperatures on August 16, 2015 (left) and anomalies
(right).
How
warm is the water entering the Arctic Ocean? Merely looking at sea
surface temperatures could make one overlook the full extent of the
predicament we are in. Ocean heat traveling underneath the sea
surface can be even warmer than temperatures showing up at the
surface. This is illustrated by the image below indicating that on
August 16, 2015, warm water emerged at the sea surface near Svalbard
with temperatures as high as 14.9°C or 58.7°F, a 9.5°C or 17.1°F
anomaly.
There
still is about a month to go before sea ice can be expected to reach
its minimum, at around half September 2015, while sea currents will
continue to carry warmer water into the Arctic Ocean for months to
come.
The situation is dire and calls for comprehensive
and effective action, as discussed in the Climate
Plan.

 Posts
Posts