The
Depression Of The 1930s Was An Energy Crisis
19
December, 2017
Economists, including
Ben Bernanke,
give all kinds of reasons for the Great Depression of the 1930s. But
what if the real reason for the Great Depression was an energy
crisis?
When
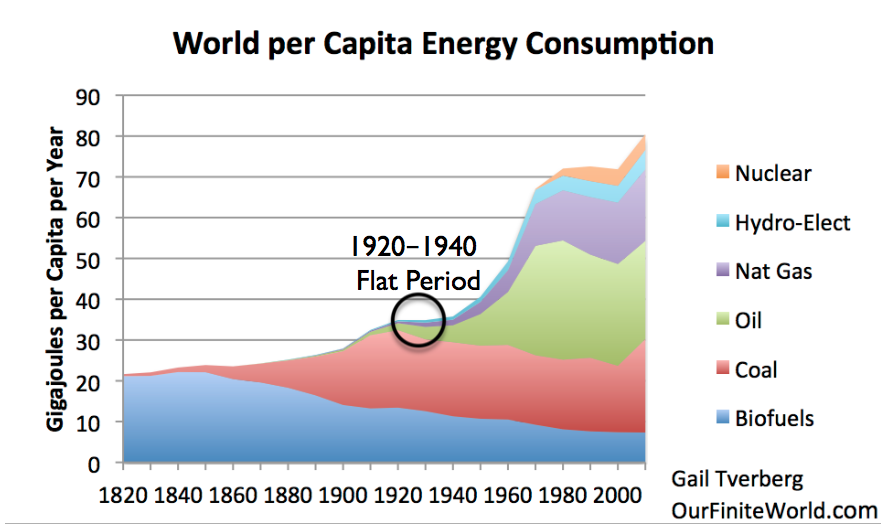
I put together a chart of per capita energy consumption since
1820 for
a post back in 2012,
there was a strange “flat spot” in the period between 1920 and
1940. When we look at the underlying data, we see that coal
production was starting to decline in some of the major coal
producing parts of the world at that time. From the point of view of
people living at the time, the situation might have looked very much
like peak energy consumption, at least on a per capita basis.
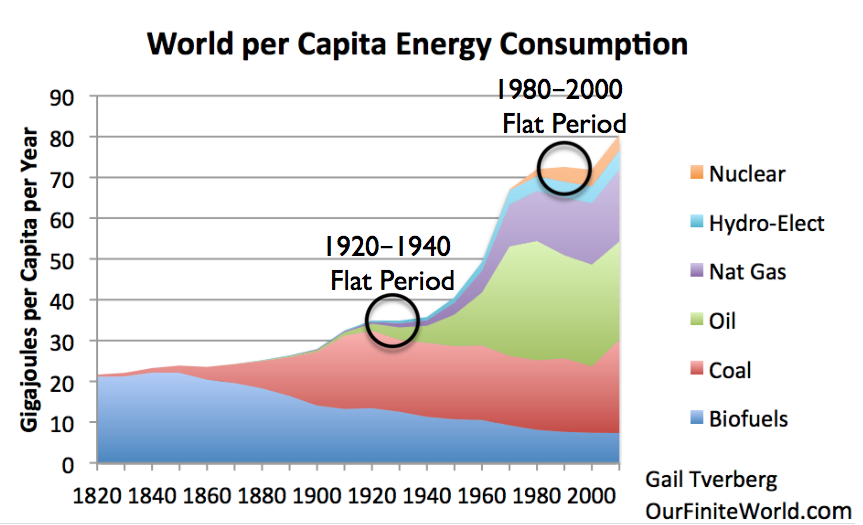
Figure
1. World Energy Consumption by Source, based on Vaclav Smil
estimates from Energy Transitions: History, Requirements and
Prospects (Appendix) together with BP Statistical Data for 1965 and
subsequent, divided by population estimates by Angus Maddison.
Even
back in the 1820 to 1900 period, world per capita energy had
gradually risen as an increasing amount of coal was used. We
know that going back a very long time, the use of water and wind had
never amounted to very much (Figure 2) compared to burned biomass and
coal, in terms of energy produced. Humans and draft animals were also
relatively low in energy production. Because of its great
heat-producing ability, coal quickly became the dominant fuel.
Figure
2. Annual energy consumption per head (megajoules) in England and
Wales during the period 1561-70 to 1850-9 and in Italy from 1861-70.
Figure by Wrigley
In
general, we know that energy products, including coal, are
necessary to enable processes that contribute to economic growth.Heat
is needed for almost all industrial processes. Transportation needs
energy products of one kind or another. Building roads and homes
requires energy products. It is not surprising that the Industrial
Revolution began in Britain, with its use of coal.
We
also know that there is a long-term correlation between world GDP
growth and energy consumption.
Figure
3. X-Y graph of world energy consumption (from BP Statistical Review
of World Energy, 2017) versus world GDP in 2010 US$, from World
Bank.
The
“flat period” in 1920-1940 in Figure 1 was likely problematic.
The economy is a self-organized networked system; what was wrong
could be expected to appear in many parts of the economy. Economic
growth was likely far too low. The chance for conflict among nations
was much higher because of stresses in the system–there was not
really enough coal to go around. These stresses could extend to the
period immediately before 1920 and after 1940, as well.
A
Peak in Coal Production Hit UK, United States, and Germany at Close
to the Same Time
This
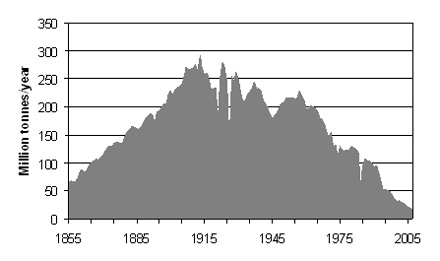
is a coal supply chart for UK. Its peak coal production (which was an
all time peak) was in 1913. The UK was the largest coal producer in
Europe at the time.
Figure
3. United Kingdom coal production since 1855, in figure
by David Strahan.
First published in New Scientist, 17 January 2008.
The
United States hit a peak in its production only five years later, in
1918. This peak was only a “local” peak. There were also later
peaks, in 1947 and 2008, after coal production was developed in new
areas of the country.
By
type, US coal production is as shown on Figure 5.
Evidently,
the highest quality coal, Anthracite, reached a peak and began to
decline about 1918. Bituminous coal hit a peak about the same time,
and dropped way back in production during the 1930s. The poorer
quality coals were added later, as the better-quality coals became
less abundant.
The
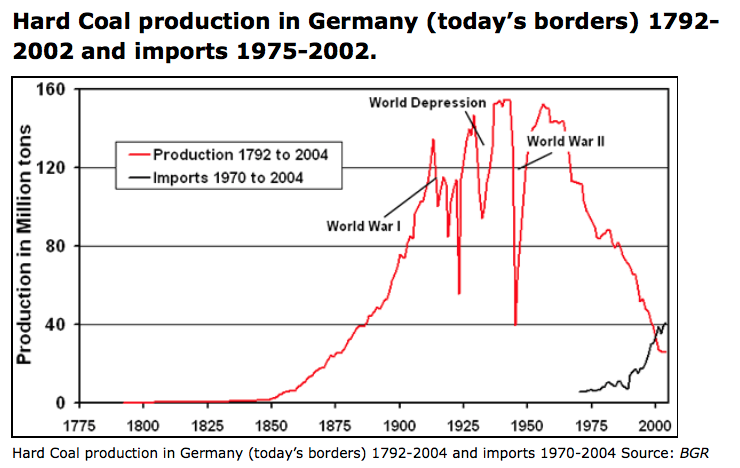
pattern for Germany’s hard coal shows a pattern somewhat in between
the UK and the US pattern.
Germany
too had a peak during World War I, then dropped back for several
years. It then had three later peaks, the highest one during World
War II.
What
Affects Coal Production?
If
there is a shortage of coal, fixing it is not as simple as
“inadequate coal supply leads to higher price,” quickly followed
by “higher price leads to more production.” Clearly
the amount
of coal resource in the ground affects
the amount of coal extraction, but other things do as well.
[1] The
amount of built infrastructure for
taking the coal out and delivering the coal. Usually, a
country only adds a little coal extraction capacity at a time and
leaves the rest in the ground. (This is how the US and Germany could
have temporary coal peaks, which were later surpassed by higher
peaks.) To add more extraction capacity, it is necessary to add
(a) investment needed for getting the coal out of the ground as
well as (b) infrastructure for delivering coal to potential users.
This includes things like trains and tracks, and export terminals for
coal transported by boats.
[2] Prices
available in the marketplace for coal.
These fluctuate widely. We will discuss this more in a later section.
Clearly, the higher the price, the greater the quantity of coal that
can be extracted and delivered to users.
[3] The
cost of extraction, both in existing locations and in new locations.
These costs can perhaps be reduced if it is possible to add new
technology. At the same time, there is a tendency for costs within a
given mine to increase over time, as it becomes necessary to access
deeper, thinner seams. Also, mines tend to be built in the most
convenient locations first, with best access to transportation. New
mines very often will be higher cost, when these factors are
considered.
[4] The
cost and availability of capital (shares
of stock and sale of debt) needed for building new infrastructure,
and for building new devices made possible by new technology. These
are affected by interest rates and tax levels.
[5] Time
lags needed to implement changes.
New infrastructure and new technology are likely to take several
years to implement.
[6] The
extent to which wages can be recycled into demand for energy
products.
An economy needs to have buyers for
the products it makes. If a large share of the workers in an economy
is very low-paid, this creates a problem.
If
there is an energy shortage, many people think of the shortage as
causing high prices. In fact, the shortage is at least equally likely
to cause greater wage disparity. This might also be considered a
shortage of jobs that pay well.
Without
jobs that pay well, would-be workers find it hard to purchase the
many goods and services created by the economy (such as homes, cars,
food, clothing, and advanced education). For example, young adults
may live with their parents longer, and elderly people may move in
with their children.
The
lack of jobs that pay well tends to hold down “demand” for goods
made with commodities, and thus tends to bring down commodity prices.
This problem happened in the 1930s and is happening again today. The
problem is an affordability problem,
but it is sometimes referred to as “low demand.” Workers
with inadequate wages cannot afford to
buy the goods made by the economy. There
may be a glut of a commodity (food, or oil, or coal), and commodity
prices that fall far below what producers need to make a profit.
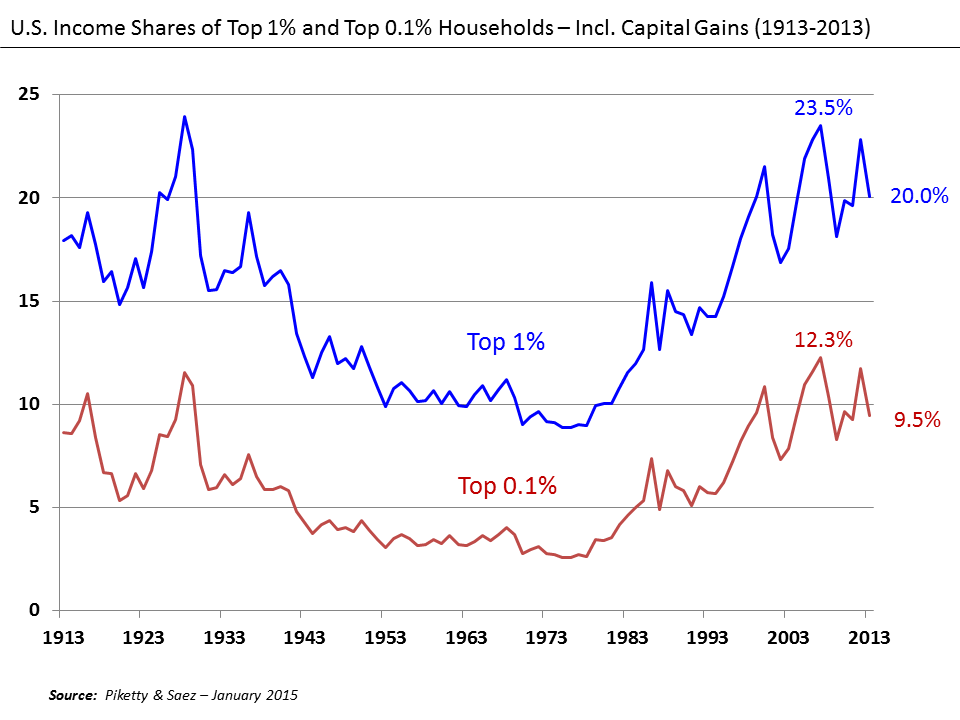
Figure
7. U. S. Income Shares of Top 10% and Top 1%, Wikipedia
exhibit by
Piketty and Saez.
The Fluctuating
Nature of Commodity Prices
I
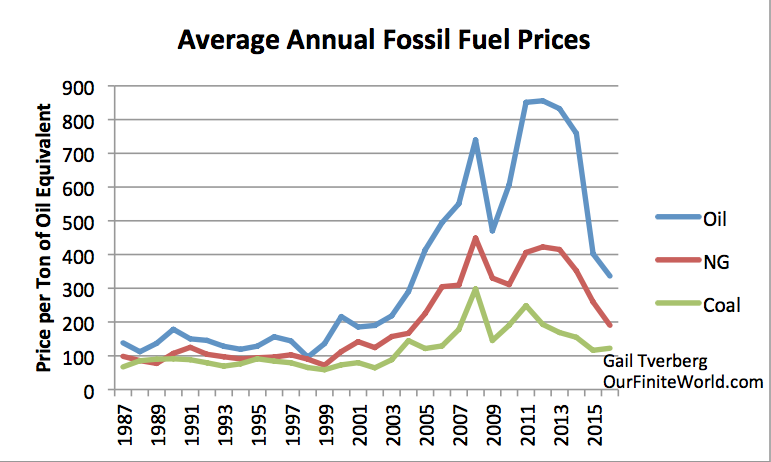
have noted in the past that fossil fuel prices tend to move together.
This is what we would expect, if affordability is a major issue, and
affordability changes over time.
Figure
8. Price per ton of oil equivalent, based on comparative prices for
oil, natural gas, and coal given in BP Statistical Review of World
Energy. Not inflation adjusted.
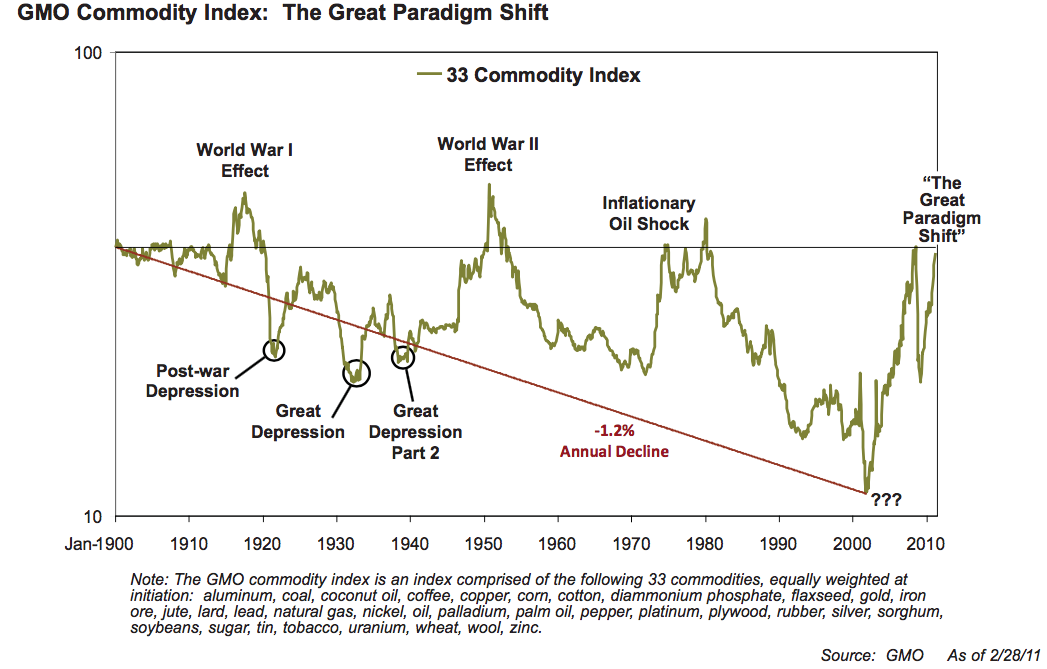
We
would expect metal prices to follow fossil fuel prices, because
fossil fuels are used in the extraction of ores of all
kinds. Investment strategist Jeremy Grantham (and his company
GMO) noted this correlation among commodity prices, and put together
an index of commodity prices back to 1900.
Figure
9. GMO Commodity Index 1900 to 2011, from GMO
April 2011 Quarterly Letter.
“The Great Paradigm Shift,” shown at the end is not really the
correct explanation, something now
admitted by Grantham.
If the graph were extended beyond 2010, it would show high prices in
2010 to 2013. Prices would fall to a much lower level in 2014 to
2017.
Reason
for the Spikes in Prices. As
we will see in the next few paragraphs, the spikes in prices
generally arise in situations in which everyday goods (food, homes,
clothing, transportation) suddenly became more affordable to
“non-elite” workers. These are workers who are not highly
educated, and are not in supervisory positions. These spikes in
prices don’t generally “come about” by themselves; instead,
they are engineered by governments, trying to stimulate the economy.
In
both the World
War I and World War II price spikes,
governments greatly raised their debt levels to fund the war efforts.
Some of this debt likely went directly into demand for commodities,
such as to make more bombs, and to operate tanks, and thus tended to
raise commodity prices. In addition, quite a bit of the debt
indirectly led to more employment during the period of the war. For
example, women who were not in the workforce were hired to take jobs
that had been previously handled by men who were now part of the war
effort. (These women were new non-elite workers.) Their earnings
helped raise demand for goods and services of all kinds, and thus
commodity prices.
The 2008
price spike was
caused (at least in part) by a US housing-related debt bubble.
Interest rates were lowered in the early 2000s to stimulate the
economy. Also, banks were encouraged to lend to people who did not
seem to meet usual underwriting standards. The additional demand for
houses raised prices. Homeowners, wishing to cash in on the new
higher prices for their homes, could refinance their loans and
withdraw the cash related to the new higher prices. They could use
the funds withdrawn to buy goods such as a new car or a remodeled
basement. These withdrawn funds indirectly supplemented the earnings
of non-elite workers (as did the lower interest rate on new
borrowing).
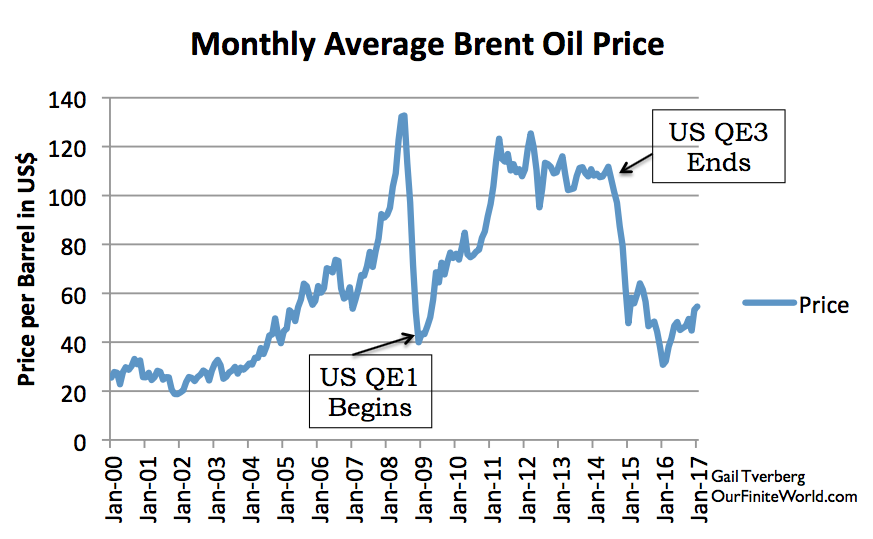
The 2011-2014
spike was
caused by the extremely low interest rates made possible by
Quantitative Easing. These low interest rates made the buying of
homes and cars more affordable to all buyers, including non-elite
workers. When the US discontinued its QE program in 2014, the US
dollar rose relative to many other currencies, making oil and other
fuels relatively more expensive to workers outside the US. These
higher costs reduced the demand for fuels, and dropped fuel prices
back down again.
Figure
10. Monthly Brent oil prices with dates of US beginning and ending
QE.
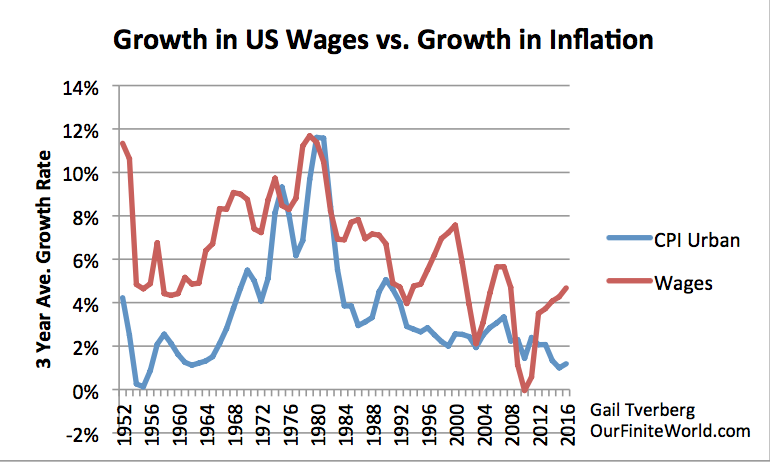
The
run-up in oil prices (and other commodity prices) in the 1970s is
widely attributed to US oil production peaking, but I think that the
rapid run-up in prices was enabled by the rapid wage run-up of the
period (Figure 11 below).
Figure
11. Growth in US wages versus increase in CPI Urban. Wages are total
“Wages and Salaries” from US Bureau of Economic Analysis.
CPI-Urban is from US Bureau of Labor Statistics.
The
Opposing Force: Energy prices need to fall, if the economy is to
grow. All
of these upward swings in prices can be at most temporary changes to
the long-term downward trend in prices. Let’s think about why.
An
economy needs to grow. To do so, it needs an increasing supply of
commodities, particularly energy commodities. This can only happen if
energy prices are trending lower. These lower prices enable the
purchase of greater supply. We can see this in the results of
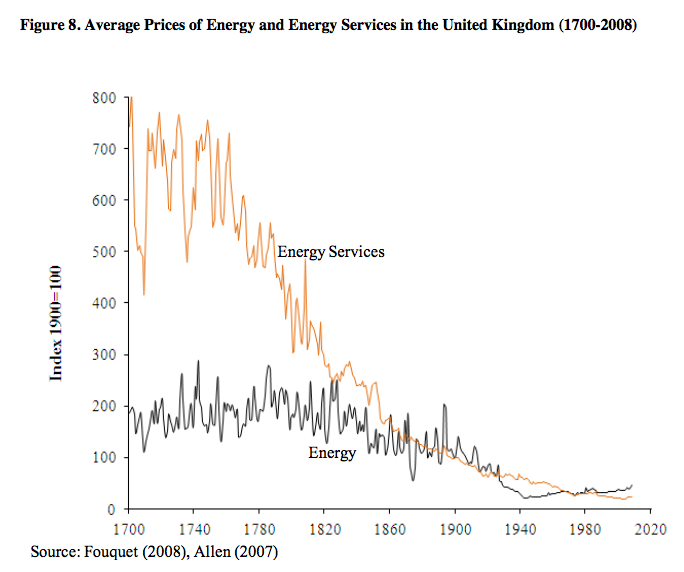
some academic papers. For example, Roger Fouquet shows that it is not
the cost of energy, per se, that drops over time. Rather, it is the
cost of energy services that declines.
Energy
services include changes in efficiency, besides energy costs
themselves.
Thus, Fouquet is looking at the cost of heating a home,
or the cost of electrical services, or the cost of transportation
services, in inflation-adjusted units.
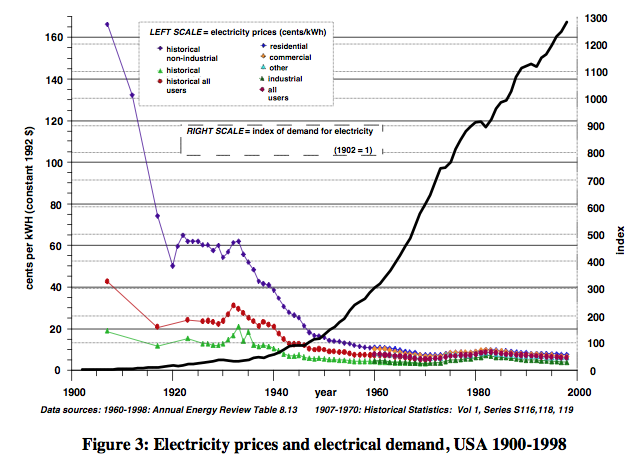
Robert
Ayres and Benjamin Warr show a similar result, related to
electricity. They also show that usage tends to rise, as prices fall.
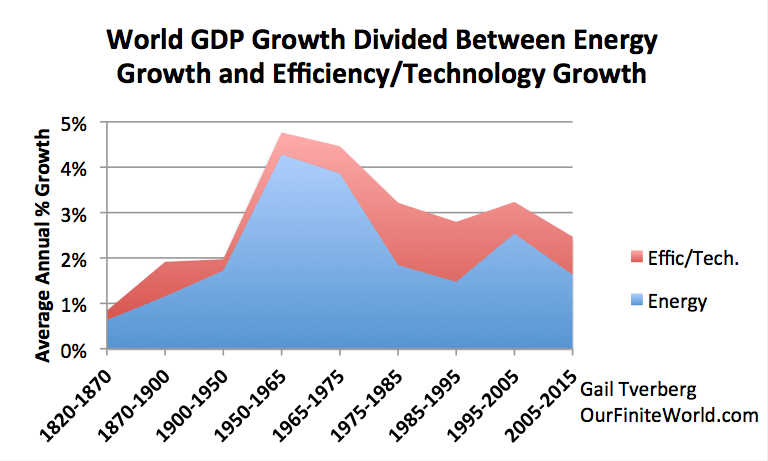
Ultimately,
we know that the growth in energy consumption tends to rise at close
to the same rate as the growth in GDP. To keep energy consumption
rising, it is helpful if the cost of energy services is falling.
Figure
14. World GDP growth compared to world energy consumption growth for
selected time periods since 1820. World real GDP trends for 1975 to
present are based on USDA
real GDP data in
2010$ for 1975 and subsequent. (Estimated by author for 2015.) GDP
estimates for prior to 1975 are based on Maddison
project updates as
of 2013. Growth in the use of energy products is based on a
combination of data from Appendix A data from Vaclav Smil’s Energy
Transitions: History, Requirements and Prospects together
with BP Statistical Review of World Energy 2015 for 1965 and
subsequent.
How
the Economic Growth Pump Works
There
seems to be a widespread belief, “We pay each other’s wages.”
If this is all that there is to economic growth, all that is needed
to make the economy grow faster is for each of us to sell more
services to each other (cut each other’s hair more often, or give
each other back rubs, and charge for them ). I think this story is
very incomplete.
The
real story is that energy
products can be used to leverage human labor. For
example, it is inefficient for a human to walk to deliver goods to
customers. If a human can drive a truck instead, it leverages his
ability to deliver goods. The more leveraging that is available for
human labor, the more goods and services that can be produced in
total, and the higher inflation-adjusted wages can be. This increased
leveraging of human labor allows inflation-adjusted wages to rise.
Some might call this result, “a higher return on human labor.”
These
higher wages need to go back to the non-elite workers, in order to
keep the growth-pump operating. With higher-wages, these
workers can afford to buy goods and services made with commodities,
such as homes, cars, and food.
They can also heat their homes and
operate their vehicles. These wages help maintain the demand needed
to keep commodity prices high enough to encourage more commodity
production.
Raising
wages for elite workers (such as managers and those with advanced
education), or paying more in dividends to shareholders, doesn’t
have the same effect. These individuals likely already have enough
money to buy the necessities of life. They may use the extra income
to buy shares of stock or bonds to save for retirement, or they may
buy services (such as investment advice) that require little use of
energy.
The
belief, “We pay each other’s wages,” becomes increasingly
false, if wages and wealth are concentrated in the hands of
relatively few. For example, poor people become unable to afford
doctors’ visits, even with insurance, if wage disparity becomes too
great. It is only when wages are fairly equal that all can afford a
wide range of services provided by others in the economy.
What
Went Wrong in 1920 to 1940?
Very
clearly, the first thing that went wrong was the peaking of UK coal
production in 1913. Even before 1913, there were pressures coming
from the higher cost of coal production, as mines became more
depleted. In 1912, there was a 37-day
national coal strike protesting
the low wages of workers. Evidently, as extraction was becoming more
difficult, coal prices were not able to rise sufficiently to cover
all costs, and miners’ wages were suffering. The debt for World War
I seems to have helped raise commodity prices to allow wages to be
somewhat higher, even if coal production did not return to its
previous level.
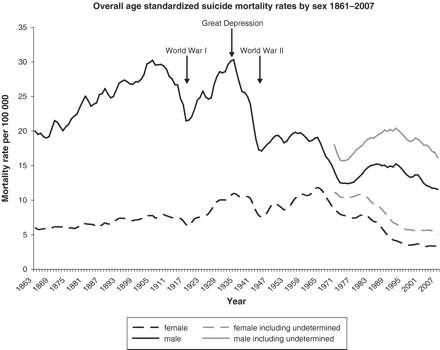
Suicide
rates seem to behave inversely compared to earning power of non-elite
workers. A study
of suicide rates in England and Walesshows
that these were increasing prior to World War I. This is what we
would expect, if coal was becoming increasingly difficult to extract,
and because of this, the returns for everyone, from owners to
workers, was low.
World
War I, with its increased debt (which was in part used for more
wages), helped the situation temporarily. But after World War I, the
Great Depression set in, and with it, much higher suicide rates.
The
Great Depression is the kind of result we would expect if UK no
longer had enough coal to make the goods and services it had made
previously. The lower production of goods and services would likely
be paired with fewer jobs that paid well. In such a situation, it is
not surprising that suicide rates rose. Suicide rates decreased
greatly with World War II, and with all of the associated borrowing.
Looking
more at what happened in the 1920 to 1940 period, Ugo
Bardi tells us that
prior to World War I, UK exported coal to Italy. With falling coal
production, UK could no longer maintain those exports after World War
I. This worsened relations with Italy, because Italy needed coal
imported from UK to rebuild after the war. Ultimately, Italy aligned
with Germany because Germany still had coal available to export. This
set up the alliance for World War II.
Looking
at the US, we see that World War I caused favorable conditions for
exports, because with all of the fighting, Europe needed to import
more goods (including food) from the United States. After the war
ended in 1918, European demand was suddenly lower, and US commodity
prices fell. American farmers found their incomes squeezed. As a
result, they cut back on buying goods of many kinds, hurting the US
economy.
One
analysis of the economy of the 1920s tells
us that from 1920 to 1921, farm prices fell at a catastrophic rate.
“The price of wheat, the staple crop of the Great Plains, fell by
almost half. The price of cotton, still the lifeblood of the South,
fell by three-quarters. Farmers, many of whom had taken out loans to
increase acreage and buy efficient new agricultural machines like
tractors, suddenly couldn’t make their payments.”
In
1943, M. King Hubbert offered the view that all-time
employment had peaked in 1920,
except to the extent that it was jacked up by unusual means, such as
war. In fact, some
historical data shows that
for four major industries combined (foundries, meat packing, paper,
and printing), the employment index rose from 100 in 1914, to 157 in
1920. By September 1921, the employment index had fallen back to 89.
The peak coal problem of UK had been exported to the US as low
commodity prices and low employment.
It
was not until the huge amount of debt related to World War II that
the world economy could be stimulated enough so that total energy
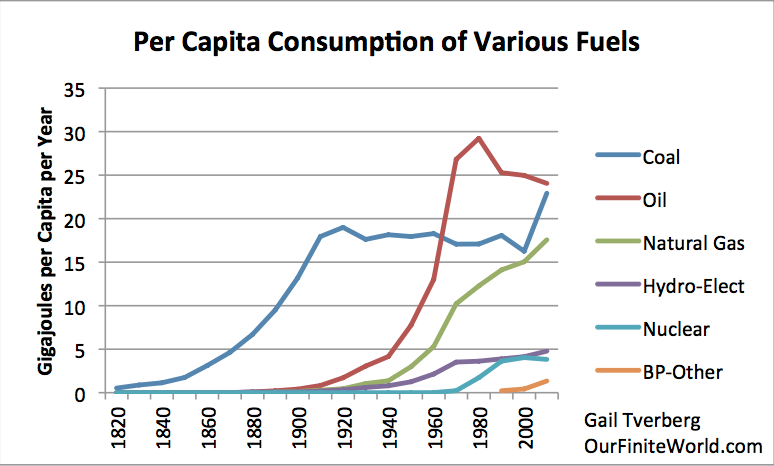
production per capita could continue to rise. The use of oil
especially became much greater starting after World War II. It was
the availability of cheap oil that allowed the world economy to grow
again.
Figure
16. Per capita energy consumption by fuel, separately for several
energy sources, using the same data as in Figure 1.
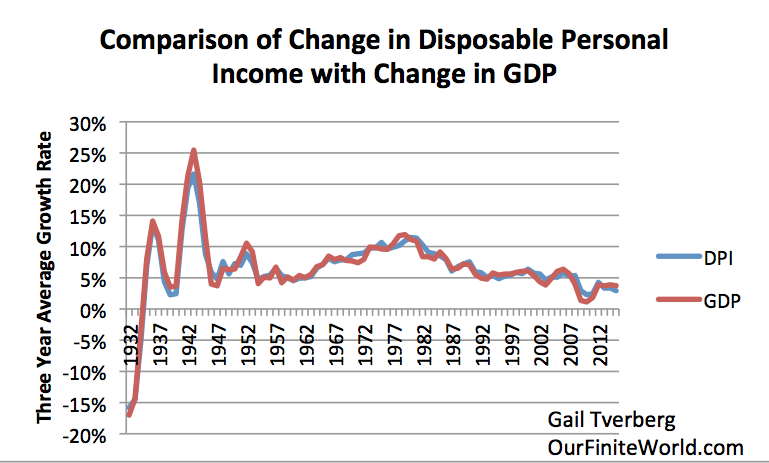
The
stimulus of all the debt-enabled spending for World War II seems to
have been what finally encouraged the production of the oil needed to
pull the world economy out of the problems it was having. GDP and
Disposable Personal Income could again rise (Figure 17.)
Figure
17. Comparison of 3-year average change in disposable personal
income with 3-year change average in GDP, based on US BEA Tables
1.1.5 and 2.1.
Furthermore,
total per capita energy consumption began to rise, with growing oil
consumption (Figure 1). This growth in energy consumption per capita
seems to be what allows the world economy to row.
I
might note that there is one other exceptional period: 1980 to 2000.
Space does not allow for an explanation of the situation here, but
falling per capita energy consumption seems to have led to the
collapse of the former Soviet Union in 1991. This was a different
situation, caused by lower
oil consumption related to efficiency gains.
This was a situation of an oil producer being “squeezed out”
because additional oil was not needed at that time. This is an
example of a different type of economic disruption caused by flat per
capita energy consumption.
Figure
18. World per Capita Energy Consumption with two circles relating to
flat consumption. World Energy Consumption by Source, based on
Vaclav Smil estimates from Energy Transitions: History, Requirements
and Prospects (Appendix) together with BP Statistical Data for 1965
and subsequent, divided by population estimates by Angus Maddison.
Conclusion
There
have been many views put forth about what caused the Depression of
the 1930s. To my knowledge, no one has put forth the explanation
that the
Depression was caused by Peak Coal in 1913 in UK, and a lack of other
energy supplies that were growing rapidly enough to make up for this
loss. As UK “exported” this problem around the world, it led to
greater wage disparity. US farmers were especially affected; their
incomes often dropped below the level needed for families to buy the
necessities of life.
The
issue, as I have discussed in previous posts, is a physics issue.
Creating GDP requires energy; when not enough energy (often fossil
fuels) is available, the economy tends to “freeze out” the most
vulnerable. Often, it does this by increased wage disparity. The
people at the top of the hierarchy still have plenty. It is the
people at the bottom who find themselves purchasing less and less.
Because there are so many people at the bottom of the hierarchy,
their lower purchasing power tends to pull the system down.
In
the past, the way to get around inadequate wages for those at the
bottom of the hierarchy has been to issue more debt. Some of this
debt helps add more wages for non-elite workers, so helps fix the
affordability problem.
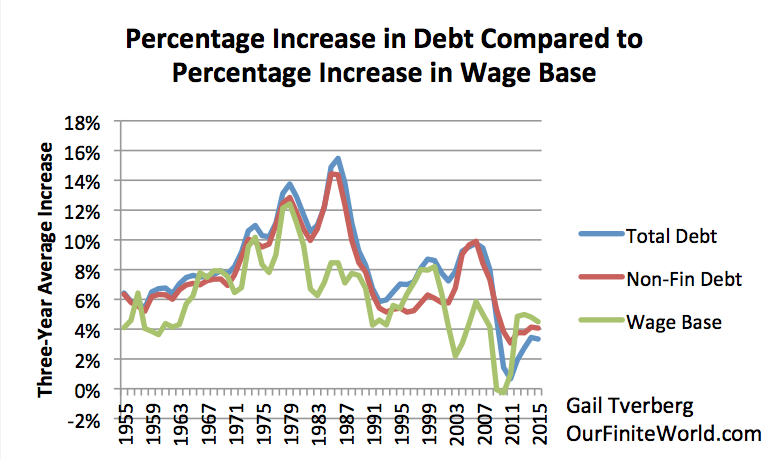
Figure
19. Three-year average percent increase in debt compared to three
year average percent increase in non-government wages, including
proprietors’ income, which I call my wage base.
At
this time, we seem to be reaching the point where, even with more
debt, we are running out of cheap energy to add to the system. When
this happens, the economic system seems more prone to fracture.
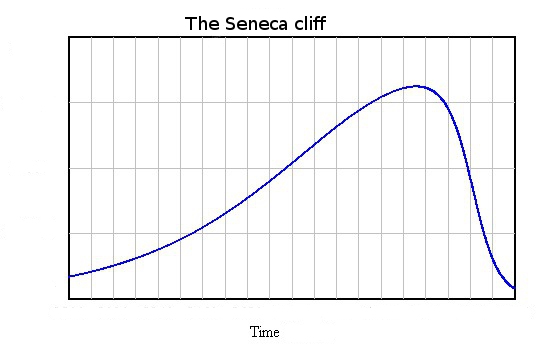
Ugo Bardi calls the situation “reaching the inflection point in a
Seneca Cliff.”
Figure
20. Seneca Cliff by Ugo Bari
We
were very close to the inflection point in the 1930s. We were very
close to that point in 2008. We seem to be getting close to that
point again now.
The
model of the 1930s gives us an indication regarding what to expect:
apparent surpluses of commodities of all types; commodity prices that
are too low; a lack of jobs, especially ones that pay an adequate
wage; collapsing financial institutions. This is close to the
opposite of what many people assume that peak oil will look like. But
it may be a better representation of what we really should expect.

 Posts
Posts