Showing posts with label coal. Show all posts

Sunday, 20 December 2020

China's Worsening Electricity Shortages

 China Endures Worsening Electricity Shortages In Name Of Punishing Australia

Zero Hedge,

19 December, 2020


Coal is among the latest in a growing list of major Australian exports hit by severe restrictions in China, also including commodities like cotton, timber wine, lobster, and barley. While Chinese citizens might be able to forgo luxuries for a while like Aussie wine as well as lobster, coal is quite another thing especially given the country is currently facing a broad coal shortage. 

Here's how Chinese state media publication Sixth Tone described it:

Several cities in at least three provinces in central and southern China are experiencing a power crunch, with some local governments beginning to ration power use during peak timesaccording to multiple domestic media reports.

Entire provinces are taking the surprise step of limiting industrial power and even cutting heating in government offices, expected to take effect Dec.11, according to the publication. This also includes limits imposed on entertainment and shopping venues like malls and move theaters, which is impacting their hours of operation.

So ultimately this shows Beijing is so intent and devoted to punishing Australia that it will make its own citizens suffer in the downward spiraling spat that began last Spring when Canberra joined US calls for an independent probe into China's handling of COVID-19 as the place of origin for the pandemic.

As it stands coal is Australia's third-largest export to China and is the latest to face severe and opaque import regulations, as Reuters revealed early this week: "Chinese media outlets including The Global Times and Caixin on Monday reported China’s top economic planner had granted approval to power plants to import coal without clearance restrictions, except for Australia," according to the report.

The restrictions have reportedly left dozens of coal-laden ships idling off China's ports

Australian Trade Minister Simon Birmingham on Tuesday said he was "deeply troubled" by new reports in Chinese state media that the country's top economic planner has effectively banned certain coal imports from Australia

Sixth Tone notes further that China appears ready and willing to endure rolling power interruptions amid the coal shortfall:

Since Tuesday, similar rules have been implemented in the neighboring Jiangxi province, with authorities warning of the possibility of power interruptions during morning and late-afternoon peak periods. Meanwhile, the central Hunan province rolled out a series of power restrictions for businesses and factories on Dec. 8, urging them to consume less power. And Hubei, another central province, has expressed concerns over power usage due to tight coal supplies.

Reports of regional energy shortfalls come as China is aiming to curb its production of coal — a high-polluting fossil fuel that’s used to heat homes and power thermal plants — in order to meet its ambitious climate goal to become carbon-neutral by 2060. Several provinces that previously relied on coal-fired boilers have switched to cleaner forms of energy, including gas and electricity.

Chinese officials have repeatedly urged dialogue while demanding Australian leaders back off their biting anti-China criticism especially over the handling of the virus, while for Australia's part it is taking the trade spat to the World Trade Organization (WTO) in what's seen as the next big though not unexpected escalation.

Thursday, 31 January 2019

CONFIRMED: China's methane emissions are through the roof

We have been fed propaganda on how much China is doing to reduce its emissions. Of course it was always a lie as any quick checking of the data will show.

There is a history of local communist governors lying to the central authorities. This is on an epic scale.

Margo and I have been covering methane emissions on a regualr basis for the last 6 months and although we have been concentrating on the Arctic it has been extremely difficult to overlook both China and India.

Question: when are they going to mention India's emissions?

China’s methane emissions rise despite tougher laws, satellite data shows


29 January, 2019

Methane emissions from coal mining in China have risen despite stricter government regulations that aimed to curb the greenhouse gas, satellite data shows.
The data, which is published in Nature Communications, finds China’s methane emissions rose by 1.1m tonnes a year between 2010 and 2015. This could account for up to a quarter of the rise in methane emissions seen globally over that period, the study finds.
China is the world’s largest emitter of methane – a greenhouse gas that is 34 timesmore potent than CO2 over a 100-year period.
The findings show how satellites can be used to pinpoint greenhouse gas emissions “from misbehaving industries that nobody may have suspected”, the lead author tells Carbon Brief.

Methane matters

Methane is the second largest contributor to human-caused global warming after CO2.
Globally, the largest driver of human-caused methane emissions is agriculture – particularly livestock and rice production. The second main driver is fossil fuel production, which allows underground methane to “escape” into the atmosphere during the drilling, extraction and transportation process.
(Methane is also released by several “natural processes” in wetlandsthawing permafrost and freshwater lakes.)
China is the world’s largest producer and consumer of coal. When coal is mined, methane can escape from the “coal seam” – the name given to a layer of coal in the earth that is thick enough to be exploited, says study lead author Prof Scot Miller, a researcher of greenhouse gases and air pollution from John Hopkins University in Baltimore. He tells Carbon Brief:
Coal forms underground over long geological time scales and methane is often produced in the coal seams during this process. The methane remains trapped in the coal seam, but it can be released into the atmosphere if the coal seam is mined.”
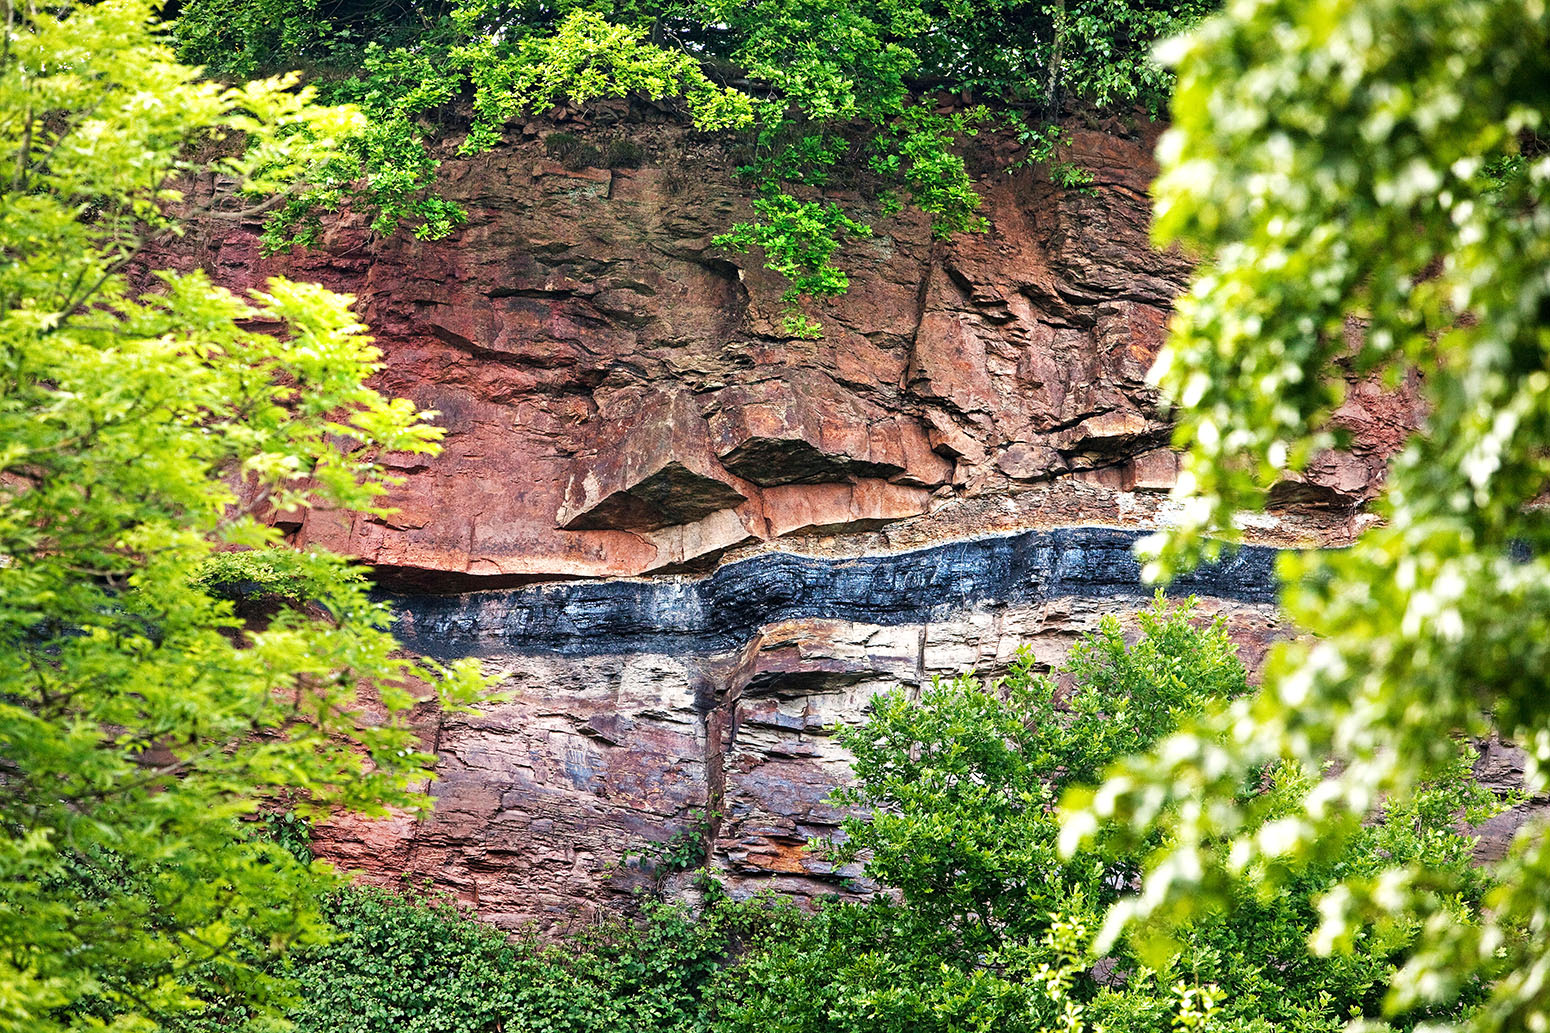
Geological outcrop with overground coal seam, Witten, Germany. Credit: imageBROKER / Alamy Stock Photo. EX3DYE
Geological outcrop with overground coal seam, Witten, Germany. Credit: imageBROKER / Alamy Stock Photo.
However, there are ways to reduce the methane emissions from the mining process, he adds:
One option is to burn or ‘flare’ the methane. This process converts methane to CO2, a greenhouse gas that is much less potent per molecule. Another option is to capture this gas and use it to generate electricity or heat homes.”
(Methane flaring has faced criticism for being “wasteful”. In the US, Obama-era environmental regulations sought to minimise the practice – though the new rules were later rolled back by the Trump administration.)
China’s government has laid out “ambitious plans” to pursue these options, Miller says. In its 12th five-year plan, which set out policies for 2011-15, the Chinese government aimed to recover and utilise 5.6m tonnes of methane from coal mining. By 2020, it aims to recover 13.2m tonnes of methane.
But the satellite data collected by the research team suggests that these regulations have been “unsuccessful” in curbing methane emissions from mining, Miller says:
We found that China’s methane emissions have been increasing ‘business as usual’ – and these increases are likely driven by increasing emissions from coal mines. In other words, China’s methane regulations have not had a detectable impact on the country’s methane emissions.”

Satellite sentinels

To study methane emissions from China and other parts of East Asia, the research team used data from the Greenhouse Gases Observing Satellite (GOSAT). The satellite was launched in 2009 by the Japan Aerospace Exploration Agency. (In 2016, Carbon Brief published an interactive showing how satellites, including GOSAT, are used to monitor climate change.)
The satellite detects levels of methane in the atmosphere using infrared sensors. This information is then analysed by statistical models to link it to changes in methane observed at the Earth’s surface, Miller says.
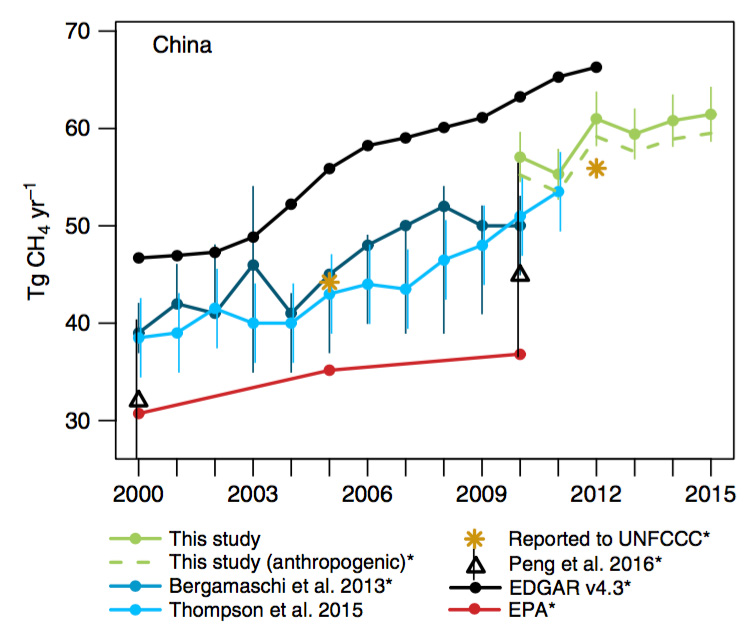
The results show that China’s methane emissions rose at a rate of 1.1m tonnes a year between 2010 and 2015. This is indicated on the chart below, which shows the results from this study (green) alongside other previous estimates.
Line graph showing Methane emissions from China, according to this study (green; anthropogenic emissions in dashed green), Bergamaschi et al. (2013) (dark blue), Thompson et al. (2015) (light blue), Peng et al. (2016) (triangles), the Emissions Database for Global Atmospheric Research (EDGAR) (black), the US Environmental Protection Agency (EPA) and official statistics reported to the United Nations Framework Convention on Climate Change (UNFCCC) (stars). Note: the y-axis does not begin at zero. Source: Miller et al. (2019)
Methane emissions from China, according to this study (green; anthropogenic emissions in dashed green), Bergamaschi et al.(2013) (dark blue), Thompson et al. (2015) (light blue), Peng et al. (2016) (triangles), the Emissions Database for Global Atmospheric Research (EDGAR) (black), the US Environmental Protection Agency (EPA) and official statistics reported to the United Nations Framework Convention on Climate Change (UNFCCC) (stars). Note: the y-axis does not begin at zero. Source: Miller et al. (2019)
Since 2007, global methane emissions have been increasing at an annual rate of between 5m and 8m tonnes a year, the study says. This means the increase seen in China could represent between 11% and 24% of the global rise in methane emissions.
The researchers compared their results to previous studies looking at China’s methane emissions from 2000-10 (shown on the chart above). This comparison shows that “China’s emissions have been increasing at the same rate as during earlier years, in spite of the government’s coal mining regulations”, Miller says.
One estimate – from the Emissions Database for Global Atmospheric Research (EDGAR; black line on chart) – found China’s methane emissions to be even higher from 2010 to 2012.
This estimate uses a “bottom-up” approach – which involves recording methane emissions from the ground, says Prof Greet Janssens-Maenhout, a project leader of EDGAR at the European Commission’s Joint Research Centre. She tells Carbon Brief:
I think this is a nice [study] and, in fact, the bottom-up estimates and top-down estimates [from this study] don’t differ that much. There is much more agreement now than there was in the past.”
Also notable is that the estimates for China’s methane emissions in 2012 from both this “bottom-up” approach and the new study are higher than the figure reported by China to the United Nations Framework Convention on Climate Change (UNFCCC).
(China is a “non-Annex I” country and so not required to report its greenhouse gas emissions to the UNFCCC on an annual basis.)

Detecting cow fields

The modelling technique also allowed researchers to decide whether methane detected by the satellite had originated from a coal mine, a rice paddy, a cow field or a natural source, such as a wetland, Miller says.
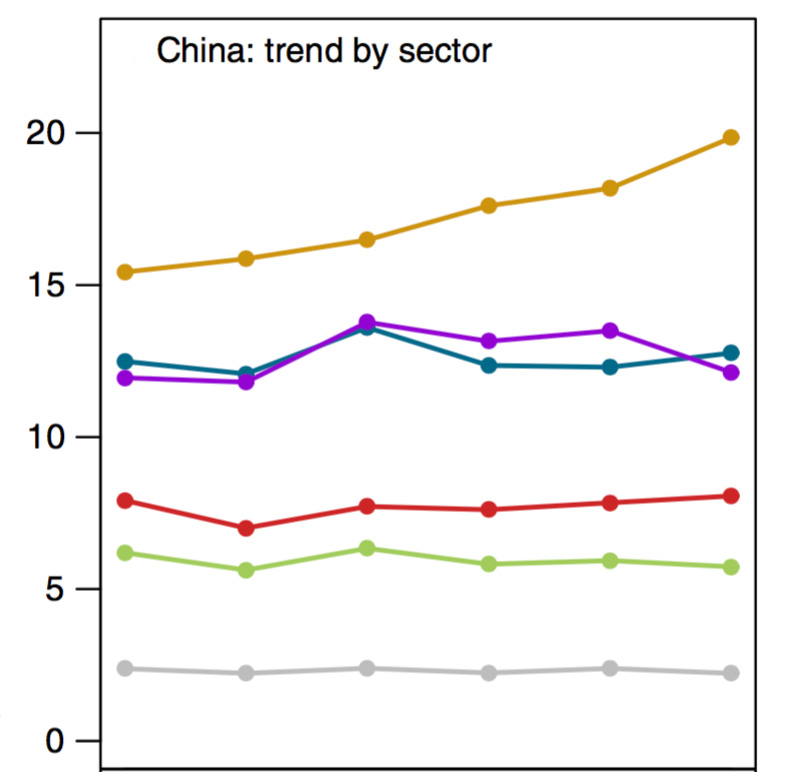
The chart below shows a breakdown of methane emissions in China by sector. The sectors considered include coal (orange), rice (purple), agriculture (turquoise), waste (red), oil and gas (green) and natural sources (grey).
Line graph showing Methane emissions (in millions of tonnes) in China between 2011 and 2015 from coal (orange), rice (purple), agriculture (turquoise), waste (red), oil and gas (green) and natural sources (grey). Source: Miller et al. (2019)
Methane emissions (in millions of tonnes) in China between 2011 and 2015 from coal (orange), rice (purple), agriculture (turquoise), waste (red), oil and gas (green) and natural sources (grey). Source: Miller et al. (2019)
The results suggest that coal mining was the main driver of the rise in methane emissions in China from 2011-15, Miller says:
We saw the largest increases in methane emissions from regions with a lot of coal production and from regions where the coal seams are known to have large amounts of trapped gas.
Methane is also emitted by agriculture – by cows, manure management and rice paddies. But between 2010 and 2015, coal mining in China increased enormously while rice production and the number of cows did not. These two lines of evidence indicate that coal mining has probably been driving recent increases in methane emissions from China.”

Missed targets

The findings suggest that China’s “ambitious benchmarks, regulations and incentives” for slashing methane emissions from coal mining had little effect from 2010-15, the authors say.
This could be down to “insufficient infrastructure”, “inadequate technology” and “inadequate or poorly-designed policies”, the authors write in their research paper.
For example, “most coal mines are located in remote mountainous areas, areas that are poorly connected to cities or natural gas infrastructure” – which is needed to recover methane from coal mines, the authors say.
In addition, some policies to promote methane utilisation may have “backfired”, the authors note: “Government policy requires that all mines utilise drained gas with greater than 30% methane content…[There is] anecdotal evidence that mine operators may be diluting drained gas to circumvent the requirement.”
The new findings highlight how using satellites can give an unbiased picture of how greenhouse gas emissions are changing from country to country, Miller says:
Countries like the US and China estimate their emissions by tallying the number of coal mines, the number of cows, or the number of natural gas wells. However, these inventories can overlook sources or underestimate emissions from misbehaving actors.
By contrast, greenhouse gas measurements in the atmosphere can detect emissions across an entire landscape, including emissions that government inventories overlook and emissions from misbehaving industries that nobody may have suspected.”
The evidence presented in the study is “alarming”, says Dr Michelle Cain, a science and policy research associate at the Oxford Martin School at the University of Oxford, who was not involved in the research. She tells Carbon Brief:
This is useful [for] piecing together the full story of what is driving global atmospheric methane upwards. Increasing levels of methane in the atmosphere mean additional warming, so this is an important question to answer if we want to work out whether we are on track to limit warming to 1.5 or 2C.”
Now compare this with emissions coming out of Europe and Eurasia


Tuesday, 19 June 2018

The road to extinction through renewables


H/T Dr. Mike Joy for drawing my attention to this

The renewable road to extinction


17 June, 2018

When contemporary economists, politicians and journalists proclaimed the imminent arrival of “peak oil demand,” they were hardly espousing a new idea.  In fact, they were merely repeating an idea that was doing the rounds in the 1850s – an idea that was thoroughly debunked.

In those days, it was coal rather than oil demand that was supposedly peaking.  The first phase of British industrialisation was complete.  A new network of steam railways had been constructed.  And the Atlantic was crossed with regularity by a new fleet of steam ships.  The quest for efficiency had begun.
As new and increasingly efficient steam technologies emerged, philosophers of the day began to worry about the impact of peak demand on the British coal industry.  Pretty soon, they argued, the industrial economy’s need for coal would fall.  When then would happen to all of those coal miners who would suddenly be without work?
As we now know, “peak coal demand” was a fantasy.  The British – and later global – demand for coal just kept on growing.  It was actual “peak coal” – the point when coal extraction falls – that was the real threat to the British coal industry; not the technologies that were powered by coal.  In 1913, British coal output reached its peak; setting the stage for the periodic outbreaks of strikes and disputes that marred the UK industrial relations landscape throughout the twentieth century.
In his 1865 book, The Coal Question, mathematician William Stanley Jevons was the first to explain why peak coal demand did not put in an appearance in the nineteenth century.  Jevons observed that the paradoxical consequence of developing increasingly efficient technologies was that people used more of the coal that the technology purported to save.  Why was this so?  Jevons observed that fuel-efficient technology serves to lower the price of the fuel being conserved.  The result is that more people can then afford to burn that fuel.  As a consequence, across the economy as a whole, fuel consumption rises.

The recent “peak oil demand” claims are essentially the same as those made about coal in the mid-nineteenth century.  A new generation of energy-efficient electrical technologies – including, especially, electric cars – will supposedly wean us off our addiction to oil; ushering in a new, bright green, zero-carbon “knowledge economy.”
What makes this fantasy so persuasive to people in the West is the way globalisation has geographically separated extraction, manufacturing and consumption.  Those of us who are fortunate enough to live in the regions of the world that do most of the consuming, can kid ourselves that we have transcended the dirty, carbon-spewing economies of the nineteenth and twentieth centuries.  

As we sit in front of our energy-efficient computers or staring into our energy-efficient smartphones, it is easy to believe that our energy consumption has fallen dramatically.  Look for a moment at the energy consumption in the data centres that enable this activity and we begin to see that energy is still a problem.  

However, even this pales into insignificance against the energy that was consumed in the process of extracting the minerals needed to build and maintain that infrastructure and those energy-efficient devices; or the energy involved in manufacturing and transporting the finished goods.

The reality is that our carbon/pollution footprints are even greater today than ever.  We have merely offshored our pollution to someone else’s country.
One way we know this is by examining the effect of Western economic crises – such as the one in 2008 – on the amount of carbon dioxide emitted into the atmosphere:
Global carbon emissions 2007-17Source: BP Statistical Review of World Energy 2018 – my annotation

When the economies of the USA, Europe and Japan succumbed to financial chaos in 2008, the result was an immediate and large fall in global carbon dioxide emissions.  This happened because the drop in consumption in the west led to a fall in demand in the manufacturing and extractive regions of the world.  We experienced something similar between 2014 and 2016 when official statistics told us that the economy was growing at less than one percent.  The carbon emissions figures suggest that rather than economic growth, we actually experienced a minor recession during the period.

From mid-2016, however, the global economy appeared to get back to its usual polluting ways.  As Bob Dudley, Group chief executive of BP laments in the BP Statistical Review of World Energy 2018:

Prior to 2017, there had been three successive years of little or no growth in carbon emissions from energy consumption… That progress partially reversed last year. Growth in energy demand picked up as gains in energy efficiency slowed, coal consumption increased for the first time in four years, and carbon emissions from energy consumption grew.”
Dudley attributes the fall in energy consumption and carbon emissions between 2014 and 2016 to energy efficiency.  If so, then the 2017 increase confirms the Jevons paradox.  More likely, however, is that the crash in oil prices – due to falling demand in the West – in mid-2014 had finally caused economic activity to pick up in 2017; resulting in the recent upward trend in oil prices that may well cause the economy to stall once more.
In the same report, Spencer Dale, BP Group chief economist attempts to gloss over the global failure to achieve anything resembling an energy transition:
Global energy markets in 2017 took a backward step in terms of the transition to a lower carbon energy system: growth in energy demand, coal consumption and carbon emissions all increased. But that should be seen in the context of the exceptional outcomes recorded in the previous three years. Some backsliding was almost inevitable.
The road to meeting the Paris climate goals is likely to long and challenging, with many twists and turns, forward lurches and backward stumbles. To navigate our progress will require timely, comprehensive and relevant data.”
The trouble is that we are not on the road to meeting the Paris climate goals at all.  Rather, we are on the superhighway that takes us to the destruction of the one biosphere in the universe that we know to be capable of sustaining life.  That superhighway may well be lined with solar panels and wind turbines; but these, too, suffer from the Jevons paradox.
Superficially, of course, the electricity that we have generated using wind turbines and solar panels might otherwise have been generated with coal.  But this misses the deeper point – it is still energy that we have addedto our total consumption.  To illustrate this, imagine that we had, at any time in the last couple of decades, simply switched from a growing economy to a sustained economy:
World Energy Consumption 2017 Source: Global carbon emissions 2007-17 – my annotation

If we had maintained our global energy consumption at its 1992 level, we could have removed the equivalent of our entire 2017 coal, hydroelectric and renewables consumption.  If we had switched to a sustainable economy in 1998, we could have saved the equivalent of our current coal and renewables.  Even as recently as 2004 we might have saved almost the equivalent of our 2017 coal consumption.  Note also that renewables – the thin orange sliver beneath coal on the chart – have barely dented out energy mix.  Indeed, had we ceased growing the economy in 2015, we could have saved the energy equivalent of all of our renewables… which is another way of saying that renewable energy makes but a tiny difference in the grand scheme of things (the 2008 financial crisis had a bigger impact).
Worse still; modern renewables like wind turbines and solar panels account for less than three percent of global energy consumption.  Biomass is by far the biggest source of “renewable energy.”  But there is growing concern that biomass is not renewable at all. Biofuels such as the corn ethanol produced in the USA come at the expense of land that will be needed for food in future.  When the fuel inputs involved in growing, transporting and refining the corn are added up, it turns out that bioethanol uses more fossil fuels than it replaces.
Most biofuel is far more primitive, however.  It is the old pre-industrial practice of burning wood; but scaled-up to industrial levels.  Initially, the idea had been that sawdust and wood shavings from the timber industry would be formed into pellets that could be burned in coal power stations such as Drax in the UK.  Since this was wood waste, and since the trees were being replaced, this could be treated as renewable.  Inevitably, as demand for this supposedly “green” energy grew, so supplies of waste timber were quickly exhausted.  Instead, the wood burning power stations turned to virgin forests to feed their insatiable demand:

Huge areas of hardwood forest in the state of Virginia are being chainsawed to create ‘biomass’ energy in Britain as the government attempts to reach targets to reduce greenhouse gas emissions in efforts to tackle climate change, an investigation by Channel 4 Dispatches has found…
The power station giant claims that burning pellets instead of coal reduces carbon emissions by more than 80 percent.  However, Dispatches conducted a simple experiment at a laboratory at the University of Nottingham to compare the carbon dioxide emitted when burning wood pellets, similar to those used by Drax, instead of coal.  It found that to burn an amount of wood pellets that would generate the same amount of electricity as coal it would actually produce roughly eight percent more carbon.
Biomass is viewed as ‘carbon neutral’ under European rules. This means Drax is not obliged to officially report the carbon emissions coming out of its chimney stack. Dispatches calculated that if Drax were to report on the full extent of its emissions it would show that last year they amounted to 11.7 million tonnes of CO2.”
Once again, we see the Jevons paradox in action, as an energy source that is supposed to curb our energy consumption serves only to increase it.  Indeed, putting a green gloss on what is a highly polluting energy source adds to the problem because lawmakers are persuaded to subsidise it and legislate in its favour.
The truth is – and this is clearly evident in the two charts above – that there are but two ways of cutting carbon emissions.  In 2008, we demonstrated that economic contraction causes energy consumption, and thus carbon emissions to fall.  Similar, although smaller, falls were experienced when the Soviet Union collapsed in 1991 and in the wake of the 1929 Wall Street Crash.  Understanding this helps us understand why politicians sign up to sweeping agreements to reduce carbon emissions while behaving as if climate change was not occurring.  Given the choice between economic collapse today and a global holocaust at some unspecified time in future, they’ll (we’ll) take the economy every time.
What about the second way of cutting carbon emissions?  This is the real killer.  The alternative to reversing the economy is to find some yet-to-be-invented energy source or energy-harnessing technology that can provide us with vastly more energy than fossil fuels, and that is carbon-negative.  Such energy sources exist in the shape of uranium, plutonium and thorium; each of which has an energy density hundreds of thousands of times greater than oil.  But even our best scientific and engineering establishments have no idea how to use that energy potential for anything more than boiling giant pressure cookers to make highly expensive, nineteenth century steam.  Like nuclear fusion, technologies to unleash the full energy potential of nuclear are so far in the future as to be irrelevant.

Meanwhile, wind, solar, tides and waves have so little energy density that they are simply too expensive to concentrate on more than a (relatively) small scale.  Certainly, we have, collectively, made a Herculean effort to de-carbonise our economy through a combination of renewable energy technologies and energy efficiency measures.  We have spent billions of dollars and we have produced unsustainable exponential growth in this area.  But it has failed.  Even as we have developed and deployed renewables, we have consumed energy at an even greater rate.

The road we are on involves little more than deploying the green window-dressing of wind and solar while desperately hoping that someone will figure out a way of generating energy that simultaneously sucks carbon dioxide out of the atmosphere.  It is, to say the least, an incredibly dangerous path to follow; because if no such technology emerges the environmental devastation that follows will be on a par with the extinction of the dinosaurs.  But the alternative path – of collapsing the economy – is far too immediate in its impact for anyone with the power of decision to take it… dinosaurs indeed!

Sunday, 1 April 2018

Murder at the Pike River Mine


I have always known there was a complete cover-up about the 2010 PikeMine River disaster on the West Coast of New Zealand but I never knew the extent of it until I heard this interview with Dr.Jacob Cohen by David Gosling of Public Enquiry in Britain.


Public enquiries have always been used by Commonwealth countries to cover up matters like this but as far as I know this is a first for this country along with the corrupt government of John Key.

MURDER AT PIKE RIVER MINE – THE TRUTH YOU WON’T FIND IN MAINSTREAM MEDIA

Download pdf of the book HERE


What a heart breaking story this is. The angst of the families, their loved ones so near yet so very far. Now they plan to seal the mine off. When this story was initially over and we knew there was no hope they would ever emerge from the mine alive, and when reporters began to dig below the surface, so the shocking facts began to emerge. The miners’ working environment had been unsafe for some time. For a thorough exposé of the truth of this whole affair, download and read Murder at Pike River Mine’ by Dr Jacob Cohen. You will not of course find this information in mainstream news. Are you joining any dots? 

The incestuous collusion between corrupt fascist, international corporations, banks, global mining companies and compliant politicians – and how the inexorable love of money by those who run them supersedes everything else” 

What was the real truth behind the Pike River coal mine disaster in NZ killing 29 men? Was the tragedy simply an ‘accident’ or was it premeditated murder? Involving people at the highest level of the NZ Government and international business and banking community? Does this case have implications for the world?”

---
Dr Jacob Cohen 

https://envirowatchrangitikei.wordpress.com/2016/11/29/murder-at-pike-river-mine-the-truth-you-wont-find-in-mainstream-media/

Download pdf of the book HERE
Read more HERE

Tuesday, 4 July 2017

Hydro levels drop in unacknowledged winter drought

This Pravda-like report from Radio NZ (“Pravda-on-the -Terrace”) barely HINTS at a problem that is only going to get worse. 

I have noticed that Wellington has not really recovered from its droughts during the winter. This is confirmed by a friend having to get in water delivered to his rural property in early winter as well as an informal report pf low water table in Nelson.

Meanwhile, we are never going to be told the truth about the destruction of the Waiwhetu aqufer, probably by the building industry.

Five years ago I would have described you as mad if you had said the capital has a water problem.

Meanwhile no media in this country is going to tell the truth about this. In this context anecdote is inavaluable. 

Give me your stories.


Fossil fuel use doubles as hydro lake levels drop

New Zealand has doubled the amount of fossil fuel it uses to make electricity, new figures show.
Genesis Energy's Huntly Power Station.Genesis Energy's Huntly Power Station. Photo: Genesis Energy
3 July, 2017
Figures from Transpower show 27.85 percent of New Zealand's electricity has been generated by burning coal or gas during the past week.

That's up from an average of 13.11 percent over the past 52 weeks.

The power is being generated mainly at Huntly, and also at Stratford, Taranaki.
Low water levels in South Island hydro lakes have meant hydro's share of generation has fallen from 65.56 percent over the past year, to 51.3 percent in the past week.

Inflows into South Island hydro lakes have been declining since March.

Transpower, which oversees the technicalities of the electricity system as well as running the national grid, has put New Zealand's electricity supply on "watch", one level above "normal', but below "alert" and "emergency".

But it has repeatedly said it does not expect the country to run out of power.

From 20 June


The much-criticised coal industry is making a minor comeback in New Zealand as dry weather deprives hydro dams of water in the South Island.