Showing posts with label carbon dioxide. Show all posts

Wednesday, 20 May 2020

Is it true that carbon emissions have fallen with the lockdowns?

Lockdowns trigger dramatic fall in global arbon emissions. Really??

This appeared in the Guardian today:


This is the essence of what the article I saying:

Carbon dioxide emissions have fallen dramatically since lockdowns were imposed around the world due to the coronavirus crisis, research has shown.


Daily emissions of the greenhouse gas plunged 17% by early April compared with 2019 levels, according to the first definitive study of global carbon output this year.

The findings show the world has experienced the sharpest drop in carbon output since records began, with large sections of the global economy brought to a near standstill. When the lockdown was at its most stringent, in some countries emissions fell by just over a quarter (26%) on average. In the UK, the decline was about 31%, while in Australia emissions fell 28.3% for a period during April.

And comes along with this graph - 


It came along with the following comment on Facebook:

I’m disappointed with the source of this data. The Guardian got their data from publication funded via advertising $ by Fortune 500 companies. C02 is just one of about 25 gases causing climate change. Humans are responsible for most of it and we are almost at the equivalent of 500 ppm when all of those are added in the overall picture. We are toast already. “


I concur, but will go even further.

I suspect that the figures that are given reflects what nations are telling the Agencies.

This is the reality of CO2 levels at Mauna Loa - it is HIGHER than it was a year ago.

It is 416.90 today.


Just a few weeks ago it reached almost 419 ppm compared with 414 ppm on the same day last year ( I neglected to take a screenshot and when I went back the data would not load)


Also look at the data for Eurasia from Copernicus.


None of it seems to bear out the claims from the Guardian article.


I remember a conversation I had with Paul Beckwith a few years ago after the Fort McMurray fires in Canada. I asked him about the contradiction between countries reporting declining CO2 levels and the actual situation of increasing concentrations.

What Paul told me at the time is that he feared it might be an indication that it may indicate that concentrations in the atmosphere might be coming from natural sources such as forest fires - in other words a positive feedback.

That is what I strongly suspect is the case here. None. of the data supports anything otherthing other than a deterioration of the climate situation and the state of the ice in the Arctic this melt season may well be the "proof in the pudding".


I shall be watching this but probably not as closely as in previous years.

P.S.

History

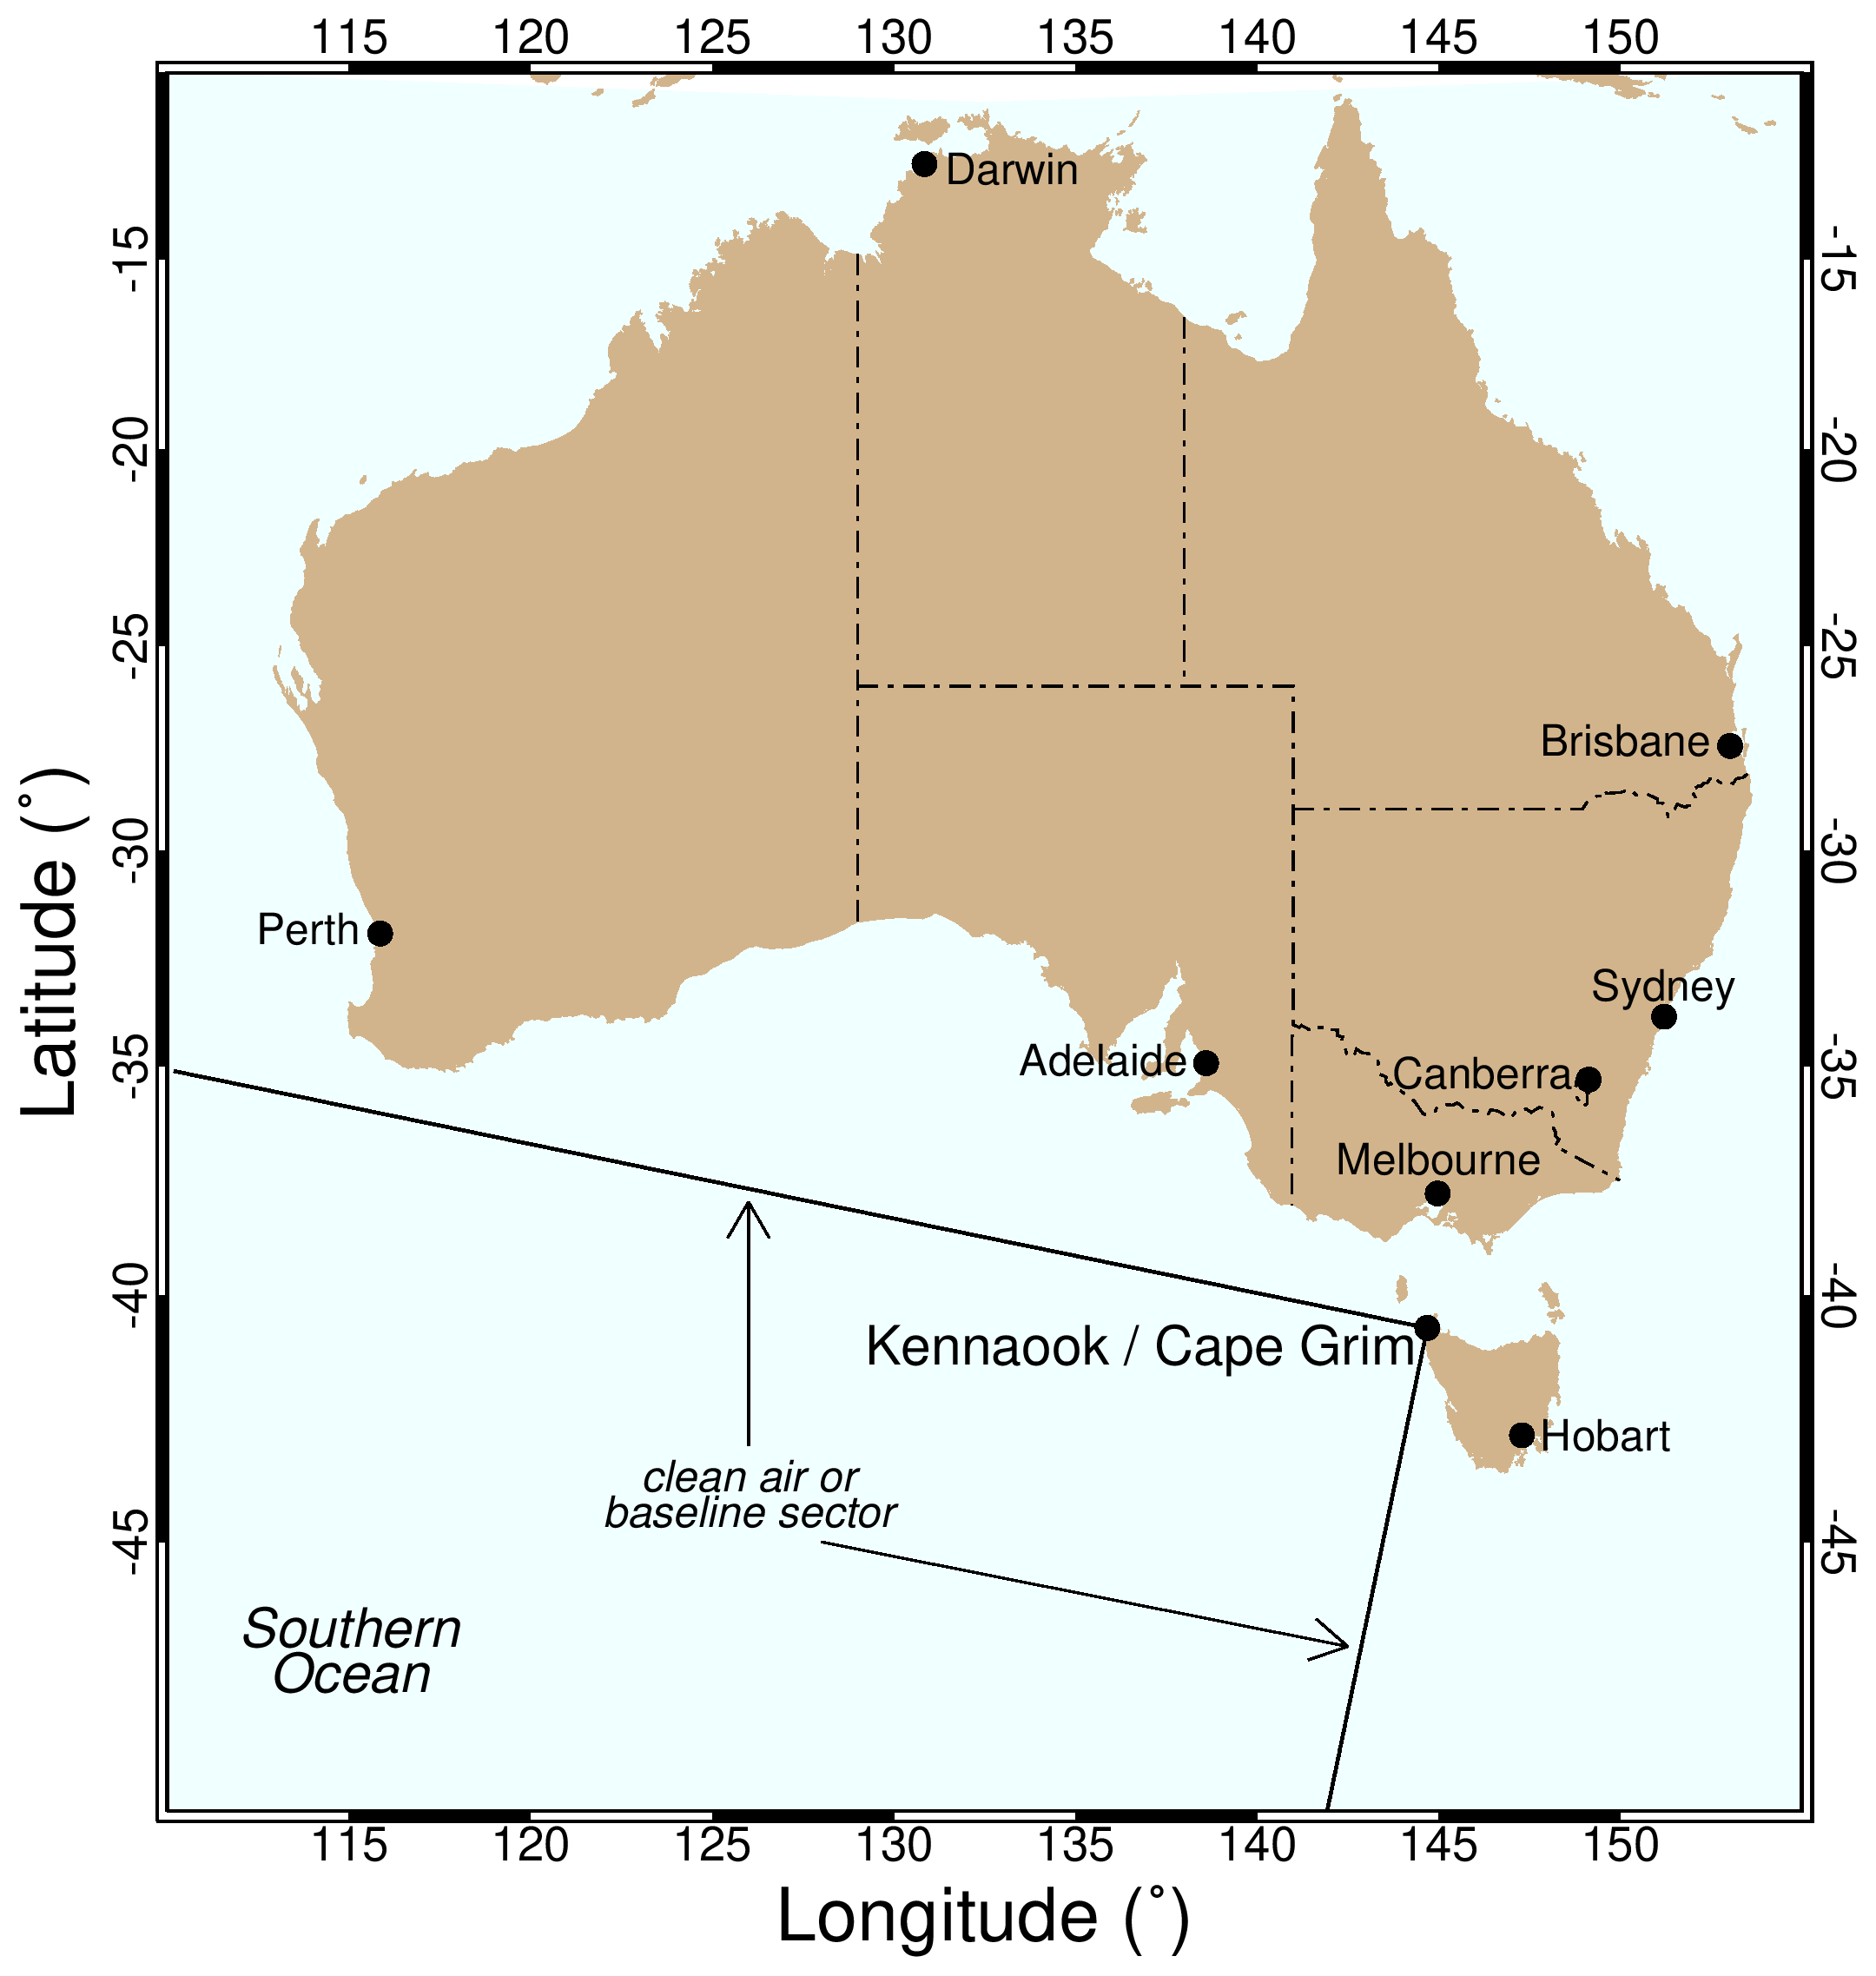
The Cape Grim program originated from a commitment by the Australian Government to the United Nations Environment Program in the early 1970s to monitor and study global atmospheric composition for climate change purposes. As a result, the Cape Grim Baseline Air Pollution Station (CG BAPS) first began measuring the composition of the atmosphere in April 1976 and has been in continuous operation since that date.
Map of Australia with the Cape Grim air sampling station identified.
The Cape Grim station is positioned just south of the isolated north-west tip (Woolnorth Point) of Tasmania.
Cape Grim is a joint responsibility of the Bureau of Meteorology (BoM) and the Commonwealth Scientific and Industrial Research Organisation (CSIRO). The BoM funds and operates the CG BAPS. CSIRO is responsible for the quality of the data and provides analysis, interpretation and modelling of the results. All data are made available to interested parties – Australian government agencies, industry, the public and international agencies.
Cape Grim data are more valuable than ever in understanding how our atmosphere is changing, as we track progress towards the goals of the Paris Agreement.
https://www.csiro.au/en/Research/OandA/Areas/Assessing-our-climate/Latest-greenhouse-gas-data?fbclid=IwAR328str47bmCKm-IY-XTiXFcClnFKuX8DSJd7e3reuIFktk2e0SOWbITBE

Saturday, 11 April 2020

CO2 reaches almost 418ppm in midst of worldwide lockdown


Record levels of CO2 at 


Mauna Loa


This is unbelievable: despite the decline in the emissions, the Mauna Loa data 


show an INCREASE in CO2 concentrations of 1 ppm PER DAY during the last 


two days!


Let's hope it is a glitch in the data, because if it were to keep going like this, 


you can stop worrying about the coronavirus

Thursday, 23 January 2020

CO2 levels at Mauna Loa increase dramatically


CO2 emissions reach 415 ppm; this time last year they were 413 ppm.


"This is phenomenal. To reach the highest ever recorded measurement of CO2 in the atmosphere in January - a full 3 months before the annual maximum is expected. The previous record was 415.70 ppm on 15 May 2019."
No photo description available.

Tuesday, 21 January 2020

Yielding a point to climate change deniers because of mainstream lies


CO2 is a pollutant”
A point I had to yield to the climate change deniers


Usually it is fairly easy to counter any disinformation coming from climate change deniers.

One of the arguments they use is that CO2 is not a pollutant and is important for photosynthesis.

I wrote a fairly “off-the-cuff” rejoinder (to comments by Vinny Eastwood on Facebook) pointing out that no one is saying it is a pollutant because it is a trace gas that is very important in maintaining the thermal balance of the atmosphere -too little and we freeze, too much and we burn, put quite simply.

I decided, in a free moment to check for myself and imagine my HORROR when I discovered that conventional websites are saying just that

CO2 is an air pollutant”


I chose this item from "Skeptical Science":


The US Clean Air Act was incorporated into the United States Code of Federal Regulations, Title 42, Chapter 85. Its Title III, Section 7602(g) defines an air pollutant:

The term “air pollutant” means any air pollution agent or combination of such agents, including any physical, chemical, biological, radioactive (including source material, special nuclear material, and byproduct material) substance or matter which is emitted into or otherwise enters the ambient air.

***

This is preposterous.

CO2 is indeed an important trace gas and we could not live without it. It is is CO2 that is turned into oxygen by plants in photosynthesis.

It is  an incredibly important trace gas for maintaining the energy balance of the planet, belied by its small amount in the atmosphere (we don't breathe, or use in any way that I know of, the nitogen which accounts for 78 percent of the atmosphere) whereas CO2 is an important trace gas.

Wikipedia says:


Carbon dioxide (CO2) is an important trace gas in Earth's atmosphere. It is an integral part of the carbon cycle, a biogeochemical cycle in which carbon is exchanged between the Earth's oceans, soil, rocks and the biospherePlants and other photoautotrophs use solar energy to produce carbohydrate from atmospheric carbon dioxide and water by photosynthesis. Almost all other organisms depend on carbohydrate derived from photosynthesis as their primary source of energy and carbon compounds. CO2 absorbs and emits infrared radiation at wavelengths of 4.26 Âµm (asymmetric stretching vibrational mode) and 14.99 Âµm (bending vibrational mode) and consequently is a greenhouse gas that plays a significant role in influencing Earth's surface temperature through the greenhouse effect.[1]"

The incredibly spurious claim that "CO2 is a pollutant" plays into the hands of climate change deniers who hardly get anything right.

They did, however, get this one right.

There really is no need to lie to put a point across.


Thursday, 16 January 2020

More on Copernicus' greenhouse data fraud


ALERT: Copernicus are 

manipulating data to cover 

up the true situation?


I have been unable to monitor events in the Arctic recently but Margo has done a very important analysis and shows that the data is completely different from what was there at the end of 2019 before they shut off the data for both CO2 and CH4 (and, interestingly, none of their other data.


Is there something up that they are trying to cover up?


REFERENCES


This is how it looks today on CAMS.Notice the top of Alaska.


This is how it looked at the end of December.


This is Margo's latest analysis

Analysis of New Methane & Carbon Dioxide Data on CAMS with Margo (Jan. 15, 2020)


This is her report from 2 days ago

Sulfur Dioxide, Methane & Climate Update with Margo (Jan. 13, 2020)

Methane readings on CAMS


CO2 levels at Mauna Loa were 412.38 ppm
In July they were at 412.93 ppm


And yet this is how this situation was represented back in July!

We rest our case.

I wonder what the EU technocrats at Copernicus would say.
***

I just wanted to share these comments from P.M to Margo's video:

Null school had no data for CO2 and some other data for a couple of days . Do you think that there climate data web site are being manipulated to hide what is going on in the atmosphere . It is difficult to trust any web sites when the data does not seem real . Having faith in these data website is really important , so I really don't no what to believe to accurate anymore . I am a new subscriber to your channel and it's great to find you and be able to understand what you are explaining . Thank you .

Saturday, 20 July 2019

China's "reducing" emissions debunked - they have INCREASED 53%

This propaganda, (I would could it lies) dates from 2017 - 
2 years ago. The idea that China's emissions were falling 
was always pure nonsense but one couldn't prove it.


Here they even provide a graph to 'prove' their lies.


https://insideclimatenews.org/news/28022017/chinas-co2-reduction-clean-energy-trump-us?fbclid=IwAR3El2M1WY3M0Eypw-UbATgT23qoSr-w--DoYDxdQTvpE8EkMOZOmYxkJws
https://www.reuters.com/article/us-china-carbon-idUSKCN0W900J

Now, the truth comes out

China’s greenhouse gas emissions soar 53 per cent in a decade, data shows


  • Figure for 2014 was 12.3 billion tonnes, according to carbon ‘inventory’ submitted to United Nations
  • Country is aiming to bring its total to a peak by ‘around 2030’
China̢۪s carbon emissions data is notoriously opaque, but it has to regularly submit an official inventory to the UN as a signatory to the Framework Convention on Climate Change. Photo: Reuters

SCMP,


17 July, 2019

China’s climate-warming greenhouse gas emissions hit 12.3 billion tonnes in 2014, up 53.5 per cent in just a decade, the environment ministry said on Monday, citing the country’s latest carbon “inventory” submitted to the United Nations.


China’s carbon emissions data is notoriously opaque, but as a signatory to the United Nations Framework Convention on Climate Change, Beijing is obliged to submit an official inventory to the UN on a regular basis. It has previously released figures for 2005 and 2010.

As the world’s biggest greenhouse gas producer, China is aiming to bring its total emissions to a peak by “around 2030”, though it has also pledged to show “the highest possible ambition” when it reviews its targets next year.

The 2014 figure, based on the most recent calculations by the Chinese government, includes China’s emissions of greenhouse gases such as carbon dioxide and methane, but does not make adjustments based on changes in land use or increases in forest coverage.

The environment ministry said if the impact of forests and other “carbon sinks” were taken into consideration, total emissions would have stood at 11.186 billion tonnes in 2014, still up 17 per cent from 2010.
Total net US emissions were measured at 5.74 billion tonnes of CO2 equivalent in 2017, down 0.5 per cent on the y

A study published by the Nature Geoscience journal last year estimated that China’s total emissions hit a record 9.53 billion tonnes in 2013 and then declined over the following three years.

The decline in CO2 from 2014 to 2016 came as a result of falling energy consumption, but it has since rebounded.

Record production levels in carbon-intensive sectors such as steel could mean CO2 emissions are still on the rise and could hit fresh records this year, environmental group Greenpeace said.ear, according to the country’s Environmental Protection Agency.

If you need your news to come from a US corporate source...


https://www.cnbc.com/2019/07/15/china-says-its-greenhouse-gas-emissions-soar-over-50percent-in-2005-2014.html?__source=twitter&fbclid=IwAR0W0JQMaD0-x0FsDSLJVj-qoUjb9lc4l7WmpuhbRZO5ddUjfg7oj-1J5pA

Just look at CAMS any day of the year and you can see where the emissions come from


Sunday, 5 May 2019

Carbon dioxide reaches 415 ppm


No photo description available.
Another milestone in the advance of carbon dioxide. 05 04 2019
https://scripps.ucsd.edu/programs/keelingcurve/wp-content/plugins/sio-bluemoon/graphs/mlo_two_years.png


CARBON DIOXIDE LEVELS KEEP ACCELERATING

Current CO₂ levels far exceed levels that were common during the past 800,000 years. Peak levels over the past 800,000 years were about 280 ppm.
The May 3, 2019, CO₂ level recorded by scripps.ucsd.edu at Mauna Loa, Hawaii, was 415.09 ppm. Greenhouse gas levels this high correspond with a 10°C or 18°F higher temperature than temperatures that were common in 1750.
Indeed, a 10°C or 18°F rise in temperature from preindustrial is in line with such high greenhouse gas levels, as described in the earlier post 'What Does Abrupt Climate Change Look Like?'
In fact, abrupt warming could result in a rise of 18°C or 32.4°F by 2026, as described in a recent post.
From the post 'Greenhouse Gas Levels Keep Accelerating', at:
https://arctic-news.blogspot.com/…/greenhouse-gas-levels-ke…


Thursday, 2 May 2019

Accelerated release of greenhouse gasses

Greenhouse Gas Levels Keep Accelerating

Arctic News Blog,

1 May, 2019

Carbon Dioxide

Weekly CO₂ levels at Mauna Loa, Hawaii, recently reached 413.77 ppm, while - several times recently - daily average levels exceeded 414 ppm and hourly levels exceeded 415 ppm.

Current CO₂ levels far exceed levels that were common during the past 800,000 years.
Methane
Next to carbon dioxide, there are further greenhouse gases. Methane is important, because of its high short-term potency as a greenhouse gas and because methane levels in the atmosphere have hugely risen since 1750, and especially recently, as illustrated by the image on the right.

Carbon dioxide (CO₂), methane (CH₄) and nitrous oxide (N₂O) levels in the atmosphere in 2017 were, respectively, 257%, 146% and 122% their 1750 levels.

recent study concludes that, since sudden collapse releases more carbon per square metre because it disrupts stockpiles deep in frozen layers, and since abrupt thawing releases more methane than gradual thawing does, the impact of thawing permafrost on Earth’s climate could be twice that expected from current models.

Furthermore, there is a huge and growing danger of large abrupt methane releases from clathrates contained in sediments at the seafloor of the Arctic Ocean. As illustrated by the image below, methane levels are rising and this rise is accelerating.
[ from earlier post ]
The graph shows July 1983 through October 2018 monthly global methane means at sea level, with added trend. Note that higher methane means can occur at higher altitude than at sea level. On Sep 3, 2018, methane means as high as 1905 ppb were recorded at 307 mb, an altitude at which some of the strongest growth in methane has occurred, as discussed in earlier posts such as this one.

Nitrous Oxide

Next to carbon dioxide and methane, there are further greenhouse gases, of which nitrous oxide is particularly important. Nitrous oxide is up to 300 times as  potent as a greenhouse gas as carbon dioxide and has a lifetime of 121 years. Several recent studies point at the danger of huge releases of nitrous oxide from permafrost.

According to a 2017 study by Voigt et al., Arctic permafrost contains vast amounts of nitrogen (more than 67 billion tons). Warming of the Arctic permafrost is accelerating, causing rapid thaw of permafrost soils, and this now threatens to cause huge releases of nitrous oxide to the atmosphere. The study concluded that nitrous oxide emissions in the Arctic are likely substantial and underestimated, and show high potential to increase with permafrost thaw.

recent study shows that nitrous oxide emissions from thawing Alaskan permafrost are about twelve times higher than previously assumed. A 2018 study points at the danger of large nitrous oxide releases from thawing permafrost in Tibet. Even more nitrous oxide could be released from Antarctica. The danger is illustrated by the image below, which shows that massive amounts of nitrous oxide were recorded over Antarctica on April 29, 2019.

Depletion of the Ozone Layer

In addition to being a potent greenhouse gas, nitrous oxide is also an ozone depleting substance (ODS). As the left panel of the image below shows, growth in the levels of chlorofluorocarbons (CFCs) has slowed over the years, yet their impact will continue for a long time, given their long atmospheric lifetime (55 years for CFC-11 and 140 years for CFC-12). Since nitrous oxide levels continue to increase in the atmosphere, while the impact of CFC-11 and CFC-12 is slowly decreasing over time, the impact (as an ODS) of nitrous oxide has relatively grown, as the right panel of the image below shows.
[ from an earlier post ]
Comprehensive Action

In conclusion, while it's important to reduce emissions of all greenhouse gases, reducing emissions of methane and nitrous oxide is particularly important. To reduce all such emissions, the Climate Planrecommends feebates as depicted in the image below.
[ from an earlier post ]

Links

• Climate Plan
https://arctic-news.blogspot.com/p/climateplan.html

• Permafrost collapse is accelerating carbon release, by Merritt Turetsky et al. https://www.nature.com/articles/d41586-019-01313-4

• Permafrost nitrous oxide emissions observed on a landscape scale using the airborne eddy-covariance method, by Jordan Wilkerson et al.
https://www.atmos-chem-phys.net/19/4257/2019/

• Magnitude and Pathways of Increased Nitrous Oxide Emissions from Uplands Following Permafrost Thaw, by Guibiao Yang et al.
https://pubs.acs.org/doi/10.1021/acs.est.8b02271

• Increased nitrous oxide emissions from Arctic peatlands after permafrost thaw, by Carolina Voigt et al.
https://www.pnas.org/content/early/2017/05/23/1702902114

• A rise of 18°C or 32.4°F by 2026?
https://arctic-news.blogspot.com/2019/02/a-rise-of-18c-or-324f-by-2026.html

• Care for the Ozone Layer
https://arctic-news.blogspot.com/2019/01/care-for-the-ozone-layer.html