A National disgrace. This government does not even intend to reduce emissions but to meet the pathetic targets by buying others' carbon credits
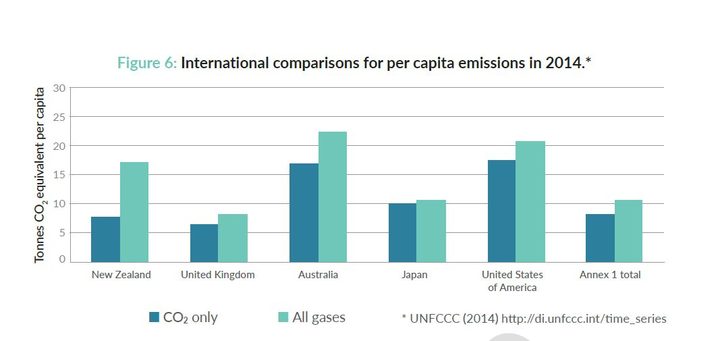
NZ seventh-worst on emissions of 41 nations
NZ seventh-worst on emissions of 41 nations
New
Zealand's greenhouse gas emissions in 2015 were 24.1 percent higher
than 1990 levels - a far cry from the country's commitment in the
Paris agreement.
26
May, 2017
Gross
greenhouse gas emissions from human activity for the year were 80.2
million tonnes of carbon dioxide equivalent, compared with 64.6
million tonnes in 1990.
Last
year, New Zealand ratified the Paris Agreement on Climate Change and
committed to reducing emissions by 11 percent on 1990 levels by 2030.
The
government has just released its Greenhouse Gas Inventory, the
official annual estimate of all human-caused emissions and removals
in New Zealand.
The country is obliged to produce it as part of its commitment under the United Nations Framework Convention on Climate Change (UNFCC) which was used to reach the Paris agreement.
 New
Zealand's gross emissions per person were the seventh highest among
the 41 industrialised countries which took commitments under the
UNFCCC - even though they have fallen 0.1 percent from 2014.
The
1990-2015 inventory is used to track how well the country is doing in
reaching its 2020 emissions reduction target - of a 5 percent
reduction from 1990 levels - not the Paris Agreement.
The
government said the country was on track to meet that target, by
using a combination of carbon credits issued in 1990 and additional
credits from Russia, Ukraine and elsewhere.
Breaking down the data
Gross
emissions includes carbon dioxide, methane and nitrogen oxide and
fluorinated gases from agriculture, energy - including transport and
electricity production, waste, and industrial processes - and product
use such as refrigeration and air conditioning and carbon dioxide
emissions from mineral, chemical and metals production.
It
also includes what is referred to as land use, land use change and
forestry, which can effectively remove emissions because vegetation
acts as a carbon sink.
Agriculture
and energy were the two sectors that contributed the most to New
Zealand's emissions profile, producing approximately 47.9 percent and
40.5 percent of the pollution respectively in 2015.
Between
1990 and 2015, agricultural emissions increased 16 percent largely
due to an 88.5 percent increase in the national dairy herd size, and
a five-fold increase in the application of fertiliser which contained
nitrogen.
There
was a 1.1 percent fall in emissions from agriculture between 2014 and
2015, when production fell because of drought conditions and a fall
in milk prices.
Emissions
from the energy sector increased 36.7 percent between 1990 and 2015
as a result of increased road use and manufacturing using fossil
fuels.
There
was also an increase in emissions from industrial and household
refrigeration and air conditioning, while emissions from the waste
sector fell.
Harvesting
of trees led to a rise in emissions from the land use and forestry
sector. Forests absorb carbon dioxide from the atmosphere as they
grow, storing carbon in tree trunks, branches, leaves, roots and
soils.
Harvested
wood products and leftover roots and branches also emit carbon as
they decay, are discarded from use, or are burnt

No comments:
Post a Comment
Note: only a member of this blog may post a comment.