NASA: World Just Saw its Hottest June, July and August on Record
14
September,2015
The
world is now well on its way to seeing back-to-back hottest years on
record. Unprecedented and amoral burning of fossil fuels is now
forcing the global temperature average to rise into the range of 1
degree Celsius above 1880s averages — or halfway to a catastrophic
2 C warming. A level at which scientists believe many climate change
tipping points will be irrevocably crossed.
June,
July, August Were Hottest On Record
According
to NASA GISS,
global temperatures for the June, July and August period of 2015 were
0.78 degrees Celsius (C) above the 20th Century benchmark or about
0.98 C above 1880s averages — when global record keeping began. The
previous hottest three month period occurred during 1998 at +0.72 C.
Notably, June, July and August were the hottest three months for
1998. But for 2015, December, January and February came in at +0.83 C
and March, April and May came in at +0.81 C. These extreme
temperature departures, when combined with the June, July and August
readings, now put 2015 at +0.80 C above average for its first 9
months — or well above any previous record-breaking year. A
significant single year margin above the previous hottest year —
2014 — of +0.05 C (a single year rate of warming about 150 times
the average rate of warming at the end of the last ice age).
August
of 2015 Comes in As Second Hottest Amidst Global Warming And El Nino
Signature Temperature Anomalies
August
itself came in at +0.81 C above NASA’s 20th Century benchmark
average. This departure marked the second hottest August reading in
the 135 year temperature record, falling just 0.01 C behind the
previous hottest August reading hit just last year (2014).
Geographic
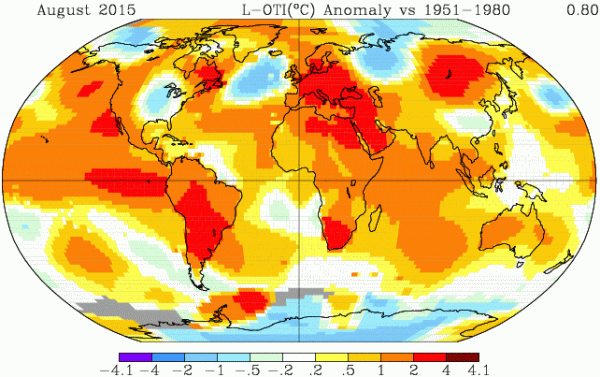
distribution of temperature anomalies continue to show the signatures
of both a strong El Nino and a growing climate change related signal.
The August El Nino signature was particularly strong in the Eastern
and Central Equatorial Pacific with 1-4 degree Celsius hotter than
normal temperature departures dominating the region. This heat
extended throughout the anomalous ‘Hot Blob’ or ‘Ridiculously
Resilient Ridge’ zone that has continued to be dominated by extreme
sea surface temperature departures with 1-4 degree Celsius above
normal temperatures pervading. Such extreme heat was linked to
equally extreme drought and wildfire conditions dominating broad
sections of the North American west throughout the month. Conditions
that, for many areas, have been endemic for many months running.
Anomalous
heat also dominated the land masses of South America, Europe, South
Africa, and the Lake Baikal region of Russia. These areas experienced
some or all of the following: extreme drought, wildfires, water
resource stresses, extreme heat-related weather, and heatwaves. A
cool pool in the Northern Atlantic between England and Newfoundland
remained a prominent feature. This cool region is associated with
climate change related conditions that are now in the process of
weakening both the Gulf Stream and North Atlantic bottom water
formation. It’s a set of conditions that weakens equator to
mid-latitude heat transport and intensifies the North Atlantic storm
track. An upshot of human-forced warming that has been predicted for
decades by even the most rudimentary of global climate models but
that now appears to be cropping up a bit earlier than previously
expected (see
World Ocean Heartbeat Fading?).
Persistent troughs over Eastern North America and Western Russia also
generated their own cool pools. Meanwhile, surface temperatures over
Central Antarctica dipped into cooler values — likely associated
with intensification of storm systems in the Southern Ocean.
(NASA
zonal temperature anomalies show a signature consisted with strong El
Nino and related equatorial warming. Image source: NASA
GISS.)
NASA’s
zonal anomalies map also displayed a strong El Nino signature with
the global equatorial zone showing the highest above average
temperature departures (in the range of +1.3 degrees Celsius). This
extreme heat maintained throughout the Northern Hemisphere
mid-latitudes all the way to 60 North before falling off to between
+0.2 to +0.4 C near the pole. Progressing southward, anomalies
steadily declined, even dipping into a range of 0 to -0.9 C anomalies
in the region of 75 to 90 South.
Conditions
in Context — Record High Temperatures and Related Extreme Weather
in the Pipe
Consistent
high temperature departures near the Equator, as we see now, tend to
aid both in storm track intensification and a general flattening of
the Jet Stream. Though these conditions have not yet dominated in the
Northeastern Pacific, a continuation of the August temperature
departure pattern and related strong El Nino will likely both
intensify the Northeastern Pacific and North Atlantic storm tracks as
Fall progresses. Such a shift, however, would have to be very extreme
to bust the 3 year running California Drought.
Overall
temperature departures for both August and for the June, July, August
period are well outside the range of anything that could be
considered normal and are swiftly rising to more and more unsafe and
climate destabilizing levels. The emergence of the North Atlantic
cool pool is a feature specifically related to storm intensification
and regional and global weather destabilization. A feature predicted
by global climate models due to human forced warming, related melting
of Greenland ice, and the upshot slowing down of critical ocean
currents. The recent unprecedented Hot Blob in the Northeastern
Pacific was likewise predicted in the scientific research as a result
of human forced warming — a feature that, it was warned, could
result in much warmer and drier conditions for the North American
West Coast. Climate change related heat signatures such as these
clearly show in the NASA monitor even as the global measure keeps
rising to new and more dangerous extremes.
Links:
(Please
support public, non special interest based, science like the
fantastic work done by NASA’s GISS division and without which this
report and related analysis would not have been possible.)


No comments:
Post a Comment
Note: only a member of this blog may post a comment.