

2016 on Track for Record Rate of Atmospheric CO2 Increase
1
November, 2016
During
2016, the
annual rate of atmospheric carbon dioxide increase will have hit a
record 3.2 to 3.55 parts per million (ppm).
By 2017, the amount of carbon dioxide in the Earth’s atmosphere
will be roughly equivalent to concentrations last seen during
the Middle
Miocene climate
epoch (404 to 410 ppm average). In other words, atmospheric CO2 is
rising at a record rate and we are hitting levels of this
heat-trapping gas that have not been seen in about 15 million years.
Record
Rates of CO2 Increase
The
world is struggling to make the necessary turn toward reducing fossil
fuel-based carbon emissions. Global
emissions have plateaued at or near new record highs during the past
three years.
Conflicts over fossil fuel cuts and transitioning to renewable energy
embroil numerous countries. Climate change deniers hold significant
power in places like the United States, the United Kingdom, Canada,
and Australia. And facing off against those who would defend the
harmful interests of what could well be called the most destructive
industry to ever inhabit the planet, are a broad group of
environmentalists, scientists, concerned citizens, and renewable
energy advocates.
 (Global
carbon dioxide is approaching a level not seen since the Middle
Miocene period around 15 million years ago when atmospheric
concentrations typically averaged above 405 ppm and global
temperatures were 3-4 degrees Celsius hotter than 19th-century
averages. Record annual rates of CO2 increase in excess of 3 ppm each
year for 2015 and 2016 are swiftly propelling us into a climate state
that is more similar to this ancient epoch — a shift that is
producing increasingly harmful global consequences. Image source: The
Copernicus Observatory.)
(Global
carbon dioxide is approaching a level not seen since the Middle
Miocene period around 15 million years ago when atmospheric
concentrations typically averaged above 405 ppm and global
temperatures were 3-4 degrees Celsius hotter than 19th-century
averages. Record annual rates of CO2 increase in excess of 3 ppm each
year for 2015 and 2016 are swiftly propelling us into a climate state
that is more similar to this ancient epoch — a shift that is
producing increasingly harmful global consequences. Image source: The
Copernicus Observatory.)
As
the political turmoil ramps up, it appears that the Earth’s oceans
and biosphere are straining to draw in the massive volumes of these
gasses that we’ve been pumping out. Annual
atmospheric CO2 growth rates for 2015 were a record 3.05 ppm.
2016 appears to be on track to beat that high mark, being likely to
see a new annual increase of between 3.2 and 3.55 ppm.
Hot
Lands and Oceans Tend to Produce a Carbon Feedback
The
previous most rapid annual rate of atmospheric CO2 increase was 2.93
ppm during the strong El Niño year of 1998.
Back then, high ocean surface temperatures combined with
warming-related wildfires and droughts which spanned the globe to
reduce the Earth’s capacity to take in carbon. More carbon was
squeezed out of hot soils, burning forests, and warming oceans. Less
was drawn down. New record rates of atmospheric CO2 increase were
breached.
 (Except
for a couple of days, all of 2016 saw atmospheric CO2 levels above
400 ppm. Peak
values as measured at the Mauna Loa Observatory in May were 407.7
ppm.
By May 2017, atmospheric CO2 levels are likely to hit near 410 ppm —
a level not seen in about 15 million years. Image source: The
Keeling Curve/Scripps Institution of Oceanography.)
(Except
for a couple of days, all of 2016 saw atmospheric CO2 levels above
400 ppm. Peak
values as measured at the Mauna Loa Observatory in May were 407.7
ppm.
By May 2017, atmospheric CO2 levels are likely to hit near 410 ppm —
a level not seen in about 15 million years. Image source: The
Keeling Curve/Scripps Institution of Oceanography.)
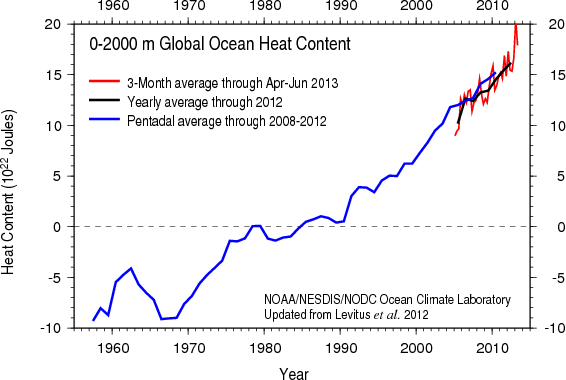
Even
during the period of heightened heat stress that occurred in 1998, we
did not see a year in which annual rates of CO2 increase exceeded 3
ppm. We have never, until 2015-2016, seen a time when there were two
back-to-back years of such rapid rates of increase. Similar but
worsening heat stress impacts have likely flagged what at first
appeared to be an increased
rate of carbon uptake from the biosphere during the late 2000s. Ocean
heat content is now dramatically greater than during 1998 and
this significant warming is likely having at least a periodic impact
on the ocean’s rate of carbon uptake. Wildfires are now far more
prolific, generating more atmospheric carbon. Droughts are more
widespread and these tend to squeeze carbon from the soil. The Arctic
is the warmest it’s been in 115,000 years and, as a result, some
new Earth system carbon sources are starting to pop up.
Record
High Rates of Fossil Fuel Emissions Hitting a Plateau
In
the intervening years since 1998, global carbon emissions from fossil
fuels have also jumped dramatically. During 1998, yearly CO2
emissions were in the range of 26 billion tons per year. By
2014-2015, these
greenhouse gas releases had soared to around 35.8 billion tons per
year.
Through this period, average
annual rates of CO2 increase continued
to climb during the 2000s and 2010s.
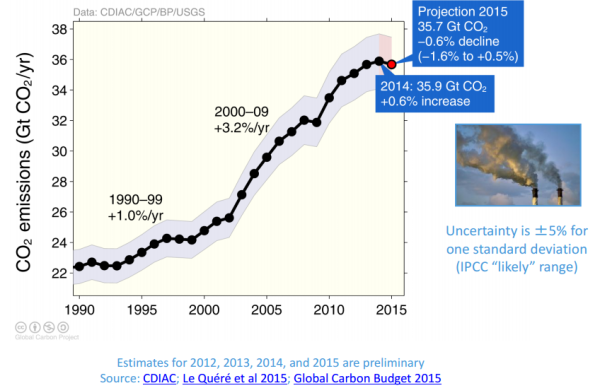 (Global
carbon emission increases stalled during 2013, 2014, and 2015
according to The
Global Carbon Project.
But despite this recent pause, atmospheric rates of carbon dioxide
increase have continued to ramp up. Due to a number of factors,
including atmospheric and ocean inertia as well as temperature and
saturation stress to global carbon stores, it is likely that
significant reductions in carbon emissions from fossil fuels will be
necessary to have a marked impact on annual rates of atmospheric CO2
increase.)
(Global
carbon emission increases stalled during 2013, 2014, and 2015
according to The
Global Carbon Project.
But despite this recent pause, atmospheric rates of carbon dioxide
increase have continued to ramp up. Due to a number of factors,
including atmospheric and ocean inertia as well as temperature and
saturation stress to global carbon stores, it is likely that
significant reductions in carbon emissions from fossil fuels will be
necessary to have a marked impact on annual rates of atmospheric CO2
increase.)
According
to NOAA,
the 1980s and 1990s saw yearly jumps in CO2 at the rate of about 1.5
ppm each year. By the 2000s, this average rate of increase had leaped
to about 2 ppm per year. For the first six years of the 2010s, the
average rate will likely be around 2.5 ppm per year.
New
Records Provide Urgency For Rapid Emissions Cuts
This
rate of increase roughly matches the overall rate of increase in
emissions. As yet, there is no major global trend sign in the
atmospheric CO2 data showing that carbon uptake from the oceans and
the biosphere has been significantly curtailed, at least not to the
point that it has shown up in the long term global trend. There are,
however, widespread signs of stress to the Earth’s carbon storage
system, and two years of 3 ppm-plus increase back-to-back is a
warning blip on the climate radar.
In
other words, these new record rates of CO2 increase are disturbing.
If the annual increases do not fall back into the low 2-ppm per year
range in 2017 and 2018, it will be an indication that some of
the Earth’s ability to draw down carbon has been significantly
hampered. If that is the case, then the urgency to draw down
emissions is considerably greater.
Links:
Hat
tip to SmallblueMike
(Note:
This post focuses primarily on CO2 as an indicator. Overall CO2e
levels will be covered in a separate exploration.)
No comments:
Post a Comment
Note: only a member of this blog may post a comment.