

Despite his charming faith in renewables as in The Choice Before us is Urgent: Sans a Swift Switch to Renewables, Dangerous Climate Change May Be Imminent Robertscribbler, along with Paul Beckwith is one of the most reliable communicators of how things are.
I refuse to go along with emotional claims that he "has joined the enemy". Everyone is entitled to their views so long as they don't distort the facts. The truth is pretty unpalatable.
One Month Above 1.5 C — NASA Data Shows February Crossed Critical Threshold
17
March, 2016
We
had a number of preliminary indicators that February of 2016 was
going to be ridiculously hot.
And, according to new reports from NASA, those indicators appear to
have born out.
In
short, we’ve just experienced a month that was more than 1.5 C
hotter than 1880s averages. It’s not a yearly average in this
dangerous range — but likely the peak reading from a very intense
El Nino combining with the growing base forcing of human climate
change. That said, it’s a foretaste of what could very easily
happen on a 5-15 year timescale in the annual measure if fossil fuel
burning and related carbon emissions do not radically ramp downward.
February
of 2015 was About 1.57 C Hotter Than 1880s Averages
According
to NASA GISS,
February of 2016 was the hottest February ever recorded by a long
shot with global temperature departures hitting a never-before-seen
above average range. Land and ocean temperature averages hit 1.35 C
above NASA’s 20th Century baseline (1951-1980). This
extraordinarily hot global reading represents a 1.57 C departure from
average temperatures in the 1880s. In other words, for one month
during February of 2016, global temperatures exceeded the dangerous
1.5 C threshold.
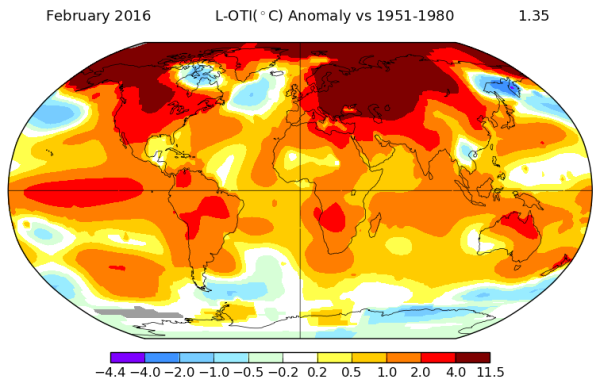
(February
of 2016 showed an extreme departure from global average temperatures.
Much of the extra heat focused on the Northern Polar region with the
High Arctic bearing the brunt of it. Image source: NASA
GISS.)
Japan’s
Met Agency also showed February temperatures exceeding 1.5 C above
1880s averages.
So we only await NOAA’s findings for final confirmation.
Overall,
these temperatures were the highest anomaly departure ever recorded
in the
NASA GISS monitor.
The previous highest anomaly reading being January of 2016 at +1.14 C
above 20th Century and +1.36 C above 1880s averages. Overall, the
three month period of December, January and February hit an amazing
+1.20 C above 20th Century averages or +1.42 C above 1880s averages.
Overall, this three month departure is +0.51 C above peak three month
departures during the 1997-1998 El Nino or a peak-to-peak warming
from strong El Nino to strong El Nino at a rate of 0.28 C per decade.
Such
high peak to peak increases may imply an acceleration above the
baseline rate of warming of 0.15 to 0.2 C per decade since the late
1970s. However, such above baseline rates of warming will need to
also bear out in the post strong El Nino record before such a claim
can be made with any confidence.
Ridiculous
Amount of Heat Over the Northern Polar Region
Looking
at the geographical distribution of these extreme, above average,
temperatures we find a broad swath of record heat in the range of 4
to 11.5 degrees Celsius hotter than normal covering a huge swath
surrounding and including the Arctic. A region stretching from just
north and west of the Great Lakes including Northwest Canada, Alaska,
the Beaufort and East Siberian Seas, the Chukchi, the Laptev, the
Kara, a huge expanse of Europe and Asia stretching from Eastern
Europe to Lake Baikal and north to the Arctic Ocean, the Barents, the
Greenland Sea, the Northeast tip of Greenland and most of the region
of the High Arctic above the 80 degree North Latitude line, all
experienced these extremely warm readings.
Still
very warm 2 to 4 C above average temperatures surrounded much of this
zone even as a broad 2-4 C above average hot spot is apparent over
the record El Nino region of the Eastern Equatorial Pacific. Smaller
regions experiencing similar 2 to 4 C anomalies include sections of
Brazil and Columbia, a region over Southern Africa, Northern
Australia and Northern New Zealand.
Overall,
very few regions show cooler than normal temperatures — though the
cool pool just south and east of Greenland continues to stand out as
a feature that is likely related to human-forced climate change.
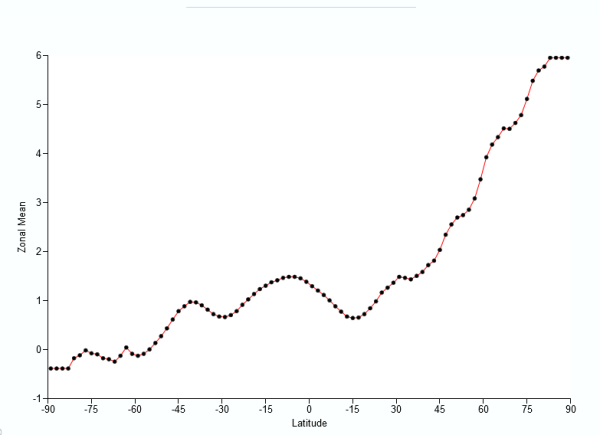
(Zonal
anomalies show an extreme polar amplification signature for February
of 2016. Image source: NASA
GISS.)
The
disposition of extreme temperature departures centering over the
Northern Polar zone is indicative of a pattern of extreme polar
amplification during a strong El Nino year. As such, we can infer
that the circumpolar winds did little to keep warm, Equatorial
Pacific air isolated to the lower Latitudes and instead had weakened
to the point that Equator to Pole heat transfer was facilitated.
The
temperature anomaly map at the top implies a warm meridional air flow
issuing directly from the Equatorial Pacific and over the Northeast
Pacific and Western North America. A second implied meridional wind
pattern appears running from the Eastern Equatorial Atlantic over
Western Europe and the Barents and Greenland seas. These dual Equator
to Pole warm air slots appear to have helped to push High Latitude
zonal anomalies in the polar region to very extreme warm temperatures
for February with the highest departures approaching 6 degrees
Celsius above average for the entire region north of the 80 degree
Latitude line.
(We’re
going to need a bigger graph to measure the Freezing Degree Day
anomaly below average which has now hit near -1,000. An above average
warmth that has continued since a spate of record Winter heat during
February. It’s an all-time low in a measure that typically doesn’t
level off until June. For reference, the less Freezing Degree Days,
the closer the Arctic is to thawing. Image source: CIRES1.)
Zonal
anomalies remain high above the 45 degree North Line — hitting a
steep slope from 2 C to 6 C as we progress northward. An Equatorial
peak in the range of 1.3 C above average is also observed near and
just south of the Equator. But despite an extreme El Nino, these
departures are nowhere near those seen in the upper Latitudes of the
Northern Hemisphere. Pretty much all zones except for the heat sink
region in the 60s South Latitude over the Southern Ocean and the far
south over Antarctica experienced above average temperatures for the
month.
Conditions
in Context — Signature of Climate Change in the Anomaly Maps
Continues, Global Temperatures to Settle Back into a New High Range
The
extreme polar warming, the visible warm air slots facilitating
Equator to Pole heat transfer, and the overall very strong global
temperature departure for February continue to express the signature
of human forced climate change as predicted by many of the global
model runs. The extreme Winter heat in the Arctic — while a sign of
things to come during this strong El Nino year — is also an early
blow to snow and ice in the Arctic for 2016 and 2017. Already, snow
totals are at or near record low extent levels. Meanwhile, sea
ice volume during February returned to near new record low levels as
measured by PIOMAS.
As a result, the melt risk to both sea and land ice in the Arctic
will likely be quite high over the next two years.
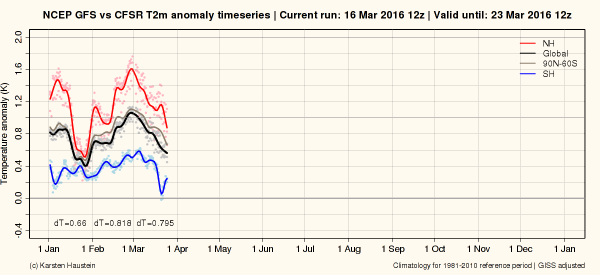
(GFS
temperature anomaly time series shows peak February 2016 global
temperatures falling off implying a March global temperature average
that will likely be somewhere between January and February values.
Perhaps in the range of near 1.4 C above 1880s or 1.2 C above the
NASA baseline. Image source: Karsten
Hausten using
GFS data.)
It
is worth noting, though, that February of 2016 will likely be the
highest monthly temperature anomaly we see for some time. A record El
Nino is fading away from peak intensity and NOAA is now predicting a
50 percent chance of La Nina conditions by Fall.
We can expect to see global temperatures now begin to fall off a bit
as a record El Nino starts to fade. To this point, 2016 will likely
hit a departure range near 1.2 or 1.3 C above 188os values. Post 2016
temperatures will likely hover up to 0.2 to 0.4 cooler than those
values during La Nina years, with new global records possible at the
onset of El Nino again in the 3-5 year timeframe.
To
be very clear, though ENSO sets the short term trend, the long term
trend is governed by a human forced accumulation of heat-trapping
gasses. And as long as that continues, the heating we’ve
experienced will also continue. Finally, since we are now very close
to hitting dangerous 1.5 and 2.0 C warming thresholds (possible
within 5 years for 1.5 C and 15 years for 2 C in the worst case), we
should be very clear that we are just passing the most recent peak in
a long progression. The trend, therefore, is up and we have now been
thrust into more dangerous times.
Links:
Northern Polar Melt Re-Asserts With A Vengeance — Arctic Sea Ice Volume Closed on New Record Lows During February
10
March, 2016
Arctic
sea ice volume hit near new record lows during February. That’s
kinda a big deal. What it means is that whatever sea ice resiliency
was recovered during 2013 and 2014 are now mostly gone. That record
all-time lows for sea ice set in September of 2012 are likely to see
a serious new challenge during 2016 and 2017.
*****
A
flood of severe Arctic heat — flowing up through the Barents and
Greenland seas in the East and over Alaska and the Bering Sea in the
West — has been hammering the Arctic Sea Ice all Winter long.
During February of 2016, new record lows in sea ice extent and area
were breached. Meanwhile, sea ice volume — as measured by PIOMAS —
also greatly declined to hover just above previous record lows for
this time of year set in 2011.
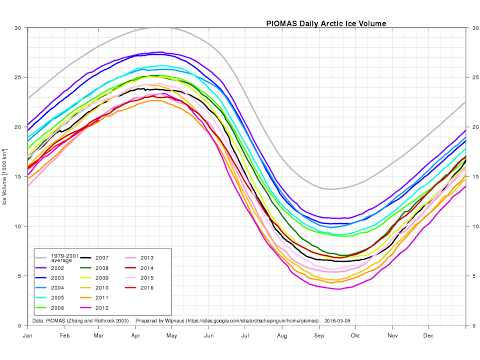
(Arctic
sea ice volume, as measured by the
Polar Science Center,
plunged back to near record low territory during February. Many
consider sea ice volume to be the key measure determining sea ice
health. So these new drops in the volume measure are a bit
spine-tingling. Image source: Wipneus.)
Looking
at the above graph, provided
by Wipneus,
and based on model and observation data collected by the
Polar Science Center,
it appears that for some days during February, volume measurements
even briefly descended into record low territory. As of early March,
volume totals were in the range of just above 20,000 cubic kilometers
— beating out 2012 as second lowest volume on measure and hovering
just above 2011.
Winter
Warming Grand Final
Over
the past ten days, abnormal warmth in the Arctic has faded somewhat.
The lower Latitudes have heated up with the onset of spring and this
has tended to strengthen the circumpolar winds. Perhaps the last bit
of seasonal change that can have this effect given the alterations to
atmospheric circulation produced by a human-forced warming of the
globe and a particular high concentration of this added heat
centering on the Arctic.
Ironically,
the time-frame of late February to mid-March is when the higher
Latitudes in the Northern Hemisphere tend to experience their coldest
temperatures. During 2016, we did see some of this atmospheric effect
take hold. As a result, temperatures in the High Arctic above the 80
degree North Latitude line have fallen from record warm readings in
late February to far above average warm temperatures over recent
days.
(Ever
since Early January, Arctic temperatures have been in near record or
record warm ranges. This consistent heat has resulted in the warmest
Winter temperatures ever experienced for the region above the 80
North Latitude Line. Image source: CIRES/NOAA.)
Today, another
very strong pulse of warmth is building up through the region of the
Barents and Greenland seas.
This heat pulse representing yet another warm wind event for 2016.
Another very strong south to north atmospheric draw flooding in front
of yet another chain of strong low pressure systems in the North
Atlantic. A flow of heat drawn up from the tropics and delivered to
the Arctic that will briefly drive regions near the North Pole above
the -2 C melting point of sea ice even as a wide wedge of 20 degree
Celsius above average temperatures invades a region stretching from
Northeast Greenland to the North Pole and back to the isle of Novaya
Zemlya in Russia.
Overall,
the sea ice in this region is much weaker than normal. Volume is
greatly thinned as both the relentless heat influxes and strong sea
ice export through the Fram Strait this Winter has leeched the area
of thick ice. Most sea ice measures show a loss in concentration and
volume for this area. But we’ll know more as the Earth tilts back
toward the sun and
visible satellite coverage again
takes in the entire Arctic.
Given
atmospheric changes taking place with Spring — where Continental
and lower Latitude warming hold greater sway over atmospheric
circulation — this may be the last burst of heat we see through
this zone that produces such high temperature anomalies. A grand
finale for the record warm Arctic Winter of 2016.
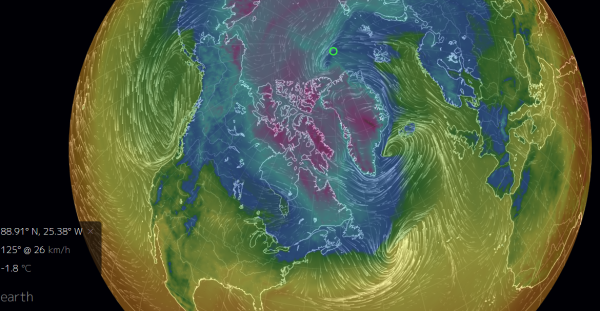
(Warm
North Atlantic Winds are predicted to blow into the Arctic yet again
on Saturday, March 12. These winds will push temperatures over a
broad region of sea ice to near freezing, driving such anomalously
warm temperatures all the way to the North Pole. Image source: Earth
Nullschool.)
To
be clear, long range model forecasts do identify far above average
sea surface temperatures and above average 2 meter air temperatures
for this region through Spring and on into Summer. However, the
Arctic overall is not as capable of producing such high temperature
anomalies during Summer as it is during Winter when the human
supplied greenhouse gas overburden and the related warming of the
oceans holds a much stronger sway — re-radiating an insane amount
of heat throughout the long polar night.
High
Arctic Temperature Anomalies Predicted to Fall-off For a Short While,
Melt Potential Through Summer Looks Rather Bad
To
this point, it appears the Arctic may be in for a brief respite on
the 3-7 day horizon. GFS
model runs indicate overall cooling for the region above the 66 North
Latitude line and
temperatures above 80 North may see their first period of near
average temperatures since late December of 2015. This respite for
the High Arctic, though, comes as temperatures in the Sea of Okhotsk,
the Bering, and along Hudson Bay are expected to warm.
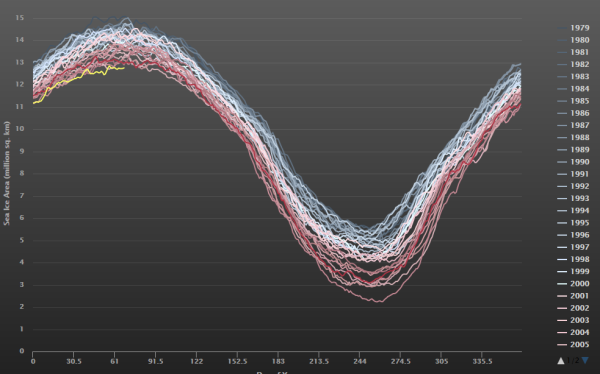
(Arctic
sea ice area remains at record low levels during March of 2016. Image
source:Cryosphere
Today.)
It’s
a mixed signal that may continue some of the very slight Arctic sea
ice rejuvenation we’ve seen during March — with sea ice area
still in record low territory, but with sea ice extent edging back to
second lowest on record and just slightly above 2015.
To
be clear, we’re at a very low launching pad for the start of melt
season in 2016. Record low or near record low sea ice volumes in
February and continuing record low area show that sea ice resiliency
is pretty terrible at this time. Furthermore, Northern
Hemisphere snow cover totals also at or near new record lows hint
that warming of the land masses surrounding the Arctic may be very
rapid come mid to late March and throughout April. To
this point, 10 day Euro model runs show
a tendency for rapid warming over the Northwest Territories, Alaska,
the Bering Sea, the Sea of Okhotsk, the East Siberian Sea, and far
Eastern Siberia during this period even as the thaw line pretty much
everywhere jumps swiftly northward.
A
fading record El Nino in the Eastern Pacific will also tend to result
in ample excess Equatorial heat heading northward. As a result, the
overall risk of strong sea ice melt through the Summer of 2016
remains very high.
Links:
No comments:
Post a Comment
Note: only a member of this blog may post a comment.