

2015’s Cruel Climate Count Continues as NASA Shows July Was Hottest On Record]

14
August, 2015
Andrew
Freeman is right. It’s
been a cruel, cruel summer.
Hothouse mass casualty events, spurred by a ridiculous accumulation
of heat trapping gasses in the Earth atmosphere, have spanned the
Northern Hemisphere. The result has been thousands of lives lost and
the hospitalization of tens of thousands more as global temperatures
rocketed to levels not seen in probably 100,000 years (related
— Hothouse
Mass Casualties Strike Egypt).
July
of 2015 Hottest on Record
Now,
in a record-shattering hot year featuring
extreme weather weirdness and an
emerging monster El Nino,
yet one more record has fallen. For according to
both NASA and Japan’s
Meteorological Agency (JMA),
July of 2015 squashed and smashed previous record hot Julys 2011
(NASA) and 1998 (JMA) to take the title as hottest July yet.
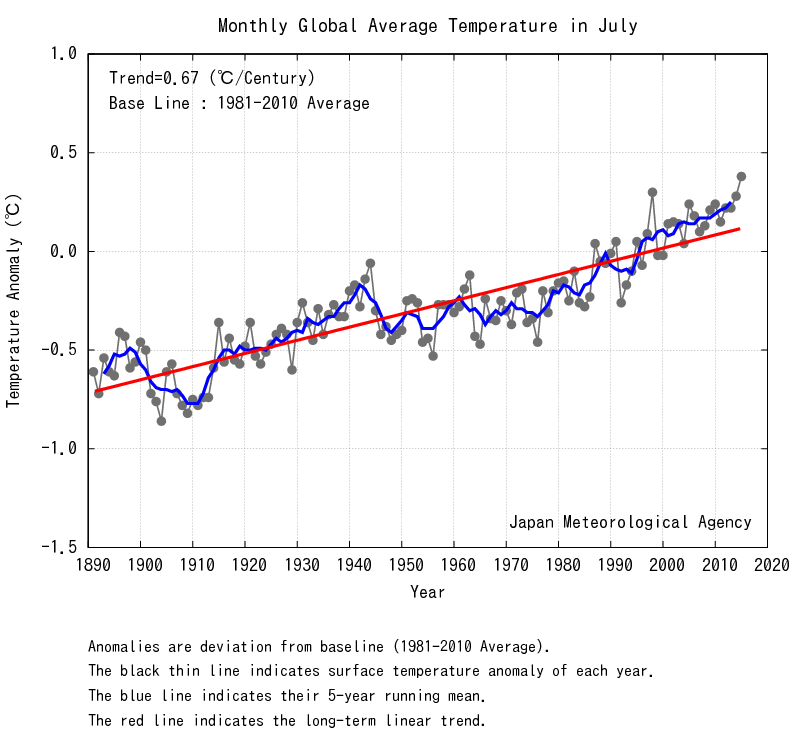
In
the JMA graph, beginning in 1890, you can plainly see the new July
record is well above the +0.67 C per Century warming trend line of
the last 125 years. A new high that leaves the 1998 super El Nino
year in the dust.
For
JMA, that’s 0.72 C above the 20th Century average and about 1 C
above 1890.
For NASA, global temperatures also hit a similarly hot range. July of
2015 was 0.75 C above their 20th Century base line — putting it at
about 0.95 C hotter than 1880s values when annual record keeping
began. Now we only wait on NOAA’s report coming out in a few days
for a final confirmation of this obscene July heat.
2015
On Track For Hottest Year By a Wide Marin
Focusing
in on the NASA measure,
we find that January through July temperatures are setting a course
for a record shattering 2015. Overall, global temperatures during
that seven month period were 0.8 C above NASA’s 20th Century
benchmark and about 1 C above 1880s values. A level of heat that, if
it were simply maintained, would beat out previous record hot year,
2014, by a substantial margin (0.07 C).
To
the layman, these may seem like small numbers except when one
considers that just 3.5 C of cooling from Holocene climates means the
start of a new ice age. In just 135 years we’ve hit 30 percent of
the difference between the Holocene and an ice age — but on the
side of hot. Moreover, an annual temperature climb of 0.07 C equals 7
degrees Celsius warming if maintained for one Century. So a one year
jump in that range is a pretty wide margin, especially when we
consider that we’re
now experiencing back-to-back hottest years on record.
El
Nino + Climate Change In the NASA Graphic
(NASA’s
July distribution of hot and cold temperature anomalies shows a world
that’s tipping more and more toward climate extremes. Image
source: NASA
GISS.)
Geospatially,
the representation of hot and cold temperature extremes in the NASA
map hints at an absolute mess for July weather patterns. While
abnormal and extreme warmth dominated the East Siberian, Chukchi, and
Beaufort airs, a plug of below average temperatures hovered over the
Laptev. Two substantial chimneys of heat extended into the Arctic —
one exploding up from the Hot Blob in the Pacific and another
stretching diagonally over the Lake Baikal region of Russia
(Related: The
Dry Land Burned Like Grass).
Most of Western Europe baked while the Yamal region cooled. In the
North Atlantic the Climate Change signature and storm generating cool
pool maintained — gearing up to throw
a few wicked cyclones at the British Isles in
the midst of, what should be placid, summer.
And
all across the equatorial region anomalous heat built — pushing
monthly temperatures from 1-4 degrees Celsius above average in some
of the typically hottest regions of the world. In this analysis we
must pause for a moment to point out the awesome and terrible wave of
heat building up from the Eastern Equatorial Pacific, telegraphing
through the Hot Blobs off the North American West Coast and extending
on up through the Bering Sea. A teleconnection feature that must fall
if California is to have any hope of receiving a drought busting set
of storms this Winter — monster El Nino or no.
The
mid-to-equatorial latitudes of the Southern Hemisphere were also
abnormally warm with few regions showing any departure into cooler
than ‘normal’ in this zone. Meanwhile, the Southern Polar Region
was a mess of hot ridges and cold troughs indicative of a very wavy
Jet Stream pattern for the zone. In particular, a ridge blazing south
through the Weddell Sea set off some much warmer than normal readings
for Coats Land and the Ronne Ice Shelf.
(Zonal
temperature anomalies for July show a clear signature of El Nino and
a climate change related heat sink in the Southern Ocean. Image
source: NASA
GISS.)
In
the NASA zonal map, we can clearly see the signature of El Nino.
Equatorial temperatures are the hottest in the measure pushing to
+1.3 degrees Celsius above average over the world’s belt-line. To
the north, heat gradually tapered off — still maintaining near +1 C
through the 40 degree line before dipping down to around +0.8 to +0.3
C in the 50s, 60s, and 70s and then rising again to around +0.7 C at
the pole.
To
the south, anomalies rapidly plunged throughout most zones —
dipping to +0.35 C in the range of the furious fifties (50 degrees
South Latitude). In the oceanic heat sink region where fresh and icy
water met the warmer, saltier waters of the Southern Ocean, heat
uptake by that ocean-atmosphere interface hit an extreme level as
negative zonal anomalies spiked to -1.4 C in the range of 65 South
Latitude. This ocean heat uptake and related atmospheric cooling is
associated with a global warming related fresh water outflow due to
Antarctic glacial melt — the Southern Hemisphere version of the
North Atlantic cool pool. Zonal temperatures swing again
higher, hitting +0.6 C at the land glacier edge in the region between
70 and 80 South, before dipping to around -0.7 C in the Antarctic
interior near 90 South.
Conditions
in Context
During
the record hot July of 2015 temperature and weather hit new extremes.
Variation between hot and cold temperatures became greater over many
regions of the globe as hot and cool pools grew in prominence and
related weather influence. Glacial melt and ocean current change
related cool pools dominated the North Atlantic and a band near 70
South in the Southern Ocean. Meanwhile, extreme equatorial heat
associated with El Nino developed teleconnections with high amplitude
ridges — especially with the Hot Blob related Ridiculously
Resilient Ridge over the Northeastern Pacific.
In
addition, a synergy developed between high ocean temperatures,
related high humidity, and a number of dangerous heatwaves. Near
record and record hot waters in the regions of India, Pakistan, and
Japan synergistically enabled deadly, mass-casualty producing
heatwaves in those regions. This is due to the fact that hot waters
enable higher wet bulb temperatures over land — pushing wet bulbs,
at times, close to the human survival limit of 35 C.
With
Global temperatures now at 1 C above 1880s levels we begin to witness
hints of what a human-forced hothouse may look like. But what we see
now are only the early, easy outliers.
Links:
(Please
support public, non special interest based science, like the
fantastic research produced by NASA and JMA without which this report
would not have been possible.)
You really wrote an awaking blog that will aware to the world from the dangers of Global warming.
ReplyDeleteYour valuable blog aware us from the side effect of increasing the temperature.
Record Heat