

With No Relief in Sight, Extreme to Exceptional Drought Now Covers Over 80 Percent of California
22 July, 2014
It’s no longer a question of 100% drought coverage for the stricken state of California. That barrier was crossed months ago. Today, it’s how severe that drought coverage has become. And in a state that is sitting just east of what appears to be a years-long impenetrable barrier of blocking high pressure systems, the situation just grows worse and worse.

(California drought map as of July 15, 2014. Areas in orange indicate severe drought, red indicates extreme drought, and brick indicates exceptional drought. Image source: US Drought Monitor)
For
Californians now used to watching storm systems veer far to the
north, carrying their precious load of moisture away from the state,
the water scarcity situation grew more dire last week as nearly 82
percent of the state slipped into extreme and exceptional drought.
These two aridity ratings are the highest levels provided by the US
drought monitor. The other 18% of the state not covered by these two
extremes merely sweltered under severe drought conditions.
To
the east and north, other states quietly slipped into total drought
coverage as well. Nevada, Arizona, and New Mexico show 100 percent
drought coverage, with Utah and Oregon not far behind at 90% +
coverage.
It’s
a situation that will continue to deepen so long as a climate-change
induced long-term blocking pattern remains in place. And as of mid
summer, there appears to be little to over-ride a freakishly
persistent weather pattern that has now lasted into its second year.
Impacts
for California Deepen
Throughout
the state, signs of aridity abound. Hydroelectric power supplies are
in jeopardy, cities are hiring water police to ensure restrictions on
use are enforced, the state’s agriculture has lost more than 2.2
billion dollars so far this year, and drilling into the limited
supply of ground water has reached a record pace.
Snow
pack stores in the state’s Sierra Nevada Mountain range are long
since melted. Exposed glaciers are now dissipating at record rates
with some glaciers seeing 70 degree (F) temperatures on their lofty
perches atop 12,000 foot high mountains. Overall, current rates of
glacier loss, if sustained, will render the entire Sierra Nevada
Range in California ice-free within just 60 years, according to
recent estimates.
Recent
satellite imagery from NASA vividly shows this ominous loss of snow
pack over the past three years in which the powerful and persistent
west coast blocking pattern increasingly dominated:


(Top frame: California’s Sierra Nevada Mountain Range as of June 24, 2014 showing zero snow pack coverage. Bottom frame: same region of California showing much more widespread snow pack during early July of 2011. Image source: NASA’s Earth Observatory)
Note
that as of June 24 of 2014 the Sierra Nevada showed no snow coverage
in the satellite picture. This compares to recent years during the
2000s and 2010s when snow pack, though greatly diminished from past
decades, typically remained on some peaks throughout the summer. Now
all regions are devoid of white, cooling, water-providing snow and
even the glaciers have taken on a dirty gray and brown pallor.
Human-caused
Climate Change’s Role in the California Drought
Central
to the story of the years-long loss of California rainfall is a
large, high amplitude ridge in the Jet Stream that has tended to
dominate over the US and Canadian West Coast and a broad section of
the Northeastern Pacific. This ridge has involved a powerful south to
north flow of air up over the Northeastern Pacific and North American
West Coast. This flood of air often invaded the Arctic before
swooping down to deliver cooler air to the Eastern United States even
as the US West Coast sweltered and dried out.
This
high amplitude ridge in the Jet Stream is thought to have been
facilitated by a general loss of snow and sea ice cover that has only
intensified since 2007. For over the past seven years, not one day
has seen average sea ice coverage in the Arctic with typical sea ice
extent and area values ranging between 20 and 50 percent below levels
seen during the late 1970s and early 1980s. Such a major loss of ice
coverage is thought to be pulling the Jet Stream north even as it
makes it more wavy. These large waves, called Rossby Wave patterns,
tend to get stuck, as has been the case with the Pacific Ocean ridge.
This sticking weather pattern has lead to hot and dry conditions
persisting over California for more than two years now.
El
Nino Strong Enough to Break the Block Increasingly In Doubt
Earlier
this year, a major warming event in the surface and subsurface waters
of the Equatorial Pacific raised the possibility of a potential
strong El Nino later this year. But atmospheric conditions have
continued to remain unfavorable for strong El Nino formation.
Ironically, the very same powerful high pressure systems enforcing
heat and drought over the US West may also be strengthening the
equatorial trade winds and inhibiting El Nino formation.

(The
strong Kelvin Wave that formed this winter and spring has now
delivered most of its heat to the surface, aiding in the record
global temperatures of May and June. Atmospheric feedback reinforcing
this powerful Kelvin Wave has been sporadic at best, calling into
doubt the potential for El Nino formation. A second warm,
down-welling wave appears to be forming between 180 and 160 East
Longitude. If this second wave appears it may only be enough to
establish a weak to moderate El Nino. If it does not, the prospects
for El Nino may fade. This is bad news for those hoping for drought
relief in California but, perhaps, short-term good news for a globe
already reeling under the impacts of human-caused climate change as
record atmospheric temperatures, globally, may not be so extreme for
2014. Image source: Climate
Prediction Center.)
A
strong El Nino may have broken the blocking pattern and delivered an
epic surge of moisture to the US West Coast (one that may well have
set off extraordinarily powerful storms for the region). But now,
NOAA only forecasts a weak-to-moderate event and the potential exists
that no El Nino will form at all.
This
is bad news for Californians suffering under one of the worst
droughts ever recorded for the state. It raises the potential that
the West Coast blocking pattern will remain in place for another year
or more. And with highs continuing to form and deepen off the US West
Coast, as the potential for a strong El Nino fades, there appears to
be little hope for relief for an already hard-hit area.
Links:
World In Hot Water: Screaming Sea Surface Temperatures Push Globe To Hottest June Yet

(Graphic of 135 year temperature record by NOAA. Image source: NCDC.)
22
July, 2014
According
to reports from NOAA, human-caused warming continued unabated into
June of 2014 as land and ocean surface temperatures spiked to 0.72 C
above the 20th Century average and about 0.92 C above 1880s norms.
These
new records were shoved higher by a broad warming of the ocean
surface, not just an Equatorial Pacific approaching El Nino warmth,
but also through an extreme warming of almost every major world ocean
zone. This hot water warmed local air masses and had a far-reaching
impact on global climate for the month, likely delaying the Indian
Monsoon, worsening the western US Drought and intensifying the record
wildfire outbreak in the Northwest Territory of Canada.
Widespread
Above Average to Record Heat, Few Cool Areas
2014′s
June rating beat out the previous hottest June, 2010, by about 0.03 C
and showed an increase over the 1998 spike by about 0.05 C.
As
global temperatures exceeded record levels, few regions experienced
below average temperatures. These zones were primarily isolated to a
region of the Pacific Ocean off the east coast of Japan and an
isolated region in the southern Ocean between South America and
Antarctica. Conversely, much of the globe experienced warmer than
average or much warmer than average readings.
Widespread
regions also experienced warmest on record temperatures with the
largest of these zones stretching east of the Philippines across a
broad swath of the Pacific, over a large patch of the Indian Ocean,
and pooling off the East Coast of South America. Other smaller, but
still extensive, regions of record warmest temperature emerged off
the US and Canadian West Coasts, in a zone between the UK and
Iceland, and over East Africa.
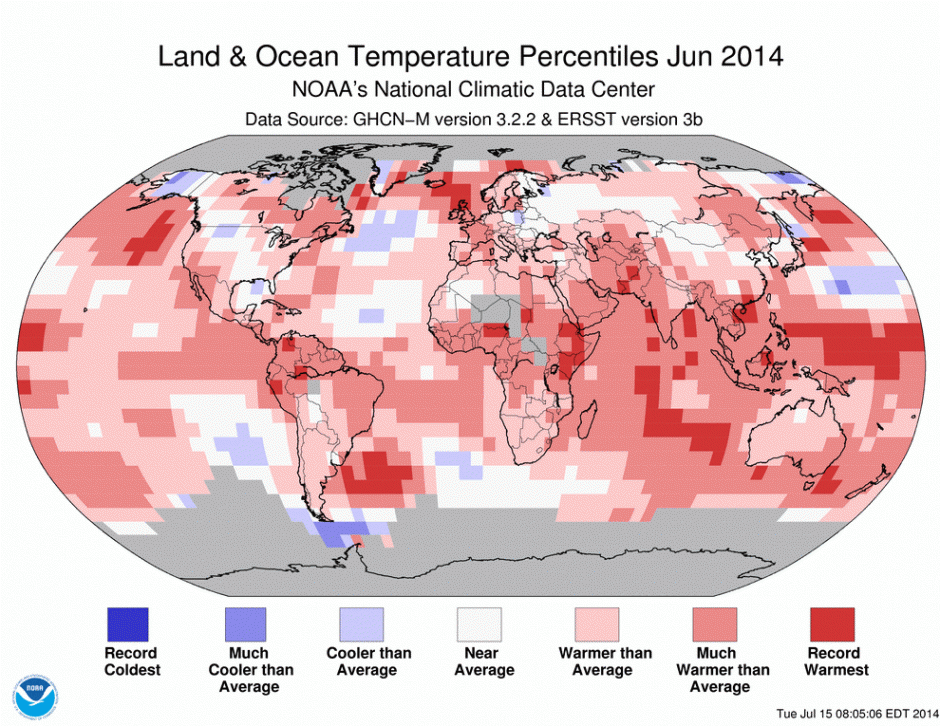
(Land and Ocean temperature graphic for June of 2014 shows most of the world sweltering under warmer than average to record warmest temperatures. Image source:NCDC.)
Other
monitors also showed record or near record global heat for the month.
NASA GISS marking the 3rd hottest June while Japan’s Meteorological
Agency also put June as #1 hottest. Both May and June have now broken
global temperature records in at least one of the major monitors and
NASA shows that the first quarter of 2014 was also the hottest
quarter since record-keeping began 135 years ago.
Record
Temperatures in Context
Overall,
atmospheric warming has continued at a pace between 0.15 C and 0.30 C
per decade over the past three decades. Current warming of 0.92 C
since the 1880s represents about 20% of the difference between now
and the last ice age, but on the side of hot. Present atmospheric
greenhouse gas loading of 400 ppm CO2 and 481 ppm CO2e, according to
paleoclimate data, contains enough heat energy to raise temperatures
between 2 and 3 C for the CO2 forcing alone, and 3 and 4 C for the
aggregate forcing, over the long term.
Near
2 C or greater global increases will likely be achieved during this
century even if greenhouse gasses are somehow stabilized. But rates
of human carbon emission is now in excess of 30 gigatons of CO2 and
approaches 50 gigatons of CO2e each year (when adding in all the
other human-emitted greenhouse gasses). At this pace, we hit enough
forcing to raise global temperatures by 5-6 C long-term and by about
2.5 to 3 C this Century within the next 20-30 years. Potential global
temperature increases grow greater if humans continue to emit
greenhouse gasses beyond this timeframe and if Earth Systems response
to human warming is greater than expected (large CO2 and methane
release from stores).
No
El Nino Yet Despite Record Warmest Ocean Surface
The
June record high readings occurred despite the Pacific Ocean
remaining in an ENSO neutral state. That said, sea surface
temperatures in the Equatorial Pacific for the month of June did
enter values typical to El Nino, so some ocean to atmosphere heat
transfer likely occurred over this broad region and aided in the
establishment of new records.
Globally,
ocean surfaces were very warm through the month, at times hitting a
+1.25 C positive anomaly above the 1979 to 2000 average. These were
the hottest ocean surface values ever seen — a primary factor
pushing over-all June temperatures to new highs.
NOAA
has adjusted its El Nino forecast to show a higher likelihood that
any declared El Nino is likely to be either weak or moderate. This is
due to an overall weak atmospheric feedback (only intermittent
westerly winds) to the initial ocean and near surface equatorial
temperature spike associated with a strong Kelvin wave this winter
and spring. Without continued atmospheric feedback, it appears
possible that the predicted El Nino may well fizzle. That said, the
NOAA forecast is still calling for an 80% chance of El Nino
developing sometime this year.
Given
raging sea surface temperature values outside of the Nino zones, even
a weak El Nino would likely set the stage for a new record high
global temperature for the year of 2014.
Links:
Wanna see what climate
change looks like? Check out
the vicious fires in northwest
Canada
By John
Upton

22
July, 2014
Lightning,
an intense heat wave, and low rainfall are lighting up
northwestern Canada like a bonfire, producing conflagrations that
scientists are linking to climate change.
More
than 100 forest fires are burning in Canada’s lightly populated
Northwest Territories, east of Alaska. Some residents are being
evacuated from
their homes; others are being warned to stay inside to avoid inhaling
the choking smoke. Take a look at the latest
map produced by the region’s fire agency:
" t
t
t
“Some
attribute that to climate change, and I’m one of those,” Mike
Flannigan, a professor of wildland fire at the University of
Alberta, told
CBC News.
“What we are seeing in the Northwest Territories this year is an
indicator of what to expect with climate change. Expect more
fires, larger fires, more intense fires.”
Boreal forests like those in the Northwest Territories are burning at rates “unprecedented” in the past 10,000 years according to the authors of a study put out last year. The northern reaches of the globe are warming at twice the rate as areas closer to the equator, and those hotter conditions are contributing to more widespread burns.
Further
south, Oregon and Washington state have declared
emergencies as
the same three forces — lightning, hot weather, and dry
conditions – fuel wildfires that have forced evacuations.
Elsewhere in the American West, major wildfires
are being battled in Nevada
and California.
No comments:
Post a Comment
Note: only a member of this blog may post a comment.